Abstract
Aims: Previous studies have shown lower rates of in-hospital complications and mortality for patients undergoing surgical aortic valve replacement (sAVR) in high-volume compared with lower-volume hospitals. It was the aim of our study to analyse whether there is a similar volume-outcome relationship for transcatheter aortic valve implantation (TAVI), which is increasingly used in clinical practice.
Methods and results: We analysed all patients with non-emergent transfemoral (TF) TAVI procedures performed in 2014 in 87 German hospitals. We used the German Aortic Valve score 2.0 to calculate the ratio of observed versus expected (O/E) in-hospital mortality. A total of 9,924 patients (age 81.4±1.1 years, 45.3% male, median log EuroSCORE 18.81%, IQR 4.55) were included. Average observed mortality was 4.3±3.3%, while the expected average mortality was 5.4±1.4% (mean O/E ratio: 0.8). Average in-hospital mortality was 5.6±5.0% (range, 0 to 16.7%) in the lowest volume group of hospitals performing <50 TF-TAVI annually compared to 2.4±1.0% (range, 0.5 to 3.7%) in the highest volume hospitals with ≥200 TF-TAVI procedures per year. There was a continuous, statistically significant association of lower O/E ratios with increasing TF-TAVI volumes (p<0.001), but without a clear-cut threshold. Major complications, neurologic events, and rates of new pacemaker implantation were not different between low- and high-volume hospitals.
Conclusions: Across the spectrum of hospital volumes from 11 to 415 patients undergoing TF-TAVI per year in Germany, there was a continuous, statistically significant association of lower average observed as well as risk-adjusted in-hospital mortality with increasing TF-TAVI volumes.
Abbreviations
CI: confidence interval
GAV score: German Aortic Valve score
G-BA: Federal Joint Committee of Germany
IQR: interquartile range
O/E mortality: observed/expected mortality
sAVR: surgical aortic valve replacement
TAVI: transcatheter aortic valve implantation
TF: transfemoral
Introduction
Previous studies have demonstrated lower rates of in-hospital complications, operative mortality and shorter hospital stay for patients undergoing surgical aortic valve replacement (sAVR) in high- compared with lower-volume hospitals1,2. Specifically, patients at predicted high surgical risk benefited most from being treated at higher-volume centres2,3. Recently, transcatheter aortic valve implantation (TAVI) has become an important alternative to sAVR for patients deemed at high surgical risk4,5, with accumulating evidence supporting its use even for elderly patients at intermediate or low risk6,7.
The relationship of hospital TAVI volume (a less invasive procedure compared with sAVR) and procedural outcomes in this high-risk cohort is less well known. Early data from a retrospective analysis of the US National Inpatient Sample 2012 have suggested that - similar to sAVR - volume-outcome relationships may also exist for TAVI8. Post-procedural complications including bleeding and myocardial infarction and mortality were significantly higher in lower-volume compared with higher-volume TAVI centres, for both the transfemoral (TF) and transapical (TA) access routes8. However, relatively small patient numbers and early experience limit the generalisability of these data.
Based on the previous studies, we hypothesised that such an inverse relation of hospital volume with outcomes may also exist for TAVI. We have therefore analysed the TAVI data set from the mandatory German Quality Assurance Registry on Aortic Valve Replacement (AQUA), comprising all TAVI procedures performed in Germany in 2014.
Methods
DATA SET AND PATIENTS
For the present analysis, we evaluated the complete 2014 data set of the German Quality Assurance Registry on Aortic Valve Replacement of the Federal Joint Committee (G-BA), led by the independent Institute for Applied Quality Improvement and Research in Health Care (AQUA, Göttingen, Germany). According to §137 Social Security Code V, the registry comprises all in-patient procedures (TAVI and sAVR) in hospitals registered under §108 SGB V billing to German statutory health insurance or private insurance companies (2014: 97 hospitals). The design of the AQUA registry has been described in detail previously9. In brief, all data are reported by standardised electronic entry with no routine on-site monitoring. Events are predefined in an elaborate form completion guide and self-reported by the sites using these definitions. Data are pooled in a nationwide database and controlled for quality by a validated system. In case of inconsistencies or deviations from predefined quality benchmarks, a structured dialogue with the hospital is initiated to trigger individual institution-designed quality improvement measures by standardised interviews9.
From this data set, only patients undergoing isolated, non-emergent TAVI via transfemoral (TF) access were selected. Emergency cases were excluded to avoid potential effects on in-hospital mortality by increased baseline risk in these cases and probable inhomogeneous distribution among hospitals. Patient data were aggregated at hospital level. The outcome analyses were performed on continuous volume-outcome relationship. In addition, for display purposes, hospitals were categorised into five groups according to the numbers of TAVI procedures performed in 2014 (<50, 50-99, 100-149, 150-199, and ≥200).
In the AQUA database, severe intraprocedural complications are defined as any device malpositioning, coronary ostia occlusion, aortic dissection, annular rupture, pericardial tamponade, left ventricular decompensation, stroke, moderate-to-severe aortic regurgitation, heart rhythm disturbances, device embolisation, and vascular complications during the TAVI procedure.
STATISTICAL ANALYSIS
The primary endpoint of our analysis was the relation of observed to expected in-hospital mortality (O/E ratio) for each hospital. The expected mortality (E) was calculated using the previously validated German Aortic Valve (GAV) score 2.0, which estimates in-hospital mortality based on 2013 patient data for isolated aortic valve procedures in Germany (sAVR and TAVI). The GAV score was developed via logistic regression and is the official risk score in Germany10. When O/E is equal to 1, the observed mortality is as expected, whereas O/E >1 or <1 indicates higher or lower observed mortality, respectively, compared with expected mortality based on the GAV score 2.0. The relation between patient numbers and the performance O/E ratio was modelled by a regression of O/E data for each hospital on patient numbers x through a logarithmic function y=a*ln(x)+const. An F-test was used, to test the null hypothesis a=0.
Results are presented as mean±standard deviation for the hospitals in the respective hospital group (volume level) for the outcome variable in-hospital mortality. Differences of means of hospital groups were tested with Welch’s test. The logistic EuroSCORE I was calculated for all patients. All statistical analyses were performed using SPSS for Windows, Version 24.0 (IBM Corp., Armonk, NY, USA). A p-value of 0.05 was considered significant.
Results
From the total number of 10,299 patients undergoing isolated TF-TAVI in Germany in 2014, 330 patients with emergency procedures were excluded. To minimise selection bias, an additional 45 patients from 10 hospitals performing ≤10 procedures annually were excluded due to the fact that, according to the official report of the AQUA Institute, the quality of these hospitals was not checked and there was no fatal case within these 45 patients, leaving 9,924 patients (age: 81.4±1.1 years, 45.3% male, median log EuroSCORE 18.81%, IQR 4.55) undergoing TF-TAVI in 87 German hospitals for analysis (Figure 1).
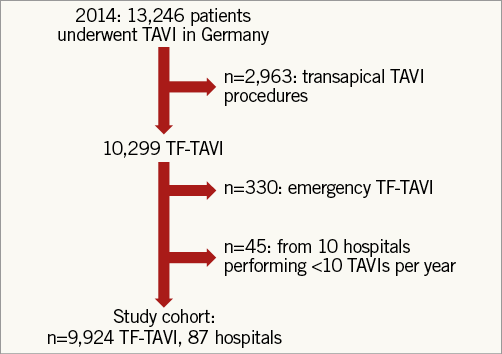
Figure 1. Study flow chart.
Of the 87 hospitals, 46 (53%) hospitals performed ≥100 with 14 (16%) of these performing ≥200 TF-TAVI procedures in 2014. These 46 hospitals treated almost 80% of all patients undergoing TF-TAVI (7,852 out of 9,924, average volume 171/year, range 102 to 415/year). The remaining 2,072 patients underwent TF-TAVI in 41 lower-volume hospitals (average: 51 patients/per year, range 11 to 92/year) (Figure 2).

Figure 2. Mean logistic EuroSCORE and GAV score 2.0 for each hospital according to annual number of TAVI procedures.
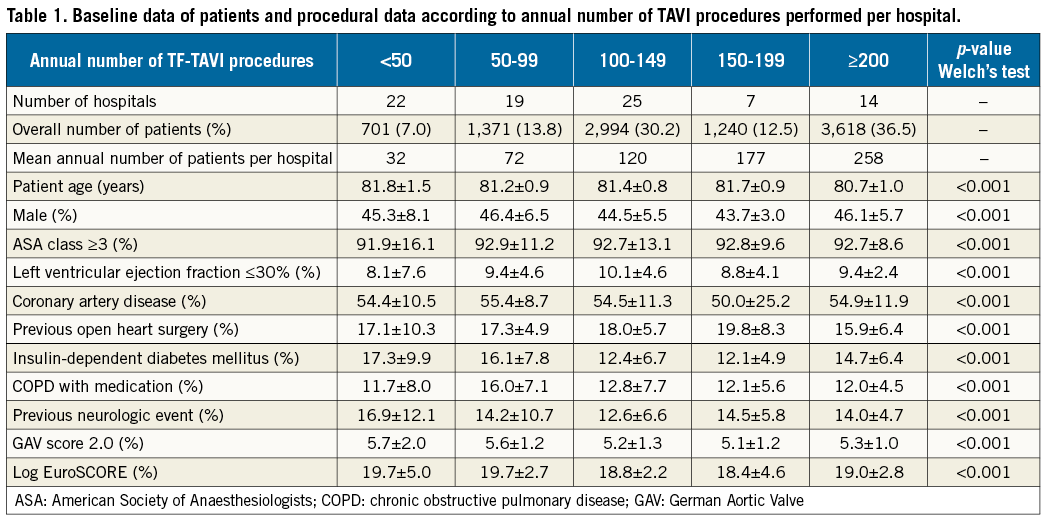
Baseline patient data are presented in Table 1, showing significant differences between the different hospital groups. Procedure times were significantly longer in lower-volume hospitals and decreased with increasing TF-TAVI workload (Table 2), particularly for hospitals with ≥100 procedures. The overall length of hospital stay, as well as post-TAVI procedure until discharge period, was longer among hospitals with a lower volume (Table 2).
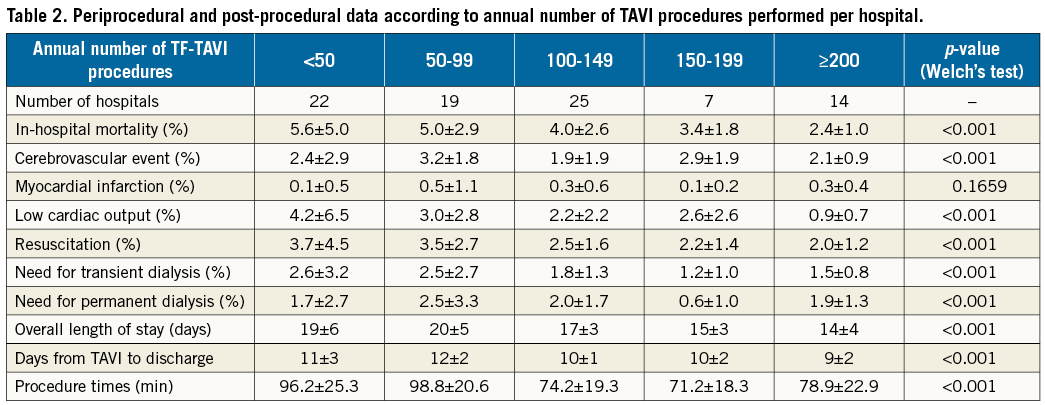
For the entire patient cohort, the observed (unadjusted) average in-hospital mortality rate was 4.3±3.3%. In the lowest volume group of hospitals performing <50 TF-TAVIs annually, average in-hospital mortality was 5.6±5.0% (range 0 to 16.7%) compared to 2.4±1.0% (range 0.5 to 3.7%) in the highest volume hospitals with ≥200 TF-TAVI procedures per year. Rates of observed in-hospital mortality for each hospital are depicted in Figure 3. There was a statistically significant association of lower average mortality with increasing TF-TAVI volumes (p<0.001).
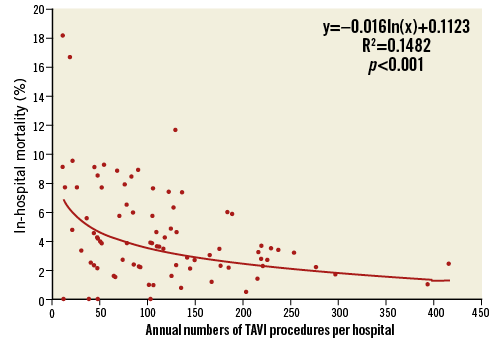
Figure 3. Unadjusted, observed in-hospital mortality for each hospital according to annual number of TAVI procedures.
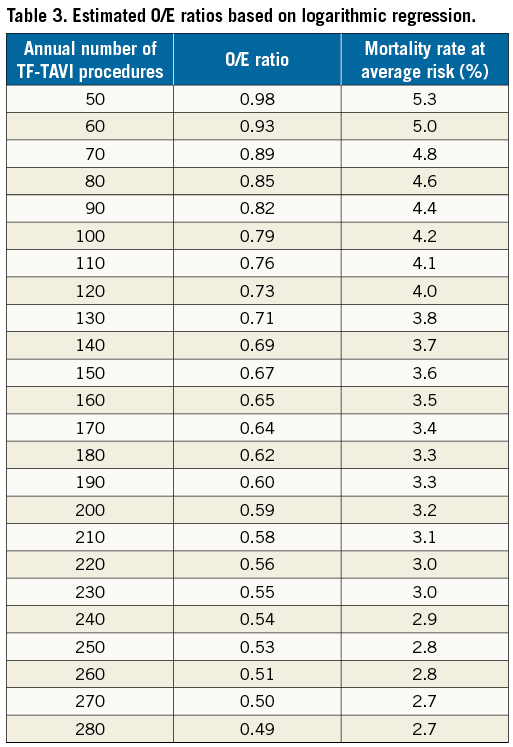
Figure 4 shows the O/E ratio for in-hospital mortality for each hospital. The mean O/E ratio was 0.8±0.7% for all TF-TAVI procedures (observed average mortality: 4.3%±3.3%; expected average mortality: 5.4%±1.4%). In the lowest volume group of hospitals performing <50 TF-TAVIs annually, the O/E ratio was 1.1±1.0 (range 0 to 3.9) compared to 0.5±0.2 (range 0.1 to 0.7) in the highest volume hospitals with ≥200 TF-TAVI procedures per year. In 59 (68%) hospitals, the observed mortality was lower than expected (O/E ratio <1). Nine of 22 (41%) hospitals with <50 cases and 10 of 19 (53%) hospitals with 50 to 99 cases had an O/E ratio >1 as opposed to seven of 25 (28%) hospitals with 100 to 149 cases and two of seven (29%) hospitals with 150 to 199 cases. Of note, not a single hospital with ≥200 cases had an O/E ratio >1. There was a significant trend towards decreasing O/E ratios with increasing hospital volumes (p=0.001). The regression of O/E values of the hospitals resulted in a performance curve described by y(x)=–0.285*ln(x)+2.099 (x: number of patients, y: O/E ratio). The estimated O/E ratios by the logarithmic regression curve (performance curve) are shown in Table 3. For 50 patients annually, the expected performance was 0.98, which is close to the overall O/E ratio for all AVR methods. For ≥100 patients annually, the expected performance was 0.79, which is close to the overall O/E ratio of TF-TAVI procedures in Germany.
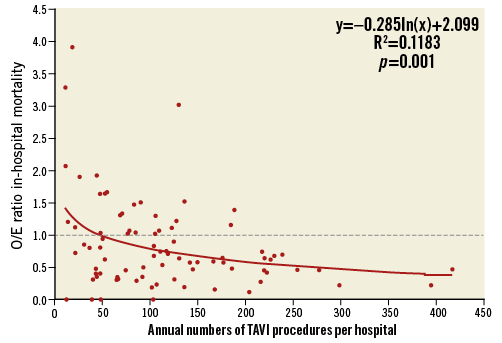
Figure 4. Observed to expected (O/E) in-hospital mortality for each hospital according to annual number of TAVI procedures.
Major complications, including severe intraoperative complications ultimately requiring emergency cardiac surgery, neurologic complications, vascular complications and rates of new pacemaker implantation, were not different between low- and high-volume hospitals (Table 2).
Twelve hospitals with more than 10 procedures did not have a cardiac surgery department. The O/E ratios did not differ between these hospitals without and those with a cardiac surgery department on-site.
Discussion
OUR STUDY FINDINGS
The present analysis of the prospective German Quality Assurance Registry on Aortic Valve Replacement comprising 9,924 patients undergoing TF-TAVI in 2014 is the first European study to evaluate volume-outcome relationship in TAVI patients. Our investigation suggested better average raw and risk-adjusted in-hospital mortality with increasing TF-TAVI volumes. Average in-hospital mortality was half in highest-volume centres performing ≥200 TF-TAVI procedures annually as compared to low-volume centres with <100 procedures and intermediate for those with TF-TAVI volumes of >100 and <200 procedures. Across the spectrum of hospital volumes from 11 to 415 TF-TAVI patients per year, there was a continuous, yet statistically significant association of better outcomes with increasing TF-TAVI volumes.
COMPARISON WITH PRIOR STUDIES
Our finding of inverse volume-mortality relationship in patients undergoing TAVI is similar to that previously demonstrated for patients undergoing sAVR. Patel et al2 suggested that, for every increase of 20 sAVR cases annually, the adjusted odds for mortality were lower (OR 0.98, 95% CI: 0.97-0.99). The mortality benefits were, however, mainly observed among patients with high predicted risk (OR 0.54, 95% CI: 0.35-0.83) with no significant difference in mortality between low- and high-volume centres among those at low predicted risk. Other studies have corroborated the findings of Patel and co-workers, demonstrating improved outcomes and lower complication rates for high-volume centres for sAVR1,11,12.
In contrast, the few studies that have so far examined volume-outcome relationship among patients undergoing TAVI have shown mixed results. Data from the 2012 US National Inpatient Sample (NIS) database suggested that hospitals with lower TAVI volumes had more frequent adverse events and higher mortality compared with higher-volume centres8,13,14. Badheka et al14 analysed outcomes of patients undergoing TAVI by dividing hospitals into quartiles according to the annual number of TAVI procedures (≤5/year: number of hospitals [patients] n=172 [342]; 6-10/year: n=42 [387]; 11-20/year: n=22 [388]; >20/year: n=12 [364]). Similar to the present analysis, mortality was half in the 12 highest volume hospitals (2.8%) as compared to the 172 hospitals with lowest volume (6.4%, adjusted OR [95% CI] for the 2nd: 0.92 [0.07-1.21], 3rd: 0.80 [0.60-1.06], 4th: 0.38 [0.27-0.54] tertiles referent lowest volume centre]). With increasing hospital volumes, length of hospital stay was significantly shorter as were hospitalisation costs14. Rates of vascular, respiratory, and infectious complications were lower in high-volume centres which, however, could not be confirmed in the present analysis.
In a separate analysis from the 2012 NIS database, Kim et al8 showed that low-volume hospitals had significantly higher rates of death (OR 1.55, 95% CI: 1.09-2.21) and bleeding complications (OR 1.53, 95% CI: 1.19-2.10) as compared to high-volume hospitals. Based on the median volume of procedures, a cut-off of 20 TF-TAVIs per year was chosen to separate high- from low-volume hospitals. For TA-TAVI (cut-off: 10 cases per year), a similar association was observed with higher mortality (OR 3.08, 95% CI: 1.69-5.65), higher rates of myocardial infarction (OR 5.43, 95% CI: 1.75-16.90) and new pacemaker implantation (OR 6.01, 95% CI: 2.96-12.20) for low-volume centres8. The vast majority of patients undergoing TAVI (88%) in their study were treated at high-volume hospitals8, as was also observed in the present analysis.
In the current study, the inverse volume-outcome relationship for TAVI appeared to be continuous, with no specific cut-off for defining a minimum number of annual TAVI procedures as a quality standard for hospitals performing TAVI. In fact, the cut-off of 20 TAVIs per hospital per year, as suggested earlier by Kim et al8, was achieved by almost all hospitals in the present analysis and may be less optimal with respect to contemporary real-life clinical TAVI practice.
Not all studies have supported inverse volume-outcome relationships. An independent analysis of the 2012 NIS database14 showed that, while observed in-hospital mortality rates were lower in hospitals performing ≥60 TAVI procedures per year as compared to those with <20 and 20-39 procedures, respectively (3.6% vs. 6.3% and 7.0%, respectively), once adjusted for baseline measured confounders, the annual TAVI volume as a continuous variable was not predictive of in-hospital mortality on multivariable analysis (OR 1.00, 95% CI: 0.99-1.00).
MECHANISM OF TAVI VOLUME-OUTCOME RELATIONSHIP
It has been speculated that improved outcomes in higher-volume hospitals are largely mediated by surgeon volume, i.e., greater experience (due to higher workload) of the operating surgeon15. In addition, surgeons with special expertise in certain procedures tend to work at such high-volume hospitals15. Birkmeyer et al found that the proportion of the effect of hospital volume that was actually attributable to surgeon volume was 100% for sAVR15. A more contemporary analysis comprising 6,270 sAVR procedures showed improved outcomes for increasing hospital volumes, but not for surgeon volumes2. Finally, Brennan and co-workers noted higher rates of risk-adjusted mortality rates for TAVI procedures at new (but not established) TAVI centres16. These data suggested that there may be a learning curve and that most low-volume centres are at the beginning of their learning curve and, as such, their outcomes have the potential to improve as experience grows. While the key mechanism of this relationship may simply hinge on “practice makes perfect”, understanding processes of care that may relate to TAVI outcomes is important before making any firm inferences.
CLINICAL IMPLICATIONS
Supported by strong evidence from randomised clinical trials and improved procedural safety and ease, numbers of TAVI procedures are rising exponentially in many countries. A further increase can be expected as a result of recent studies supporting TAVI not only in elderly patients at high risk4,5 but also in intermediate6 or even low surgical risk patients7. A minimum hospital volume of 50 TAVI procedures per year has recently been recommended by the German Cardiac Society to maintain appropriate standards to guarantee quality of care. This requirement is of course arbitrary in the absence of any real data. The present analysis showed that 2/3 centres in Germany already fulfilled this requirement. Yet, the outcomes, despite meeting these volume requirements, varied widely, suggesting that further data are needed before making firm recommendations regarding minimal hospital volume to perform TAVI.
Our analysis suggested that TAVI procedures are perhaps best undertaken in higher-volume centres. However, given the almost continuous inverse relationship of hospital TAVI volume with in-hospital mortality, a threshold for a certain minimum TF-TAVI volume to ascertain quality is difficult to define. Nevertheless, it appears that the curve of decreasing mortality somewhat flattened after 100 TF-TAVIs per year, suggesting that the so far recommended numbers of TAVIs per year may be too low. However, adjusted mortality among low and intermediate volume hospitals showed wide variations with slightly more than half of the hospitals with a TAVI procedural volume <100 (22/42) showing observed mortality lower than expected mortality (O/E <1), similar to that seen in very high-volume centres. Patel et al demonstrated similar greater variability of mortality after sAVR among lower-volume hospitals, with many hospitals having adjusted mortality similar to or even better than high-volume hospitals2. Thus, setting minimum standards for TAVI would not only deprive sites with lower volume but excellent outcomes from the opportunity to serve their patients in their own backyard, but would also probably overwhelm the larger-volume centres and delay treatment. In fact, if the results of good outcomes are reproducible over time at these low-volume centres, understanding the processes of care and the reasons for such excellent outcomes at these sites is likely to benefit others. This may potentially help minimise the variability and gap in outcomes observed among hospitals with different TAVI volumes.
Limitations
Our analysis is the largest to date and the first European study reporting on almost 10,000 patients undergoing TF-TAVI in Germany in 2014. Nevertheless, the present analysis is limited by the observational design of the AQUA registry. In Germany, participation in the registry is compulsory for all hospitals performing TAVI according to §137 Social Security Code V. All events are self-adjudicated and self-reported without routine on-site data verification10. As for all non-randomised, observational studies, we cannot exclude incompleteness of data. Nevertheless, such issues would apply for low- as well as high-volume hospitals and are thus unlikely to affect endpoints reported in the present study. We are unable to account for the influence of unmeasured confounders on outcomes. Our analysis is focused on in-hospital mortality of 2014 at hospital level. Data about the individual experience of operators and how long the TAVI programme was active in the hospitals are not available, but may have influenced the results. Our analysis is limited only to in-hospital adverse events and thus we are unable to provide insights into midterm or longer-term outcomes.
Conclusions
The present analysis of almost 10,000 patients undergoing TF-TAVI suggested an inverse relationship of hospital volumes with in-hospital mortality. There was a continuous trend of better outcomes with increasing hospital volume across the entire spectrum of TF-TAVI annual procedural volume. Whereas mortality rates were better for hospitals with >100 TF-TAVIs per year, wide variability existed among low- and intermediate-volume centres (<100 TF-TAVIs per year). Although the observational, retrospective nature of the current analysis limits firm minimum volume cut-off recommendations as a quality standard for institutions to perform TAVI, in general institutions with greater than 100 TF-TAVIs per year had lower procedural mortality. Future studies are needed to understand the processes of care at low-volume centres with excellent outcomes as well as to understand the key mechanisms underlying volume-outcome relationship before making any firm recommendations regarding minimum volume requirements for institutions performing TAVI.
| Impact on daily practice Our results suggest an inverse relationship of TAVI hospital volumes with in-hospital mortality, with a continuous trend of better outcomes with increasing hospital volumes across the entire spectrum of TF-TAVI annual procedural volume. |
Funding
This analysis was partly supported by an unrestricted grant from the German Cardiac Society.
Conflict of interest statement
The authors have no conflicts of interest to declare.
