Abstract
Aims: The European Collaborative Project on Inflammation and Vascular Wall Remodeling in Atherosclerosis - Intravascular Ultrasound (ATHEROREMO-IVUS) study was designed as an exploratory clinical study in order to investigate the associations between genetic variation, coronary atherosclerosis phenotypes, and plaque vulnerability as determined by IVUS.
Methods and results: The ATHEROREMO-IVUS study was a prospective, observational study of 581 patients with stable angina pectoris or acute coronary syndrome (ACS) who were referred for coronary angiography to the Thoraxcenter, Rotterdam, enriched with 265 IBIS-2 participants (total population, n=846). Prior to catheterisation, blood samples were drawn for genetic analyses. During the catheterisation procedure, IVUS was performed in a non-culprit coronary artery. The primary endpoint was the presence of vulnerable plaque as determined by IVUS virtual histology (VH). In addition, we performed a genome-wide association study of plaque morphology. We observed strong signals associated with plaque morphology in several chromosomal regions: twelve SNPs (rs17300022, rs6904106, rs17177818, rs2248165, rs2477539, rs16865681, rs2396058, rs4753663, rs4082252, rs6932, rs12862206, rs6780676) in or near eight different genes (GNA12, NMBR, SFMBT2, CUL3, SESN3, SLC22A25, EFBN2, SEC62) were most significant.
Conclusions: In conclusion, we found twelve SNPs in or in the proximity of eight genes, which were possibly associated with markers of vulnerable plaque. ClinicalTrials.gov Identifier: NCT01789411
Abbreviations
ACS: acute coronary syndrome
ATHEROREMO-IVUS: The European Collaborative Project on Inflammation and Vascular Wall Remodeling in Atherosclerosis - Intravascular Ultrasound study
BMI: body mass index
CAG: coronary angiography
CAD: coronary artery disease
HDL: high-density lipoprotein
IBIS-2: Integrated Biomarker and Imaging Study-2
IQR: interquartile range(s)
IVUS: intravascular ultrasound
LD: linkage disequilibrium
LDL: low-density lipoprotein
MDS: multidimensional scaling
PCI: percutaneous coronary intervention
SAP: stable angina pectoris
TCFA: thin-cap fibroatheroma
VH: virtual histology
Introduction
Genetic factors play an important role in the aetiology of coronary artery disease (CAD)1,2, and genetic markers may potentially improve risk stratification. Genetic markers can also be instrumental in developing therapeutic targets, as they are stable, and can be objectively measured and evaluated as indicators of normal biologic processes, pathogenic processes, or pharmacologic responses to therapeutic interventions. Genome-wide association studies in CAD patients are warranted to unravel further the complexity of coronary atherosclerosis3. The European Collaborative Project on Inflammation and Vascular Wall Remodeling in Atherosclerosis - Intravascular Ultrasound (ATHEROREMO-IVUS) study was designed to investigate the associations between the genetic profile and coronary atherosclerosis phenotype and vulnerability as determined by intravascular ultrasound (IVUS)4.
Methods
PATIENTS
The methods of the ATHEROREMO-IVUS study have been described in detail elsewhere4. Briefly, the target population consisted of patients aged 21 years or older with stable angina pectoris (SAP) or an acute coronary syndrome (ACS) who were referred for coronary angiography (CAG) or percutaneous coronary intervention (PCI). Patients had to have at least one non-culprit coronary artery without obstructive disease (<50% diameter stenosis) of at least 40 mm in length as assessed by on-line angiography to be used as the study vessel.
The initial ATHEROREMO-IVUS study cohort mainly consisted of 581 patients who were included during the period 2008-2011 at the Erasmus MC, Rotterdam, the Netherlands. This cohort was enriched with 265 patients from the Integrated Biomarker and Imaging Study-2 (IBIS-2) trial (inclusion period 2005-2006)5, a study with identical inclusion criteria that was conducted in 23 participating centres in 10 European countries. Thus, the final analysis cohort comprised 846 patients4.
ATHEROREMO-IVUS and IBIS-2 were approved by the medical ethics committees concerned, and written informed consent was obtained from all participants.
PHENOTYPING BY INTRAVASCULAR ULTRASOUND
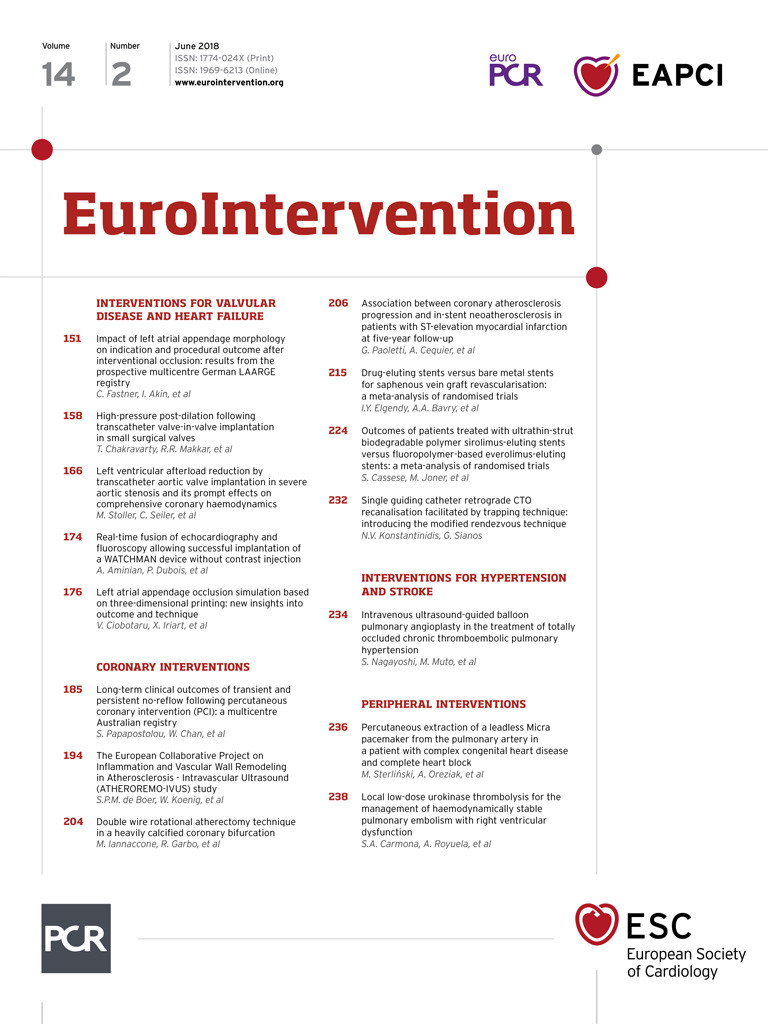
Intravascular ultrasound imaging of the study vessel was conducted for plaque phenotyping. The IVUS greyscale and IVUS radiofrequency backscatter analyses, known as IVUS virtual histology (VH), were performed using pcVH 2.1 and qVH software (Volcano Corp., San Diego, CA, USA). IVUS images were analysed offline by an independent core laboratory (Cardialysis BV, Rotterdam, the Netherlands), which was blinded to patient characteristics as well as to genetic and clinical outcomes. Study segment plaque burden was determined, whereas atherosclerotic plaque was categorised into four different tissue types: fibrous, fibro-fatty, dense calcium and necrotic core6. In consensus sessions with three investigators, the lesions were further classified into different lesion types (Table 1), including thin-cap fibroatheroma (TCFA)7. Remodelling of a lesion was assessed by means of the remodelling index.
GENOTYPING
Ethylenediamine tetraacetic acid (ETDA) blood samples were drawn from the arterial sheath prior to the CAG or PCI procedure, and these were then transported to the Erasmus MC laboratory for processing and storage at a temperature of at least -70°C. Blood samples were transported to the genotyping facility at the Mannheim Medical Faculty, Germany, for batch DNA extraction and genotyping. The Affymetrix GeneChip® Human Mapping 6.0 Array (Thermo Fisher Scientific, Waltham, MA, USA) was used for genome-wide analysis of 906,600 single nucleotide polymorphisms (SNPs).
QUALITY CONTROL
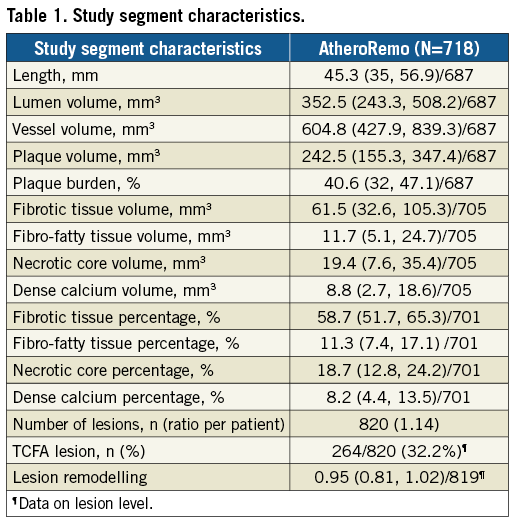
The data set was filtered to include only autosomal SNPs with non-complementary alleles and genotyping rate ≥0.9. PLINK’s multidimensional scaling (MDS) analysis was performed jointly on the study samples and the European samples from the POPRES data set6. First, the POPRES SNPs were pruned to decrease linkage disequilibrium (LD) using PLINK, so that no pair of SNPs with r2 ≥0.8 remained within sliding windows of 50 SNPs, offset by five. Additional SNPs or samples with genotyping rate ≤0.1 were removed. Next, the study SNP set and the POPRES SNP set were intersected, and MDS was performed on the resulting set. Eighty-nine outliers (individuals who were located outside of the main European cluster in the MDS plot) were detected in this step and discarded from further analysis. The results of both the European MDS and a global MDS (also using non-European POPRES samples) appear in Figure 1. The first four axes of variation from the European MDS were used as covariates in all association tests.
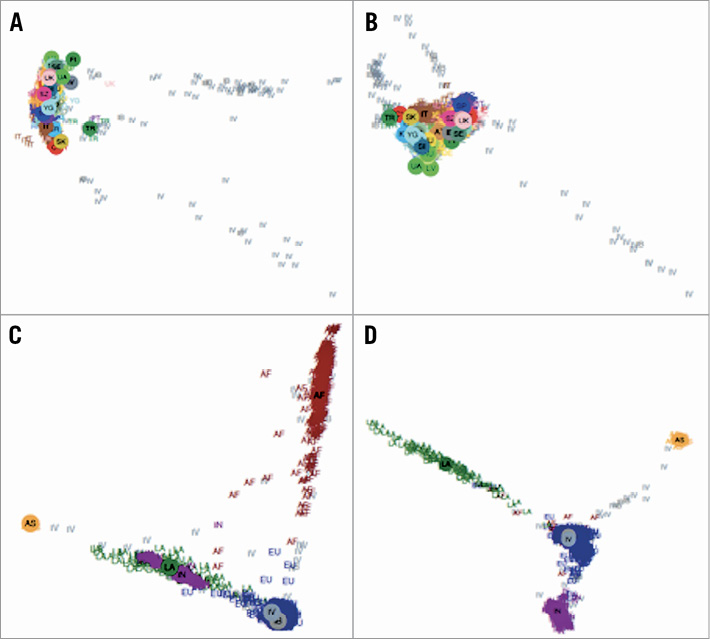
Figure 1. The European MDS and a global MDS (also using non-European POPRES samples). The plots display the first four axes of variation of the MDS analysis performed with the European (top) and global (bottom) POPRES diversity panels. A) European, axes 1-2. B) European, axes 3-4. C) Global, axes 1-2. D) Global, axes 3-4. AF: African-American; AS: Asian; EU: European; IB: IBIS; IN: Indian; IV: IVUS; LA: Latino; TR: Turkey
ADDITIONAL SAMPLE FILTERING AND IMPUTATION
PLINK’s IBD analysis was performed and six samples were removed so as to eliminate any pair with an estimated proportion of IBD (PLINK’s PI_HAT) greater than 0.1875. In addition, following PLINK’s heterozygosity analysis, 17 samples with outlier inbreeding factor (<–0.15 or >0.1) were removed. The genotypes used for imputation were filtered to exclude SNPs with a genotyping rate ≤0.04 or a minor allele frequency ≤0.0125. Imputation was performed with the 1,000 genomes European reference panel7 using BEAGLE genetic analysis software, version 3.3.28. Prior to that, strand consistency between the two data sets was verified using BEAGLE’s strand-checking utility.
ASSOCIATION
Samples in which reported sex did not match the sex detected by PLINK (15 samples) were removed to yield a final sample size of 719 individuals (Figure 2). SNPs with minor allele frequency ≤10/719=0.0139 were discarded.
Figure 2. Flow chart.
We used 28 IVUS measurements as phenotypes: 14 quantities describe the vascular segment that was analysed, and 14 quantities described the lesions detected in that segment, up to four lesions per individual. For each such phenotype, individuals with missing measurements or outliers (distant from the mean by over three standard deviations) were excluded. Phenotypes representing length or tissue percentages were square root-transformed. Phenotypes corresponding to volumes were cubic-root transformed and divided by the vascular segment length.
Linear and logistic regression models assuming an additive genetic model were used for testing association between SNPs and quantitative and categorical phenotypes, respectively. Each model included, in addition to the SNP and the phenotype, the following covariates: site (Erasmus MC/IBIS-2), sex, age, body mass index (BMI), segment length, and the sample’s coordinates along the first four MDS axes. Missing BMI values were imputed by the sex-specific median sample BMI.
In addition to the basic SNP vs. phenotype association tests, we examined the extended models, which included an interaction effect between SNPs and sex. We used a two degrees of freedom test for the combined marginal and interaction effects. An alpha error of 5.0e-08 was considered significant in this genome-wide association study.
TREATING SPECIAL PHENOTYPES
In order to increase the statistical power for the lesion-specific phenotypes, we employed two different strategies. The first approach involved considering as a phenotype the weighted average of multiple lesions in each individual. We used 1, 1.5, 2 and 3 as the weights for lesions 1, 2, 3 and 4, respectively. The second approach was to duplicate individuals with multiple discovered lesions, ending up with one lesion per individual. To account for the strong relatedness introduced by this step, we tested association with this phenotype using EMMAX9, which uses a mixed model that corrects for relatedness.
Association with lesion type was tested by dividing the lesions into two categories: the benign category included adaptive intimal thickening, pathological intimal thickening, fibrous and fibrocalcific, and the severe category included fibroatheroma, calcified fibroatheroma, TCFA and calcified TCFA.
DEMOGRAPHICS
Continuous variables are presented as arithmetic mean values and corresponding standard deviations (±SD), or medians together with corresponding interquartile ranges (IQR). Categorical variables are expressed as numbers and percentages. All demographic data were analysed with SPSS software, Version 20.0 (IBM Corp., Armonk, NY, USA).
LURIC AND CARDIoGRAM
Additionally, we studied within the LURIC and CARDIoGRAM data set the association between the SNPs we found and different phenotypes, biomarkers, and outcome. LURIC is a prospective study in 3,316 patients of German ancestry who underwent coronary angiography. All participants underwent comprehensive assessment of cardiovascular and metabolic phenotypes. A ten-year follow-up for mortality and causes of death has been completed10. CARDIoGRAM combines data from all published and several unpublished genome-wide association studies (GWAS) in individuals with European ancestry, and includes 22,000 cases with CAD, MI, or both11.
Results
PATIENT CHARACTERISTICS
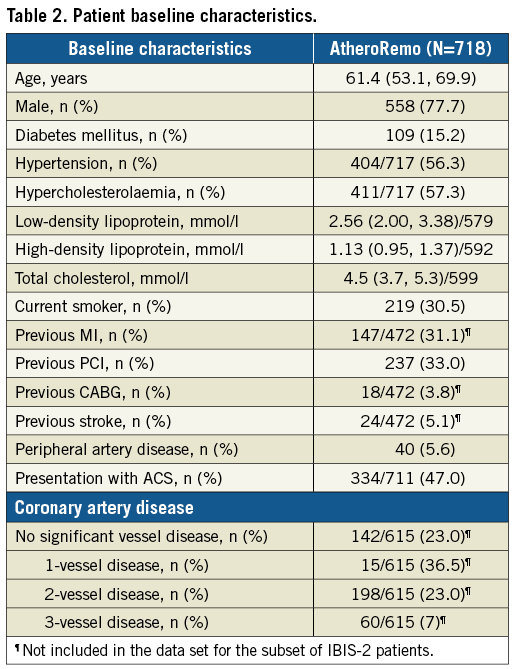
Baseline and procedural characteristics are presented in Table 1 and Table 2. Our patients were mostly men (78%) and the mean age was 61 years. Most patients were treated for stable angina pectoris (53%), but prior MI (31%) and prior PCI (33%) were common. The mean length of the studied segment was 45.3 mm, with a mean plaque burden of 40.6%. On average, the plaques consisted mostly of fibrotic tissue (59%), and 19% had a necrotic core; 32% of plaques were classified as TCFA.
GWAS ANALYSIS OF VULNERABLE PLAQUE
Multiple genomic locations were shown to be potentially associated with vulnerable plaque (Figure 3, Figure 4). We observed strong association signals in several chromosomal regions: twelve SNPs in or near eight different genes were most significant (Table 3).
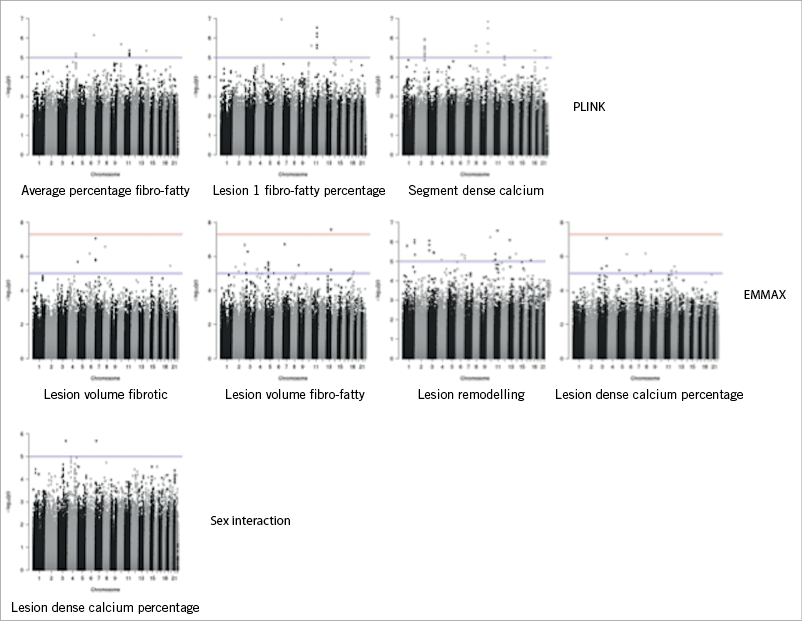
Figure 3. Manhattan plots: potential association between multiple genomic locations and vulnerable plaque.
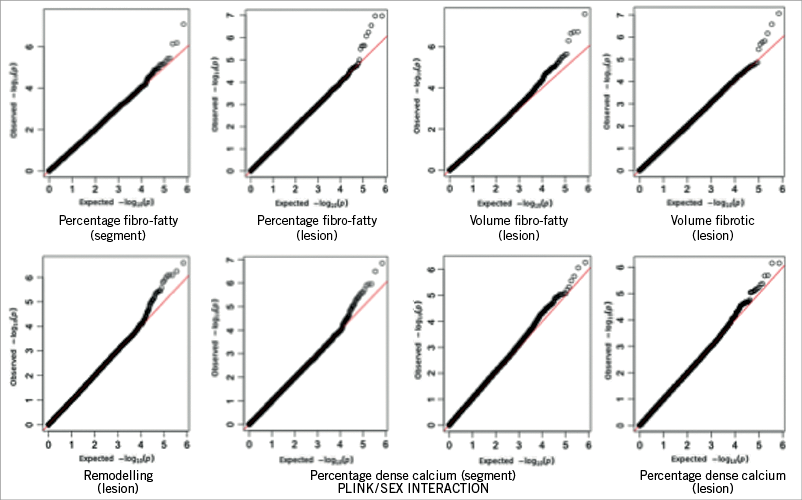
Figure 4. QQ-plots: potential association between multiple genomic locations and vulnerable plaque.
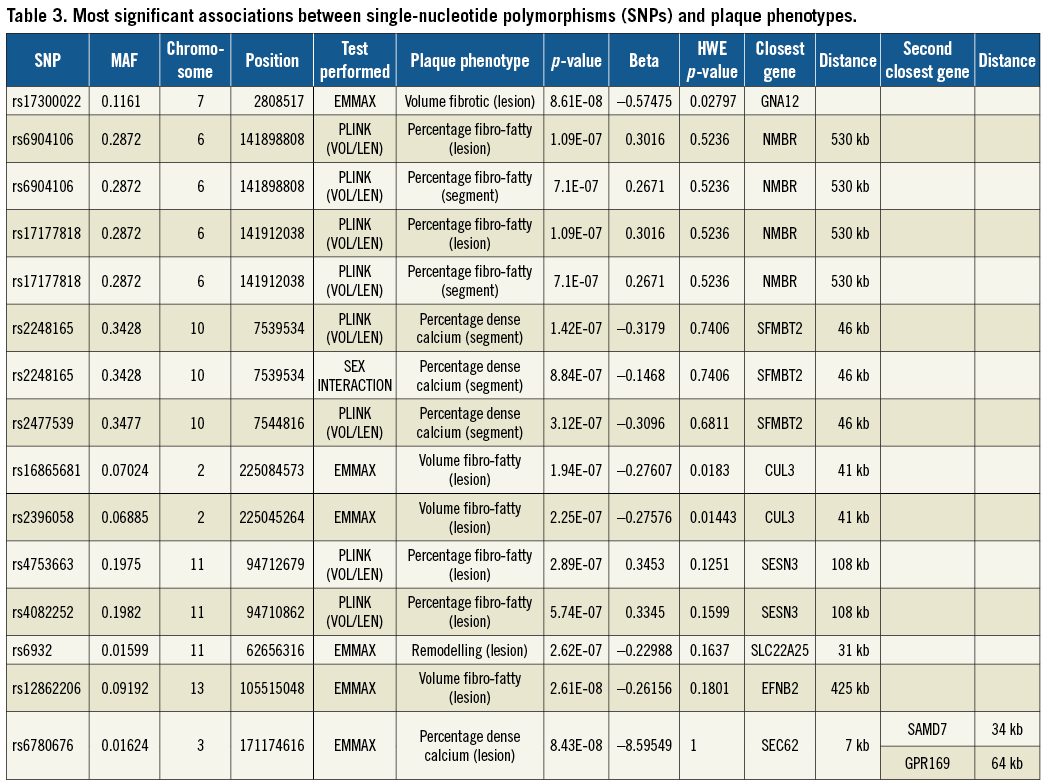
Rs17300022 in the GNA12 gene was significantly associated with fibrotic volume of the vulnerable plaque, p=8.61E-08. The SNP rs6780676 on chromosome 3 was associated with the percentage of dense calcium within the plaque, p=8.43E-08. A gene in the proximity of rs6780676 is SEC62 at a distance 7 kb. SEC 62 is part of the protein translocation apparatus in the membrane of the endoplasmic reticulum, and has been linked to prostate and lung cancer12. The rs6904106 and rs17177818 were associated with the percentage fibro-fatty material within the vulnerable plaque and are in the proximity (530 kb) of the NMBR gene. The NMBR gene, a neuromedin B receptor, binds to neuromedin B protein, and is involved in a number of physiological processes including immune defence, thyroid, adrenocortical function and cognition. NMB is also aberrantly expressed by a variety of cancers and is involved in tumour proliferation13.
Associated with dense calcium percentage of the plaque are rs2248165 and rs2477539, which are in the proximity (46 kb) of the SFMBT2 (Scm-like with four mbt domains 2) gene, which is a protein-coding gene that has been linked to prostate cancer14 and placental development15. Rs16865681 and rs2396058 are linked to the volume of fibro-fatty material of the plaque, and are close to the CUL3 gene, which encodes a member of the cullin protein family. Rs4753663 and rs4082252 are associated with the percentage of fibro-fatty material of the plaque and are in close proximity to the SESN3 gene. This gene encodes for a member of the sestrin family of stress-induced proteins. Rs6932 is associated with remodelling and is in closeness to the SLC22A25 gene, which encodes for the solute carrier family 22 member 25 protein. SLC22A25 is also known as organic anion transporter UST6. Rs12862206 is associated with the volume of fibro-fatty material of the plaque and is in the proximity of the EFBN2 gene, which encodes for the Ephrin-B2 protein.
LURIC
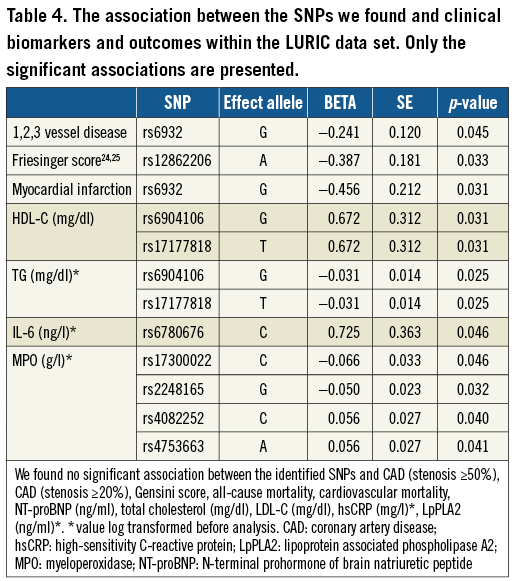
Within the LURIC data set we studied the association between the SNPs we found and clinical biomarkers and outcomes. Several associations with significant p-values were found (Table 4).
CARDIoGRAM
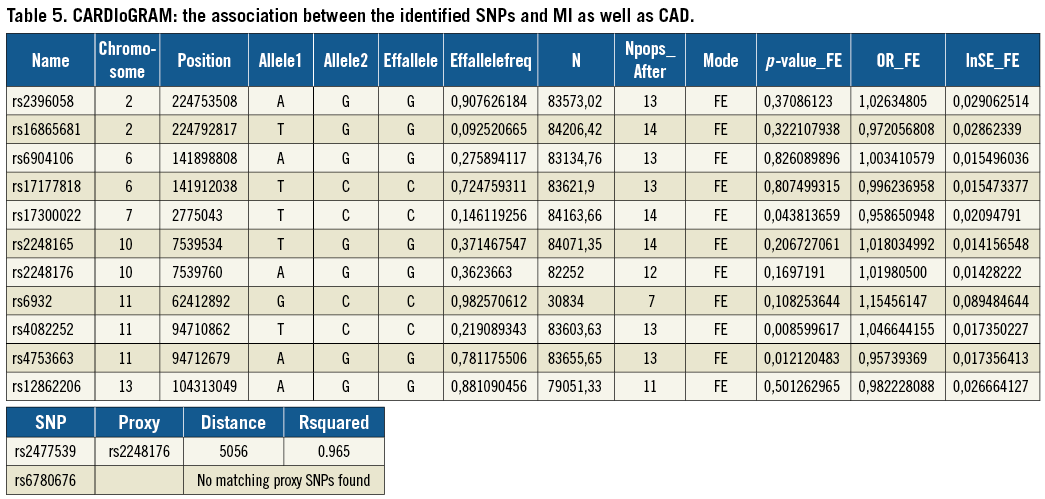
To study the found associations further, we used the CARDIoGRAM11 data set and analysed the association between the identified SNPs and MI as well as CAD. We found a statistically significant association between rs4082252 (OR 1.05- lnSE 0.02, p=0.009), rs475366 (OR 0.96- lnSE 0.02, p=0.012) and MI/CAD (Table 5).
eQTL AND HaploReg
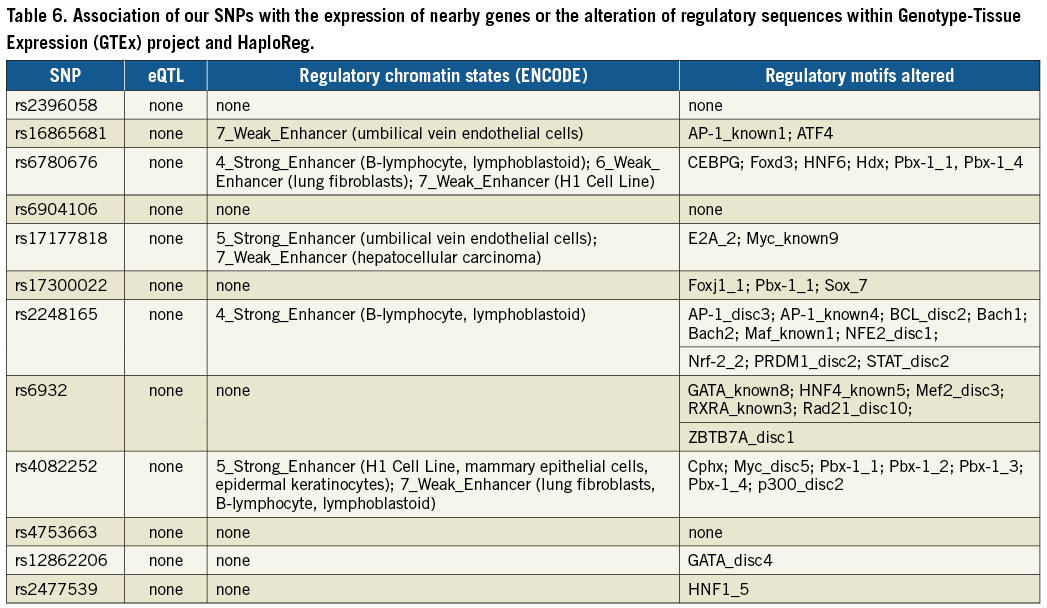
We searched the Genotype-Tissue Expression (GTEx) project16 and HaploReg17 for an association of our SNPs with the expression of nearby genes or the alteration of regulatory sequences. While we did not find any direct association with gene expression, a number of SNPs could alter regulatory motifs (Table 6).
Discussion
In this exploratory study of 719 CAD patients we found a strong association between IVUS-derived indicators of vulnerable plaque and twelve SNPS, in or near eight different genes.
We further studied these SNPs in the LURIC data set and additionally decided to explore our results further in the CARDIoGRAM data, in which we found two further significant associations between SNPs and CAD/MI; these two SNPs encode for two genes, namely GNA12 and SESN3.
The GNA12 gene was significantly associated with vulnerable plaque (dense calcium) and CAD/MI. The GNA12 gene encodes for the guanine nucleotide-binding protein subunit alpha-12 proteins, which are involved as modulators or transducers in various transmembrane signalling systems, and may play a role in the control of cell migration through the TOR signalling cascade18.
The SESN3 gene encodes for a member of the sestrin family of stress-induced proteins. The encoded protein reduces the levels of intracellular reactive oxygen species induced by activated Ras downstream of RAC-alpha serine/threonine-protein kinase (Akt) and FoxO transcription factor. The protein is required for normal regulation of blood glucose, insulin resistance, and plays a role in lipid storage in obesity19.
Limitations
There may simply be no direct causal link between the SNPs and vulnerable plaque, due to the phenotypic complexity of atherosclerotic vascular disease. Alternatively, there could indeed be a causal relationship which we were not able to detect. First, in this study we visualised 40 mm of a non-culprit vessel, and we might have missed the patient’s dominant phenotypic characteristic if this phenotype was only expressed in a coronary segment that had not been imaged (e.g., the culprit lesion). However, ex vivo as well as in vivo studies using IVUS have demonstrated the presence of TCFAs in other than the culprit lesion or even in the culprit artery. Furthermore, as we demonstrated earlier, the presence of IVUS-VH-derived TCFA lesions in a non-culprit coronary artery is strongly predictive of adverse cardiac events within one year, particularly of death and ACS20. Therefore, we consider the non-culprit artery a good reflection of disease burden of the larger coronary vasculature. Second, one might question whether IVUS-VH is suitable for the detection of vulnerable plaques. We believe it is, despite the fact that the spatial resolution of IVUS-VH (150 μm) is insufficient to replicate exactly histopathological definitions of a thin fibrous cap (<65 μm), and IVUS-VH therefore tends to overestimate the number of histopathological TCFA lesions21. As mentioned above, the presence of VH-TCFA was associated with impaired prognosis in our cohort20, an association also found in other studies22,23. Furthermore, TCFAs with a large plaque burden carry higher risk than small TCFA lesions, especially in the short term20.
Since all these patients have a culprit artery and the analysis concerns the non-culprit artery, there may be a bias in the selection of the patient population. Ideally, in the future, the best analysis or the best population for the genetic analysis would be a mixed population with and without PCI. However, this limitation does not invalidate the current findings in patients with culprit lesions.
Conclusions
We found twelve SNPs in or in the proximity of eight genes, which are possibly associated with indicators of vulnerable plaque.
| Impact on daily practice We identified two genes in particular, which, besides being related to vulnerable plaque, were also related to clinical outcome. Our results are hypothesis-generating, and need to be replicated in other, larger populations. |
Guest Editor
This paper was guest edited by Amir Lerman, MD; Department of Cardiology, Mayo Clinic, Rochester, MN, USA.
Funding
This work was supported by the 7th Framework Program AtheroRemo, grant agreement number 201668, of the European Union.
Conflict of interest statement
The authors have no conflicts of interest to declare. The Guest Editor has no conflicts of interest to declare.