Abstract
Background: Tangential signal dropout (TSD), which occurs when the optical frequency domain imaging (OFDI) beam strikes the vessel wall under a glancing angle and travels almost parallel to the vessel wall, is the most important imaging artefact leading to the erroneous diagnosis of lipid-rich plaques.
Aims: This study aimed to evaluate the OFDI artefact of TSD, which mimics the appearance of lipid-rich plaque and macrophage (Mø) infiltration.
Methods: A total of 1,019 histological cross-sections from 23 autopsy hearts were matched with the corresponding OFDI images. Of these, 232 OFDI cross-sections that contained signal-poor regions with diffuse borders were classified as lipid-rich plaques. The angle θ was calculated between the OFDI beam that strikes the edge of the luminal surface of the low-intensity region and that which strikes the surface line of the low-intensity region.
Results: On histological evaluation, 182 (78%) cross-sections were classified as histologically lipidic/Mø infiltration, while the remaining 50 (22%) cross-sections were classified as histologically non-lipidic/Mø infiltration. The angle θ was significantly smaller in the non-lipidic/Mø infiltration group than in the lipidic/Mø infiltration group (12±6° versus 37±14°, p<0.001). Receiver operating curve analysis revealed that the optimal cut-off value of the incident angle for predicting TSD was 23° with an area under the curve of 0.98.
Conclusions: When the OFDI imaging beam strikes the tissue at an angle θ<23°, TSD artefact could occur. To eliminate image misinterpretation, our findings suggest that the OFDI catheter geometry should be considered for the accurate diagnosis of lipid-rich plaques and Mø infiltration.
Introduction
Optical frequency domain imaging (OFDI) is widely used as an imaging tool for characterising coronary atherosclerotic plaques in vivo1,2. On OFDI, lipidic tissues appear as signal-poor regions with diffuse borders because of multiple scattering in lipids at light wavelengths of approximately 1,000 nm3. Therefore, it is believed that OFDI has the capability of differentiating lipid-rich tissue from fibrous tissue. However, recent studies have shown that OFDI image misinterpretation and artefacts could lead to misclassification of coronary tissue pathology4,5,6. One of the potential artefacts misdiagnosed as lipid-rich plaque on OFDI is tangential signal dropout (TSD)4,5. When the OFDI beam strikes the vessel wall obliquely, the light travels a longer path through the tissue to a certain radial depth, and the OFDI signal is weaker than in a geometry where the beam strikes the interface perpendicularly, which can produce images mimicking the appearance of lipid-rich plaque. Although previous ex vivo studies revealed that TSD artefact is not a rare phenomenon4,5, a detailed analysis regarding its incidence and the threshold angle for the appearance of TSD artefact has not been performed.
Methods
STUDY SUBJECTS
A total of 1,154 coronary cross-sections from 61 coronary artery specimens of 23 consecutive human cadavers were examined to compare OFDI and histological images. The cause of death was cardiovascular disease in eight cadavers and non-cardiac-related in the remaining 15 cadavers. All coronary arteries were dissected at autopsy within six hours after death. The harvested coronary arteries were stored immediately in phosphate-buffered saline. The time between death and OFDI examination did not exceed 12 hours. The experimental protocol was approved by the Institutional Review Board of Hyogo College of Medicine, and written informed consent was obtained from patients’ relatives in all cases.
OFDI IMAGING PROTOCOL
The study protocol was identical to that of our previous study investigating the histopathologic diagnostic accuracy of OFDI for the identification of coronary calcification7. Within six hours after death, an autopsy was performed during which the coronary specimens were resected with the surrounding fatty tissue for ex vivo OFDI imaging in 0.9% saline at 37°C. The surrounding fatty tissue was carefully dissected from each coronary specimen. Thereafter, side branches were tied off to preserve the perfusion pressure of 60 to 80 mmHg. A 0.014-inch guidewire was introduced into the vessel followed by an OFDI catheter (Lunawave®; Terumo Corporation, Tokyo, Japan). OFDI images of the entire vessel were acquired at a pullback rate of 20 mm/s (160 frames/s). After OFDI examination, using a tapered surgical needle, multiple 6-0 proline sutures were carefully inserted into the plaque segment as a reference point for matching between the OFDI and histological images.
HISTOLOGICAL PREPARATION AND ASSESSMENT
After the OFDI examination, coronary arterial sections were fixed in 10% neutral buffered formalin for 48 hours. The ring-like arterial specimens obtained at the same level as the imaging study were decalcified for five hours, embedded in paraffin, and cut every 3 mm into 4 μm transverse sections perpendicular to the longitudinal axis of the artery. They were stained with haematoxylin and eosin, Elastica van Gieson, and Masson’s trichrome stain. Histological assessment of each cross-section was performed by a single experienced pathologist (R. Kawakami) who was blinded to the imaging results. Coronary plaques were classified using the modified American Heart Association (AHA) classification8. All histological cross-sections were classified as either “histologically lipidic/Mø infiltration” or “histologically non-lipidic/Mø infiltration”. According to the modified AHA classification, intimal xanthoma defined as lesions with macrophage infiltration into the fibrous intima, pathological intimal thickening defined as lesions with lipid pools without apparent necrosis, and thick-/thin-cap fibroatheromas defined as lesions containing necrotic core with thick or thin fibrous cap were considered “histologically lipidic/Mø infiltration”, because these types of plaque contain lipid components and macrophage accumulations. Comparatively, adaptive intimal thickening defined as lesions with predominantly fibrous tissue and no macrophage, lipid pool, fibrocalcific plaques defined as lesions with calcification and absence or fractions of necrotic core were considered “histologically non-lipidic/Mø infiltration”, because these types of plaque do not contain lipid components and macrophage accumulations.
MATCHING OF OFDI IMAGES WITH HISTOLOGY
All OFDI images were matched with histologic sections by an experienced investigator (H. Shibutani). Adjustments were made using the luminal configuration or anatomical landmarks such as vessel branches, thus improving the accuracy of registration. A total of 135 histological segments were excluded due to matching difficulty. In total, 1,019 pairs of matched images were acquired from OFDI with corresponding histological sections.
QUALITATIVE AND QUANTITATIVE OFDI ANALYSIS
OFDI images were analysed by two independent observers (K. Fujii and M. Otagaki) who were blinded to the histological diagnosis and the clinical information. The OFDI images of each cross-section were categorised into three types based on validated criteria for plaque characterisation9 - fibrous, lipid-rich, and calcified. Briefly, fibrous tissues appear as high-signal-intensity tissues, lipid-rich tissues appear as low-signal-intensity regions with diffuse borders, and calcified tissues appear as low-signal-intensity areas with sharply delineated borders. In cases where the plaque classification was inconsistent between two readers, a consensus was obtained through discussion and used as the final OFDI classification.
When the tissue was categorised as lipid-rich plaque on each OFDI cross-section, the incident angle and distance of the OFDI beam to the vessel wall were measured to investigate the influence of the OFDI catheter location on the occurrence of “non-lipidic/Mø infiltration”. The incident angle θ was calculated between the OFDI beam that strikes the edge of the luminal surface of the low-intensity region and that which strikes the surface line of the low-intensity region (Figure 1). The distance from the catheter to the vessel wall was calculated between the centre of the OFDI catheter and the intersection point of the luminal surface along the OFDI beam. These quantitative measurements were performed using the scientific image-analysis program, Image J software (National Institutes of Health, Rockville, MD, USA).
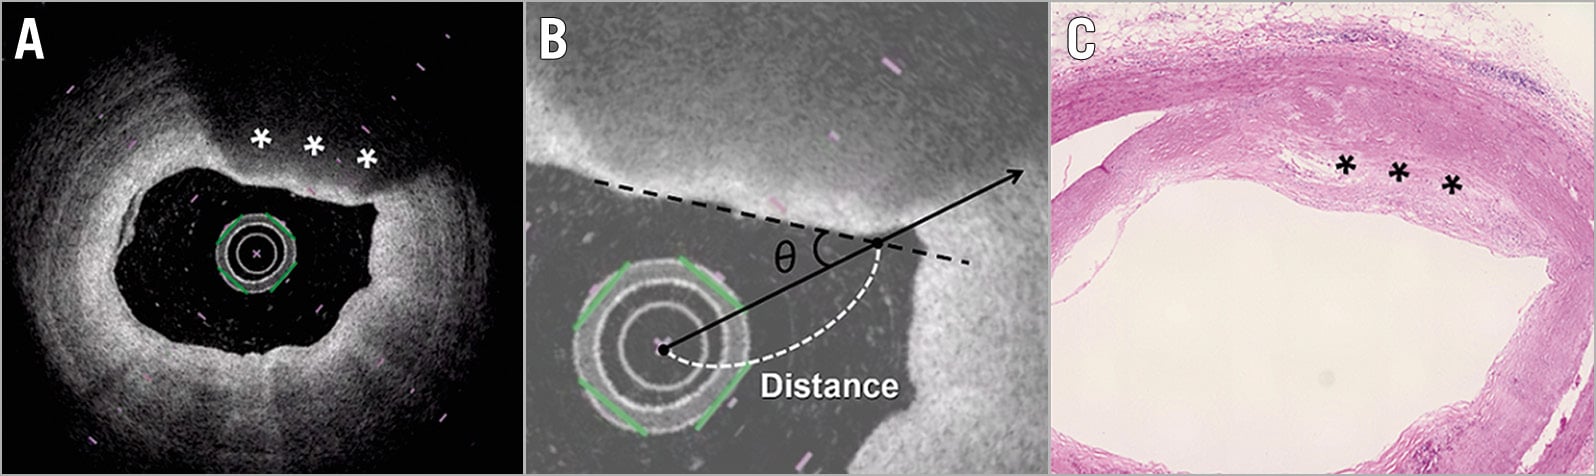
Figure 1. Quantitative measurement of the incident angle θ and distance from the catheter to vessel wall on OFDI. A) A low-signal-intensity region with a diffusely delineated border was present at 12–1 o’clock (asterisks). B) The angle θ was calculated between the OFDI beam that strikes the edge of the luminal surface of the low-intensity region (continuous line) and that which strikes the surface line of the low-intensity region (black dotted line). The distance from the catheter to the vessel wall was calculated between the centre of the OFDI catheter and the intersection point of the luminal surface along the OFDI beam (white dotted line). C) The matched histological section of the segment in panel A (haematoxylin and eosin staining) revealed a proteoglycan-rich matrix with areas of extracellular lipid accumulation without necrosis (pathological intimal thickening). OFDI: optical frequency domain imaging
STATISTICAL ANALYSIS
All continuous variables are presented as mean±standard deviation values, and categorical variables are presented as numbers and percentages. The Student’s t-test was used to compare continuous variables. To assess reproducibility of quantitative measurement, interobserver variability analysis was performed using the measurements conducted by two independent observers and was assessed by linear regression analysis. The area under the receiver operating characteristic (ROC) curve was estimated for the best cut-off angle θ and distance from the catheter to vessel wall for predicting misinterpretation of lipidic plaques and macrophage infiltration. All statistical analyses were performed using JMP statistical software for Windows, version 13.2.1 (SAS Institute Inc., Cary, NC, USA). A p-value <0.05 was considered statistically significant.
Results
QUALITATIVE OFDI AND HISTOLOGICAL ANALYSIS
Among 1,019 cross-sections, plaque morphology was classified according to established criteria as follows: 232 (23%) were categorised as lipid-rich plaque, 596 (58%) as fibrous plaque, and 191 (19%) as calcified plaque.
On histological evaluation of 232 OFDI-derived lipid-rich plaques, 50 (22%) were classified as adaptive intimal thickening, 98 (42%) as intimal xanthoma/pathological intimal thickening, and 84 (36%) as thick-/thin-cap fibroatheroma according to the modified AHA classification. Accordingly, histological cross-sections were classified into two groups - a histologically lipidic/Mø infiltration group (n=182) and a histologically non-lipidic/Mø infiltration group (n=50).
QUANTITATIVE OFDI ANALYSIS
The angle θ was significantly smaller in the non-lipidic/Mø infiltration group than in the lipidic/Mø infiltration group (12±6° versus 37±14°, p<0.001) (Figure 2A). Furthermore, the distance from the catheter to the vessel wall was significantly longer in the non-lipidic/Mø infiltration group than in the lipidic/Mø infiltration group (1.7±0.4 mm versus 1.3±0.4 mm, p<0.001) (Figure 2B). The interobserver variability analysis for the incident angle and the distance from the OFDI catheter to the vessel wall showed good agreement between the two observers (r=0.88, p<0.001 and r=0.95, p<0.001, respectively), reflecting excellent reproducibility. The ROC analysis for the best cut-off angle and distance for predicting misinterpretation of lipidic plaques and macrophage infiltration is shown in Figure 3A and Figure 3B. The optimal cut-off value of the incident angle was 23°, with an area under the curve (AUC) of 0.98 (sensitivity 100%, specificity 87%, positive predictive value 68%, negative predictive value 100%, diagnostic accuracy 93%) and that of the distance from the catheter to the vessel wall was 1.3 mm, with an AUC of 0.78 (sensitivity 86%, specificity 61%, positive predictive value 38%, negative predictive value 94%, diagnostic accuracy 66%). The cause underlying the false-positive diagnosis of the angle θ<23° for the histologically non-lipidic/Mø infiltration group was the positioning of the OFDI catheter on the vessel wall. When both the incident angle of <23° and the distance from the catheter to the vessel wall of >1.3 mm were required to be met, the positive predictive value for the histologically non-lipidic/Mø infiltration increased from 68% to 80% (Table 1). There was no false-negative diagnosis of the angle θ<23° for the histologically non-lipidic/Mø infiltration group in the current analysis. A representative case of TSD is shown in Figure 4.
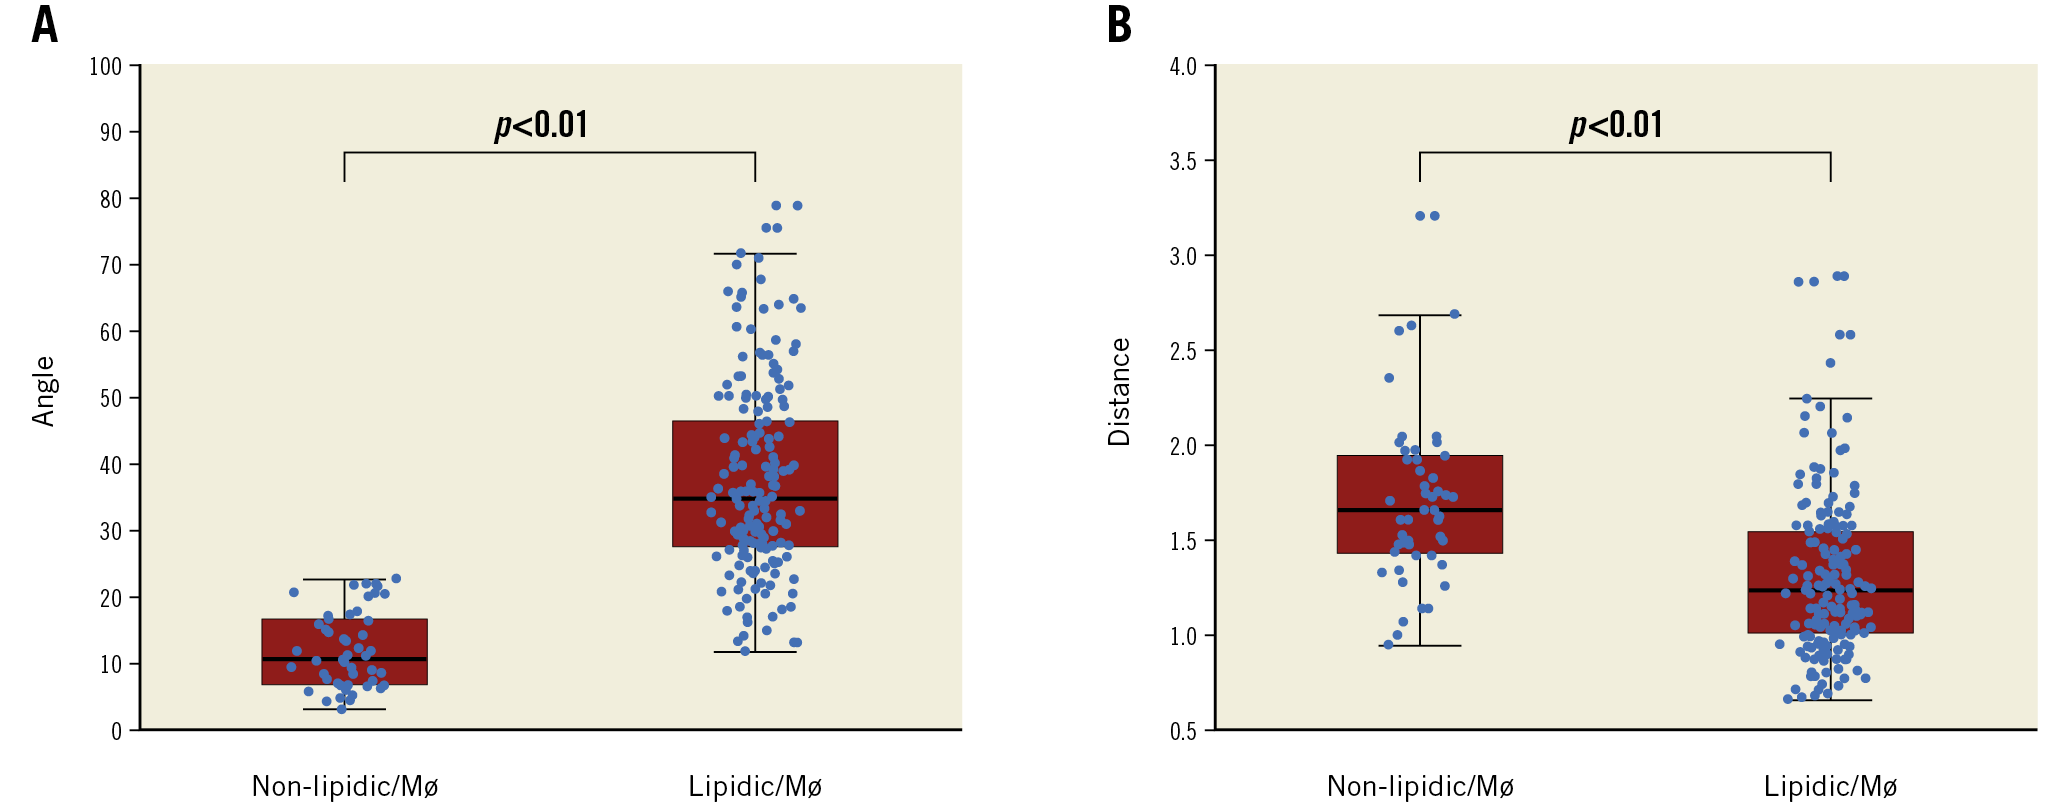
Figure 2. The difference in the angle θ and the distance from the catheter to the vessel wall between non-lipidic/Mø infiltration and lipidic/Mø infiltration groups. A) The angle θ in the non-lipidic/Mø infiltration group was significantly smaller than in the lipidic/Mø infiltration group (12±6° versus 37±14°, p<0.001). B) The distance from the catheter to the vessel wall was significantly longer in the non-lipidic/Mø infiltration group than in the lipidic/Mø infiltration group (1.7±0.4 mm versus 1.3±0.4 mm, p<0.001). Mø: macrophage
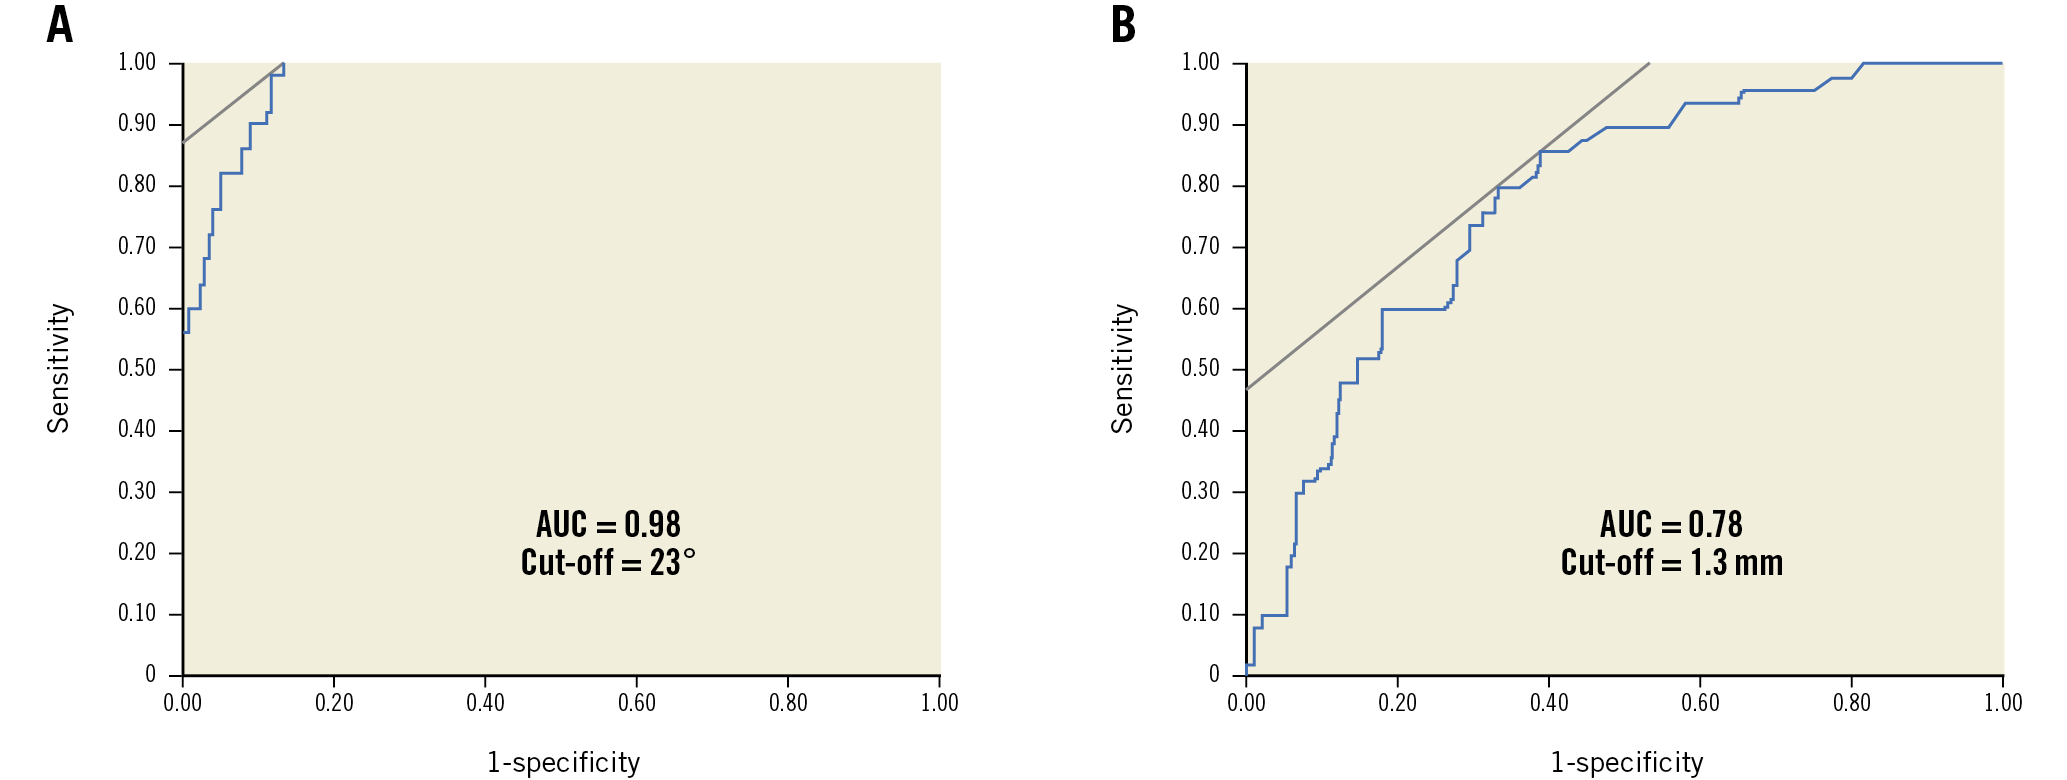
Figure 3. ROC analysis for predicting the occurrence of TSD. The optimal cut-off value for angle θ for the prediction of TSD was <23°, with an AUC of 0.98 (A), and that of the distance from catheter to vessel wall was >1.3 mm, with an AUC of 0.78 (B). AUC: area under the curve; ROC: receiver operating characteristic; TSD: tangential signal dropout
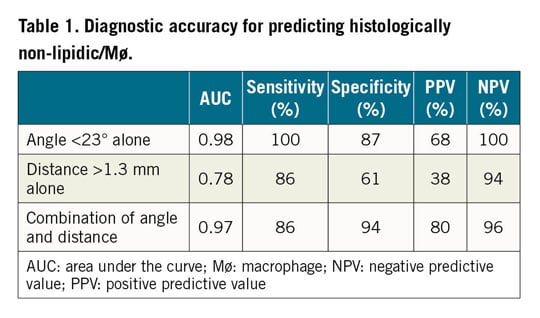
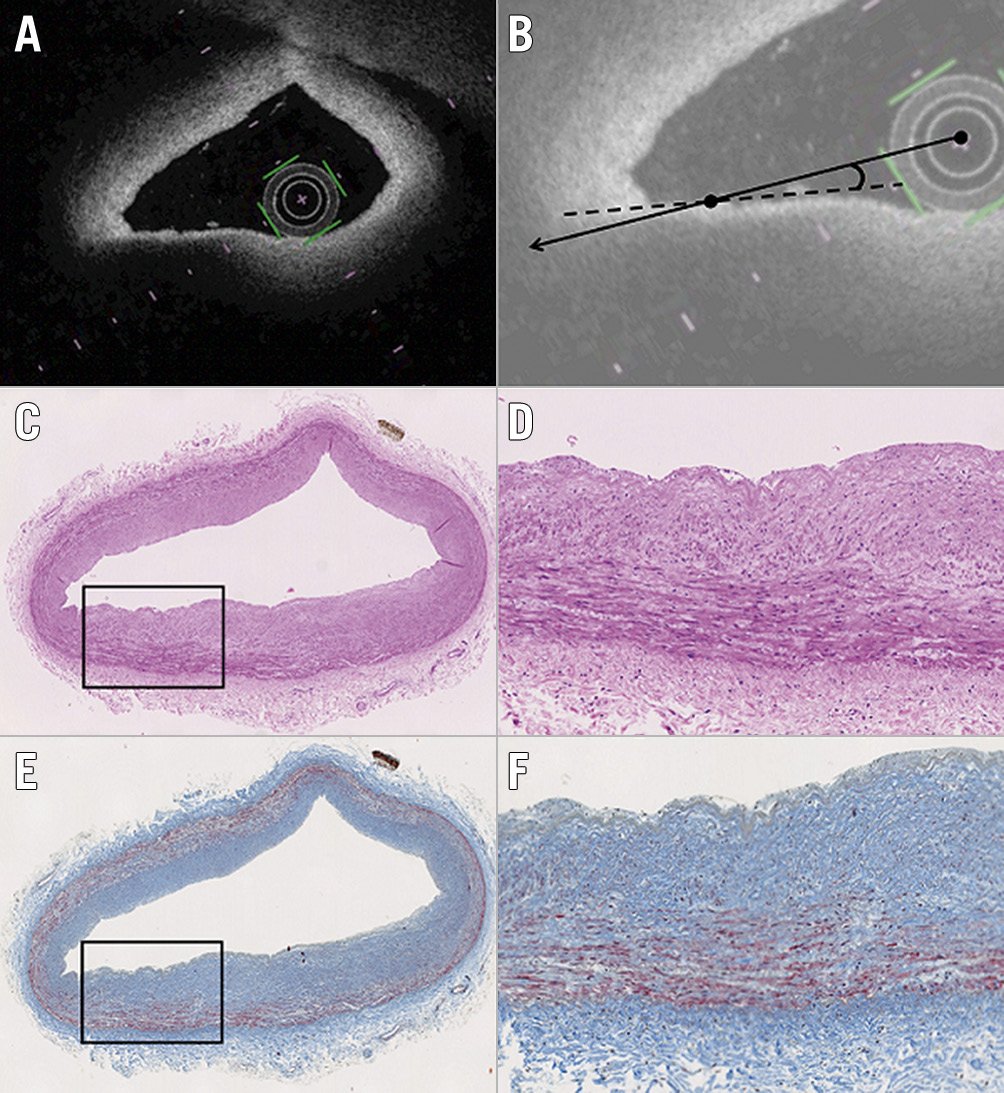
Figure 4. Representative images of TSD artefact. Although a signal-poor lesion with a diffuse border appears to be located at 7-8 o’clock on the OFDI image (A), the histological segment (haematoxylin and eosin, and Masson’s trichrome staining) (C & E) shows adaptive intimal thickening. B) The angle θ between the OFDI beam that strikes the edge of the luminal surface of the low-intensity region (continuous line) and that which strikes the surface line of the low-intensity region (dotted line) was 4°. D) & F) Magnified images of the boxed areas in panels C and E. OFDI: optical frequency domain imaging; TSD: tangential signal dropout
Discussion
The main findings of the present study were: (1) approximately 20% of the lipid-rich plaque on OFDI was TSD artefact; and (2) the optimal cut-off value of the incident angle for predicting TSD was 23° with high diagnostic accuracy. The additive value of distance from the OFDI catheter may improve the misinterpretation of lipidic/Mø infiltration.
OFDI characterises tissue morphology by measuring backscattered infrared light1,2. In atherosclerotic plaques, lipid-rich plaques appear as low-signal-intensity regions with diffuse borders because of multiple scattering in lipids at light wavelengths of approximately 1,000 nm3. In a previous report, Yabushita et al10 studied optical coherence tomography (OCT) images of 357 diseased atherosclerotic arterial segments obtained at autopsy and showed that the sensitivity and specificity of OCT were 90-94% and 90-92%, respectively, for lipid-rich plaques. This finding was later confirmed by Kume et al11, who reported a >90% sensitivity and specificity for detecting lipid-rich plaques by OCT in 166 sections from 40 human cadavers. However, previous ex vivo imaging studies showed that the positive predictive value of OFDI for characterising lipid-rich plaque was relatively low, even though the sensitivity and specificity were extremely high12. These results suggest that there were some tissues that had no sign of a lipidic component in the histology segments, which could result in a false diagnosis of lipid-rich plaques on OFDI. Previous studies reported that 15% of the segments were falsely diagnosed as lipid-rich plaques on OFDI5. Similarly to the previous study, our results demonstrated that 20% of the segments demonstrated a signal-poor region with a diffuse border on OFDI and did not contain lipidic tissue in the histological segments.
OFDI is analogous to ultrasound, except that it measures wavelength-swept laser as the light source and fixed mirror as a reference instead of acoustic waves. Axial scans (A-scans) measure the back-reflection or backscattering versus depth. The cross-sectional images of OFDI are generated by performing a series of A-scans at different transverse positions to generate a two-dimensional data set. Therefore, when the OFDI imaging beam strikes the vessel wall obliquely, the OFDI light signal from that area becomes weaker than when the imaging beam strikes the interface perpendicularly. This is one of the important causes of “pseudo-lipidic” plaque images that appear as low-signal-intensity regions with diffuse borders covered by a high-intensity fibrous cap. Although previous studies have shown that TSD could be an important potential imaging artefact leading to the erroneous diagnosis of lipid-rich plaques4,5,6, these studies did not reveal the quantitative assessment of the incident angle for TSD artefact. To our knowledge, this is the first report to measure the incident angle θ for predicting TSD artefact quantitatively. The best cut-off point of angle θ (defined as the angle between the OFDI beam that strikes the edge of the luminal surface of the low-intensity region and that which strikes the surface line of the low-intensity region) for predicting TSD artefact was 23° with a high sensitivity and specificity. Careful interpretation is required to identify lipid-rich plaques by OFDI, especially because the positioning of the OFDI catheter could cause the imaging beam to strike the vessel wall obliquely.
Because TSD resulted in signal loss and an apparent low-intensity region of the OFDI image, this artefact could lead to the misclassification of stable plaque as vulnerable plaque. Furthermore, the misclassification of plaque morphology in the catheterisation laboratory may cause the inappropriate selection of the treatment strategy, such as the use of an embolic protection device during percutaneous coronary intervention. Therefore, interventional cardiologists who are responsible for the interpretation and analysis of OFDI imaging should have knowledge of this potential artefact.
Limitation
The present study has several limitations. First, it was performed using a limited number of samples. The OFDI prevalence of TSD artefact was therefore low (50 cross-sections). Second, the OFDI images of coronary arteries were obtained after removing the guidewire, which may have led to a higher prevalence of TSD artefacts. Third, a lack of cardiac motion may influence the images taken ex vivo. Fourth, a positional discrepancy in the evaluated cross-sections among OFDI and histological images may have influenced the results, although care was taken to achieve optimal matching of OFDI images with histology. Fifth, a detailed analysis of OFDI and histological images was performed only when the tissue was categorised as lipid-rich plaque on each OFDI cross-section, because the main purpose of this study was to evaluate the incidence and the threshold angle for the appearance of TSD artefact on OFDI. Therefore, whether OFDI-defined fibrous and calcified plaques also contained intimal xanthoma and pathological intimal thickening is unclear. Sixth, it may be better to focus on thin-cap fibroatheroma instead of lipid-rich tissue. Due to the difficulty in the diagnosis of thin-cap fibroatheroma on OFDI, this study analysed lipid-rich tissues. Seventh, a lack of immunochemical staining to identify macrophages is an additional limitation.
Conclusions
When the OFDI imaging beam strikes the tissue at an angle θ<23°, TSD artefact, which is a signal-poor area with diffuse borders that appears as a lipid-rich plaque, could occur. To eliminate image misinterpretation, our findings suggest that the OFDI catheter geometry should be considered for the accurate diagnosis of lipid-rich plaques.
|
Impact on daily practice If the optical frequency domain imaging (OFDI) imaging beam strikes the tissue under a glancing angle (<23°), the artefact of tangential signal dropout (TSD), which mimics a lipid-rich vulnerable plaque, could occur. Because TSD resulted in signal loss and an apparent low-intensity region of the OFDI image, this artefact could lead to the misclassification of stable plaque as vulnerable plaque. The OFDI catheter geometry should be considered for the accurate diagnosis of lipid-rich plaques in order to eliminate image misinterpretation. |
Acknowledgements
The authors thank the staff of the Department of Surgical Pathology at Hyogo College of Medicine for their excellent assistance in the study.
Conflict of interest statement
The authors have no conflicts of interest to declare.
Supplementary data
To read the full content of this article, please download the PDF.