Abstract
Aim: To assess the reproducibility of quantitative analysis of optical frequency domain imaging (OFDI) acquired at different pullback speeds (20, 30, 40mm/sec), as well as the impact of cardiac motion artefact on three-dimensional (3D) reconstructions.
Methods and results: A total of 36 OFDI pullbacks were obtained pre- and post-stent implantation at the pullback speeds of 20, 30 and 40mm/sec in non-diseased swine coronary arteries. The amount of x-ray contrast needed for blood clearance during OFDI imaging was recorded. Three-dimensional images of stented segments were rendered and artefacts on 3D images were assessed. Lumen areas (LA) were measured on each individual frame in pre- and post-stent pullbacks. The volume of contrast used with a pullback speed of 40 mm/sec was significantly smaller than with those of 30 and 20 mm/sec (10.8±1.8, 12.9±1.6, 15.9±2.6 ml, p<0.01, respectively). Three-dimensional reconstruction was feasible in all pullbacks. Faster pullback speeds resulted in a smaller number of artefacts. For quantitative measurement, a total of 7,426 frames were analysed. In non-stented vessels, LA derived from corresponding selected frames increased significantly with increasing pullback speeds (6.35±2.14 vs. 6.58±2.10 mm2 for 20 vs. 30 mm/sec [p<0.001], 6.36±2.13 vs. 6.75±2.09 mm2 for 20 vs. 40 mm/sec [p<0.001]), whereas in stented vessels there was no significant difference in mean LA between the three different pullback speeds (6.75±1.30 vs. 6.78±1.36 mm2 for 20 vs. 30 mm/sec [NS], 6.74±1.30 vs. 6.76±1.31 mm2 for 20 vs. 40 mm/sec [NS]).
Conclusions: Quantitative analysis of OFDI obtained at different pullback speeds in non-stented coronary arteries could potentially vary in LA measurement. OFDI with high-speed pullback allows quantitative analysis of stented vessels while reducing the amount of contrast and cardiac motion artefacts.
Abbreviations
FD-OCT: Fourier-domain optical coherence tomography
LA: lumen area
OCT: optical coherence tomography
OFDI: optical frequency domain imaging
Introduction
Optical coherence tomography (OCT) has recently attracted a lot of attention as a novel intracoronary imaging tool compared to intravascular ultrasound (IVUS). The main advantage of OCT is its unparalleled image resolution, which is approximately 10 times higher than that of IVUS and is close to that of histopathology1-4. This high resolution makes it possible to study in great detail the blood-lumen interface and to study, for example, whether implanted coronary stents are covered by small amounts of tissue, a phenomenon that was previously difficult or even impossible to assess by IVUS alone5-8.
However, the wavelength used by OCT is fully absorbed by the circulating blood and to acquire an image of the coronary artery wall we have to clear the blood from the vessel, which can only be achieved by saline or x-ray contrast injection. The first generation OCT systems, e.g., time-domain OCT (M2 system; Lightlab Imaging, Westford, MA, USA), dealt with this problem by using a soft non-dilating occlusive balloon, flushing the artery, pulling back the imaging-wire automatically at a rate of 1 mm/sec and acquiring 15 frames/s. However, this acquisition procedure could possibly cause discomfort to the patient9,10. This problem was partially overcome by the 2nd generation OCT system, Fourier-domain OCT (FD-OCT) (C7XR FD-OCT Imaging System; LightLab Imaging, Westford, MA, USA). These FD-OCT systems are capable of acquiring images at a rate of 100 frames/sec allowing a pullback speed of up to a maximum of 25 mm/sec11. At these speeds, occlusion of the vessel is no longer necessary as the blood can be removed by a short-lasting injection of x-ray contrast medium. Recently, an improved version of this FD-OCT system has been introduced, which also uses the optical frequency domain imaging (OFDI) technique (Terumo Corp., Tokyo, Japan). This system is capable to acquire 160 frames/sec during the catheter pullback at a maximum speed of 40 mm/sec, reducing the necessary flush even more. Moreover, it has been reported that the three-dimensional (3D) reconstruction of this OFDI technique facilitates the understanding of coronary microstructure12,13.
However, the image quality and reproducibility of the quantitative assessment of this high-speed OCT image acquisition are unknown. The purpose of this study is to assess: 1) the reproducibility of quantitative analysis of these high-speed OCT images acquired at different pullback speeds in a non-diseased coronary swine model; and 2) the image quality by applying 3D reconstructions.
Methods
Animal preparation
Two female swine (weight: 51-53 kg) were anaesthetised with an intramuscular injection of ketamine (10 mg/kg) and inhaled sevoflurane (4% to 5%). After insertion of endotracheal tubes, isoflurane was reduced to 0.5% or 1%. The animals were allowed to breathe spontaneously using a mixture of oxygen and air administered through an ACE300 (ACOMA Medical Industry Co. Ltd, Tokyo, Japan) ventilator and were placed in a supine position and were monitored by 12-lead electrocardiography (ECG). The femoral artery was cannulated with an 8 Fr introducer sheath using a cut-down technique. Blood pressure was monitored continuously through the side port of the sheath. After systemic heparinisation (200 U/kg), the left coronary artery (LCA) was cannulated with a 6 Fr guiding catheter, and angiography was performed by manual injection of 8-10 ml of Ioxilan 350 (Imagenil™; Terumo Corp., Tokyo, Japan). After identification of the left anterior descending (LAD), circumflex (LCX) and right coronary artery (RCA), a 0.014’’ conventional guidewire was advanced sequentially into each artery. An 18 mm long biolimus-eluting stent (Terumo Corp., Tokyo, Japan) was implanted in the middle of each epicardial coronary artery.
The study was approved by the Institutional Animal Care and Use Committee and was conducted in accordance to the American Heart Association (AHA) guidelines for preclinical research and the Guide for the Care and Use of Laboratory Animals (National Institutes of Health, 1996).
OFDI system
The OFDI system uses a scanning laser as a light source with a centre wavelength of around 1.3 µm with sweeping range over 100 nm. In order to create the OCT images, the echo-time delay and the amplitude of light reflected from the tissue microstructure at different depths were determined by processing the interference between the tissue sample and a fixed reference mirror. The imaging depth was approximately 1.5 mm into tissue with an axial resolution of 15~20 µm and a lateral resolution of 25~30 µm. The OFDI catheter (2.4 Fr crossing profile) is a short monorail design and contains a fiber optic core rotating within a translucent sheath. The imaging catheter connects proximally to the imaging console permitting real-time data processing and a two-dimensional representation of the backscattered light in cross-sectional planes. The imaging elements rotate at a speed of 9600 rpm allowing imaging at 160 frames/sec with an automated pullback speed of maximally 40 mm/sec. The refractive index can be changed according to flushing material.
OFDI acquisition procedure
OFDI acquisition was performed before and after stenting in each epicardial coronary artery. The OFDI catheter was advanced into the vessel as distal as possible over a conventional guidewire. Image calibration was performed using the border of the catheter circumference (0.8 mm) on a stationary frame prior to pullback. OFDI pullbacks were performed during continuous injection of angiographic contrast medium (Ioxilan 350, Imagenil™; Terumo Corp., Tokyo, Japan) at 300 pounds/square inch with a rate of 3 ml/sec through the guiding catheter using a mechanical injector (120S; Nemoto kyorindo Co. Ltd., Tokyo, Japan). The pullback was started as soon as the lumen area became clearly visible and the contrast injection was manually stopped as soon as the imaging device reached the guiding catheter. The imaging procedure was repeated consecutively at pullback rates of 20 mm/sec (PBS20), 30 mm/sec (PBS30) and 40 mm/sec (PBS40) using a constant frame rate of 160 frames/sec. Each pullback was preceded by intracoronary administration of 0.2 mg of nitroglycerine. During the procedure, electrocardiographic and haemodynamic parameters were monitored.
The same imaging procedures were repeated after stenting. Total amounts of contrast per pullback were recorded. The images were saved on the OFDI system console. As expected, we noticed small changes (median 0.05 mm, range 0.03-0.05 mm) in diameter of the catheter during pullback. Image calibration was performed again using the border of the catheter circumference (0.8 mm) frame by frame and then converted into audio video interleave (AVI) files. The images were exported to a digital versatile disk for offline analysis.
Assessment of 3D image
Rendered three-dimensional reconstructions of the stented regions were created to assess visually the possible impact of the different pullback speeds on the image quality. The areas used to perform the 3D reconstructions started 5 mm distal of the stented segment and ended 5 mm proximal. A combination of individual cross-sectional images, as well as longitudinal reconstructions were used to guide this selection process. Stent struts were detected manually frame by frame. Data sets of stented segments were imported into a commercially available 3D volume-rendering programme (INTAGE Realia; KGT, Tokyo, Japan). After the 3D rendering, the OFDI catheter, guidewire and intra-luminal noise were removed manually. Clamshell views of the stented segments were saved into still images14,15. A qualitative assessment was performed by counting the number of misalignments in the stented segments on the 3D reconstructions. The types of misalignment were classified into elongation, repetition, rotation and/or their combination (Figure 1).
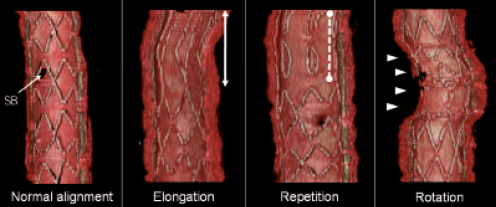
Figure 1. Type of motion artefact on three-dimensional image. SB: side branch; solid line indicates elongated strut; dotted line indicates repetition of same struts because of forward and backward motion of OFDI catheter; arrows indicate rotation due to twisting motion of coronary artery
Quantitative assessment of OFDI images
All OCT pullbacks were analysed offline using a customised and dedicated offline software for core laboratories (Medis medical imaging systems BV, Leiden, The Netherlands)16. Imaged vessel length was calculated from the number of frames between the first frame and the frame on which the guiding catheter became visible for the first time (Figure 2). To match pre-stent segments for quantitative analysis, side branches were used as landmarks using longitudinal reconstructions side by side.
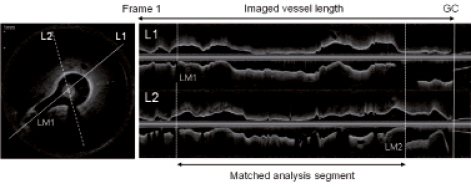
Figure 2. OFDI cross-sectional and longitudinal images. Imaged vessel length was defined as a segment between the first frame and the frame where guiding catheter (GC) was visible; in pre-stent OFDI pullbacks, analysis segments were matched between three different-speed pullbacks using distal and proximal landmark (LM)
The analysis software uses semi-automated longitudinal and transversal contour detection algorithms to detect the lumen-intima interface17. Every individual cross-section within the pullback was analysed. As Figure 3 shows, corresponding frames between different pullback speeds (PBS20 vs. PBS30, PBS20 vs. PBS40) were selected for comparison of lumen areas. The stented region was identified by the first and the last frame in which struts were visible over 360 degree vessel circumference6. The stent area was measured manually and the number of stent struts was counted at 1 mm intervals.
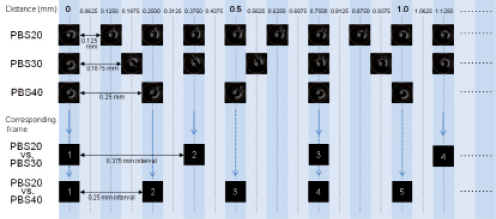
Figure 3. Frame intervals and corresponding frame. PBS20: 20 mm/sec pullback; PBS30: 30 mm/sec pullback; PBS40: 40 mm/sec pullback
To assess the reproducibility of measurements in OFDI images, analyses of 1,216 frames obtained at the pullback speed of 20 mm/sec in three pre-stented arteries were repeated by two independent observers. To determine intra-observer variability, the images were analysed again by the same two observers at least two weeks after the initial measurement, and these two measurement sessions were compared.
Statistics
Statistical analyses were performed using SPSS 16.0.1 for Windows (SPSS, Chicago, IL, USA). Quantitative data are expressed as mean±SD. One-way analysis of variance was performed to compare different pullback speeds. A paired t-test and linear regression analysis was performed to compare lumen area between corresponding frames. According to Bland-Altman, the agreement between two measurements were assessed by determining the mean±1.96 SD of the between measurement differences18. A p-value of <0.05 was considered statistically significant.
Results
A total of six stents were deployed in three main epicardial coronary arteries in each swine. OFDI pullbacks were performed at the speeds of 20, 30 and 40 mm/sec before and after stenting. A total of 36 OFDI pullbacks were obtained without any complications. There were statistically significant differences in image acquisition duration for non-stented segments between the three different pullback speeds (PBS20: 3.4±0.8 sec for 68.6±15.1 mm length; PBS30: 2.3±0.5 sec for 69.7±14.3 mm; and PBS40: 1.8±0.3 sec for 72.4±12.6 mm; p<0.001 for image acquisition time; without significant difference in imaged vessel length, respectively). Furthermore, the injected volume of contrast of PBS40 (10.8±1.8 ml) was significantly smaller than those of PBS30 (12.9±1.6 ml, p<0.05) and PBS20 (15.9±2.6 ml, p<0.01).
Assessment of 3D images
Three-dimensional reconstructions were feasible in all pullbacks, however, the process was time consuming (2-3 hours/pullback). Faster pullback speeds resulted in a smaller number of misalignments on 3D reconstructions (Table 1). Most of the encountered misalignments were found in the PBS20 pullbacks. The cardiac-induced motion of the imaging catheter and the coronary dynamics resulted in the appearance of repetition, rotation and misaligned stent struts (Table 1, Figure 1). A representative case was shown in Figure 4.

Figure 4. Three-dimensional reconstruction image of stent segment. A: longitudinal reconstruction; B: pullback (PB) speed 20 mm/sec; C: 30 mm/sec; D: 40 mm/sec; Pro: proximal; Dist: distal; #: out of alignment; two out of alignment stent struts were seen in the 3D image of PBS 20, however, there was one out of alignment stent strut in PBS 30 and PBS 40; the 3D images of stents were rendered grainy as the pullback speed increases
Pre-stent
Haemodynamic and quantitative pre-stent analysis are summarised in Table 2. There were no significant differences in mean heart rate and mean arterial pressure during OFDI acquisition between the three groups. Matched analysis lengths were not significantly different between the three groups. A total of 5,576 individual cross-sectional images were quantified for lumen area. Mean lumen area derived by all frames increased significantly with increasing pullback speed.
In order to compare lumen area frame by frame, 845 corresponding frames (0.375 mm interval) between PBS20 and PBS30, and 1,272 corresponding frames (0.25 mm interval) between PBS20 and PBS40 were selected (Figure 2). Linear regression analysis showed high correlation between measurements (R2=0.91 for PBS20 vs. PBS30; R2=0.92 for PBS20 vs. PBS40). Absolute and relative differences between corresponding frames were: 0.22±0.63 mm2 and 4.7±11.1 % for PBS20 vs. PBS30 (p<0.001); and 0.39±0.62 mm2 and 7.9±12.1 % for PBS20 vs. PBS40 (p<0.001). Bland-Altman plots for lumen area are shown in Figure 5.
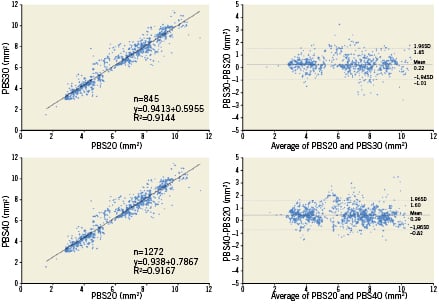
Figure 5. Correlations and Bland-Altman plot for lumen area of pre-stent. PBS20: 20 mm/sec pullback; PBS30: 30 mm/sec pullback; PBS40: 40 mm/sec pullback
Post-stent
Haemodynamic and quantitative analysis post-stent are summarised in Table 3. There were no significant differences in mean heart rate and mean arterial pressure during OFDI acquisition between the three groups. Stent lengths were not significantly different between the three groups. A total of 1,850 frames in 18 pullbacks (n=6, each group) were quantified for lumen area. There were no significant differences in mean lumen area derived by all frames between the three groups (p=0.668).
In order to compare lumen area at the frame level, 278 corresponding frames between PBS20 and PBS30, and 410 corresponding frames between PBS20 and PBS40 were selected (Figure 2). Linear regression analysis showed a high correlation between measurements (R2=0.97 for PBS20 vs. PBS30; R2=0.96 for PBS20 vs. PBS40). Absolute differences and relative differences between corresponding frames were: 0.02±0.25 mm2 and 0.3±3.7% for PBS20 vs. PBS30 (p=0.108); and 0.02±0.27 mm2 and 0.4±4.1% for PBS20 vs. PBS40 (p=0.151). Bland-Altman plots for lumen area are shown in Figure 6.
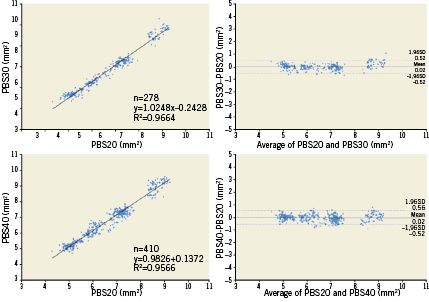
Figure 6. Correlations and Bland-Altman plot for lumen area of post-stent. PBS20: 20 mm/sec pullback; PBS30: 30 mm/sec pullback; PBS40: 40 mm/sec pullback
The inter- and intra-observer correlation coefficients for lumen area measurements of 1,246 frames obtained at the same pullback speed in the non-stented coronary artery were 1.00 and 1.00, respectively.
Discussion
This study shows that: 1) high-speed OFDI can be used to create 3D reconstructions of implanted stent structures with excellent quality and at resolutions much higher than what is currently possible using IVUS14; and 2) more importantly, quantitative analyses of OFDI studies in stented coronary arteries in our porcine model show no significant differences when comparing studies acquired at different pullback speeds. However, these quantitative variations are considerably increased in non-stented segments (relative lumen area increases up to 8% at the highest pullback speed).
Furthermore, this study shows that high-speed OFDI imaging could be performed with a significant reduction in the amount of contrast needed to clear the blood from the vessel before imaging starts. This could have large advantages for clinical application.
3D reconstructions
Three-dimensional reconstructions offer a comprehensive overview of the imaged region of interest (e.g., in this case, a stented segment), which cannot be swiftly reconstructed by interpreting a stack of two-dimensional individual cross-sections only. Viewing these 3D reconstructions could potentially offer a comprehensive overview of the entire stented region in one glance. Furthermore, the 3D reconstructions provide a much better visual understanding overview of the geometric distribution of the stent struts located in front of the side branches (Figure 1). Although 3D reconstructions of stented segments have been previously documented using IVUS14, the higher image resolution of OCT, and OFDI in particular, show clear advantages as far as reconstruction of 3D images is concerned. The stent struts are visualised with much higher resolution and the 3D reconstruction almost lacks any cardiac motion artefacts. However, the different high-speed pullbacks do have their impact on the reconstruction quality as can be appreciated by the fact that the relatively slower pullbacks offer a more continuous (less grainy) reconstruction (Figure 4). In fact the 20 mm/sec pullback acquires images at 0.125 mm intervals, which translates into a higher quality 3D reconstruction.
Quantitative analysis
The present study has demonstrated that mean luminal area grows with increasing speeds of pullback in non-stented regions of interest, while mean lumen area in stented segments are not affected by pullback speed. The differences between stented and non-stented segment are the following: 1) lumen area in stented segments is not influenced by systolic/diastolic coronary flow pattern; 2) stented segments are relatively shorter (18mm) and are a uniform sized segment.
Theoretically, at a high sampling frame rate(smaller space intervals between frames) acquired at low pullback speed, quantitative measurements should be more precise and accurate. According to this assumption, quantitative measurements should be based on all the frames available. However, in terms of comparability, it is incorrect to compare uneven numbers of frames. The Bland-Altman approach is the most appropriate statistical approach where a systematic error has to be distinguished from a random error between two measurements. This approach requires an equal number of comparative data points, and therefore in our analysis, preference was given to analysis of selected corresponding frames. With this method, a significant increase in lumen area was found in non-stented segments. Mean difference and standard deviation are larger in the pre-stent analysis than in the post-stent analysis. Obviously, pre-stenting analysis comprises a much larger range of values obtained on longer pullbacks than the post-stent acquisition which is limited to 18mm with a variation of luminal area between 5-6 mm2 (Figure 7).
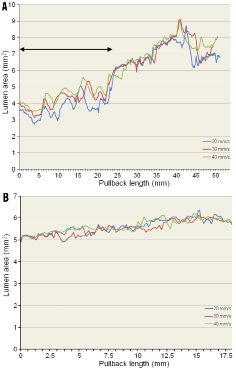
Figure 7. Profile curve of lumen area. A) pre-stent. Large variations in lumen area for the three different pullback speeds in the first 25 mm of the pullback length (line with arrows). Considering Murray’s law, these non-diseased vessels gradually increase their diameters or lumen areas at the site of branching. Up and down fluctuation of lumen area is partly explained by the to and fro motion of the surrounding vascular structure, in the early ejection phase, of the coronary (distal) tree of which the speed of motion (~0.5-1.0 mm/sec) exceeds by far the speed of the fastest pullback of the imaging device; B) post-stent. Small variations in lumen area for the three different pullback speeds in the 18 mm stented segment with a lumen area of between 5-6 mm2
There is no clear and definitive explanation for the larger values of luminal area obtained at high-speed pullback, although numerous confounding factors should be considered:
1) The frame rate with the Terumo OFDI is 160 frames/sec, which means that at a pullback speed of 20 mm/sec and 40 mm/sec, the rate of frame per mm is eight and four, respectively. A 50 mm pullback with a speed of 20 and 40 mm/sec will thus generate 400 and 200 frames, respectively. In the pre-stent acquisition, the luminal area varied from a minimum of 2.8 mm2 to a maximum of 8.3 mm2 over a distance of 50 mm in pullback (Figure 7A). Therefore in a 20 mm/sec pullback, maximum change in luminal area is 5.5 mm2, with a mean per frame variation value of 0.014 mm2, while in 40 mm/sec pullback the mean change is 0.028 mm2 (difference 0.014 mm2). In contrast, the average changes of lumen area per frame in 18 mm-length stented segments having a minimum of 4.7 mm2 and a maximum of 5.7 mm2 (Figure 7B) are 0.007 mm2/frame for 20 mm/sec, 0.014 mm2/frame for 40 mm/sec (differences are smaller than those obtained in pre-stent segment). Figure 7 exemplifies the potential source of difference in lumen dimension in stented and non-stented segments imaged at various speeds of pullback.
2) Nitrate was administered prior to every pullback injection, and the cumulative vasodilatory effect of nitrate increasing the cross-sectional area cannot be excluded in these consecutive (20, 30 and 40 mm/sec) and not at random pullback acquisitions. This explanation will hold only for the non-stented vessel.
3) The capacitance of these juvenile and non-atherosclerotic epicardial vessels may affect the dimension of the vessel in systole and diastole. Therefore the precise systolic or diastolic phase of the cardiac cycle as well as the number of heart cycle observed during the pullbacks may impact on the measurement. Stationary acquisition during an entire cardiac cycle reveals systolic expansion and diastolic recoil whereas pullback on a pressurised but non-beating heart would, as expected, document the physiological tapering of the vessel according to Murray’s law. Therefore, the fact that the start of the pullback was randomly triggered during the cardiac cycle is an additional confounding factor in the interpretation of the result. It is noteworthy that the stented segments with luminal area ranging from 5 to 6 mm2 do not exhibit the larger fluctuations seen in the distal non-stented vessels ranging from 3 to 5 mm2 (Figure 7A).
4) The number of cardiac cycles depends on the speed of the pullback. Our 3D assessments suggest that the OFDI catheter moves backward and forward relative to the arterial wall during pullbacks at 20, 30 and 40 mm/sec. This phenomenon generates motion artefacts such as elongation, repetition and/or rotation, which could directly affect not only quantitative measurements but also the matching of corresponding frames. These effects may be more evident for luminal areas inferior to 5 mm2 (Figure 7A) and can be minimised in-stent as demonstrated by the low values of the mean difference (0.07 and 0.01 mm2) and bias (0.17 and 0.17 mm2).
Frame-rate, vasomotion, vessel capacitance and cardiac motion could potentially affect quantitative measurements mainly of the pre-stent vessel. Further studies would be needed to substantiate our hypothesis. Therefore it is recommended that the same pullback speed is used within serial OFDI studies. Moreover, importantly, the variability in the measurements might influence the decision of how to treat a lesion. However, the impact of pullback speed on the luminal measurement for a diseased segment is unknown. Even for stent evaluation, the difference could be acceptable in clinical practice.
Current practice of OCT and the use of contrast agents
This study demonstrated that faster pullbacks permit the reduction of the amount of contrast agents needed for OFDI acquisition. Since blood vessel clearance during acquisition is cumbersome and can induce myocardial ischaemia, the FD-OCT has been developed to circumvent these problems. Current use of this FD-OCT system needs approximately 14 ml contrast agents for 5 cm image acquisition (2.8 ml/cm19). As a relationship between pullback length and contrast volume exists, contrast volume in PBS20 and PBS40 were 16 ml for 6.8 cm pullback length (2.3 ml/cm) and 11 ml for 7.2 cm (1.5 ml/cm), respectively. Fast pullbacks will be useful for reducing total contrast volume in three-vessel plaque evaluation20 and will allow repetitive scans during interventional procedure (e.g., pre- and post-stent). However, the contrast volume of PBS40 is not equal to half of PBS20. This is probably due to the dead space of the guiding catheter and the time lag of manual stop for injection. Theoretically, the faster the pullback speed, the lower the amount of contrast media needed: 10.2 ml (3 ml/sec×3.4 sec acquisition time) in 20 mm/sec, 6.9 ml (3 ml/sec×2.3 sec) in 30 mm/sec, and 5.4 ml (3 ml/sec×1.8 sec) in 40 mm/sec. Automatic injection of the contrast triggered and synchronised with ECG might be helpful for solving this challenge.
Limitations
We selected the corresponding frames based on the frame intervals from the landmark for comparison of lumen areas. However, an exact matching of frames that correspond to the same location in the vessel is difficult due to cardiac motion. This could partly explain the variability in lumen measurements between the different pullback speeds.
The sample size was limited in this study and the sequence of image acquisition using different pullback speeds was not performed at random but in the same order with the possibility of cumulative effects of consecutive injections of nitrate. In future investigations, the start of pullback should be triggered by some specific phase of the QRS complex so that similar lengths of vessel during similar cardiac phases can be compared at different pullback speeds. Moreover, reproducibility of 3D reconstruction have not been evaluated. At present, manual operations are needed for 3D reconstruction of OCT pullbacks and this process is quite cumbersome and laborious. Automatic stent strut detection and dedicated software packages for 3D assessment may become available online in the near future.
Conclusion
High-speed pullbacks with high frame rate OFDI reduce the amount of contrast needed for OCT acquisition and could be applied for high-quality 3D reconstructions and accurate quantitative analysis. However, since quantitative analysis of acquisitions made at different pullback speeds in non-stented coronary arteries may differ significantly, it is recommended to use the same pullback speed in longitudinal studies.
Conflict of interest statement
The authors have no conflict of interest to declare.
