Abstract
Aims: Images acquired of coronary vessels during a pullback of time-domain optical coherence tomography (OCT) are influenced by the dynamics of the heart. This study explores the feasibility of applying an in-house developed retrospective image-based gating method for OCT and the influence of catheter dislocation and luminal changes during the cardiac cycle on the outcome of quantitative OCT (QOCT).
Methods and results: The gating method was developed using Matlab (The Mathworks, Natick, MA, USA) and operates in a fully-automatic manner. OCT image data of 20 randomly selected patients, acquired with a commercially available system (Lightlab Imaging, Westford, MA, USA), were pulled from our OCT database for development and validation. Twelve of the 20 datasets could be gated; the other eight pullbacks could not be gated due to a lack of motion induced artefacts. Computations required approximately 30 minutes/dataset. Quantitative comparisons between the gated and the non-gated QOCT results showed significant differences for mean areas and volumes (p <0.001) and mean relative differences of –11% (range –2 up to -20%) for lumen areas (gated) and –13% (range –5 up to –24%) for volumes.
Conclusions: Retrospective image-based time-domain OCT gating in the presence of motion induced artefacts is feasible. Significant changes in coronary lumen dimensions during the cardiac cycle were observed by OCT and in consequence, quantitative gated OCT analysis showed significant differences compared to non-gated QOCT analyses.
Introduction
Recently, optical coherence tomography (OCT) has been introduced into the catheterisation laboratory to provide the interventional cardiologist with high resolution images of the coronary vessel wall morphology1. This intracoronary imaging technique has rapidly claimed its place along side the established standard for intracoronary imaging, intracoronary ultrasound (ICUS)2. OCT, generating images at a resolution ten times higher than ICUS, is an excellent tool to study stent coverage or other tiny structures in the blood-intima interface area3. These capabilities are driving the increasing use of OCT in clinical studies evaluating new interventional therapies and new stent designs, such as the recently introduced bioabsorbable stents4.
Computer-assisted quantitative tools are highly recommended in research studies and recently semi-automated5 and even fully-automated contour detection tools have been presented6 for quantitative OCT (QOCT) analysis. Reconstructed longitudinal views (L-views) of the coronary play a key role in improvement of the quantitative analysis process7,8. Delineation of the lumen and the vessel contours in the longitudinal view offers considerably gain in analysis time as compared to contour tracing in each individual cross-section. However, with the first generation, time-domain OCT systems, these L-views show typical saw-tooth shape appearance probably caused by the relatively slow pullback speed (1-3 mm/s) in combination with the cardiac dynamics and catheter displacement during the pullback as has been described in great detail for ICUS9. These artefacts hamper L-view contour tracing and necessitate a time-consuming analysis process on every individual cross-section5. While these effects have been investigated systematically for
ICUS10-12, there is lack of data on the magnitude of these motion induced artefacts and on their impact on quantitative outcome measures for time-domain OCT. For example, what is the variability introduced by measurements made on a stack of images acquired during different phases of the cardiac cycle and at locations within the coronary artery which are different than expected due to an unknown catheter displacement during the cardiac cycle?
This paper explores the possibilities to 1) study the impact of motion-induced artefacts on QOCT analyses and 2) to develop a retrospective image-based gating algorithm for non-gated acquired coronary OCT data.
Methods and materials
Patients
We randomly selected 20 OCT cases from our database of patients participating in different studies. In all patients a standard femoral approach with 6 Fr guiding catheters was used. Before OCT imaging, weight-adjusted heparin was administered intravenously to maintain an activated clotting time of >300 sec as well as intravenous analgesics. The images were digitally stored in the AVI file format on DVD’s and were translated later into the DICOM medical imaging standard by in-house developed software.
OCT imaging procedure
OCT imaging was performed with a commercially available time-domain system (Lightlab Imaging, Westford, MA, USA) as described previously13. In brief, it operated with a 1,310-nm broadband light-source. The OCT imaging-wire had a maximum outer diameter of 0.019 inch (Imagewire™, LightLab Imaging) and consisted of a single-mode fibre optic core within a translucent sheath. Coronary imaging was performed during automated pullback (1 mm/s). applying proximal balloon occlusion (Helios) and distal flush delivery (lactated Ringers 0.8 ml/s). This allowed penetrating the coronary vessel wall approximately 1.5 mm axially and laterally it provides a resolution of 15 and 25 μm, respectively. After the imaging procedure, the images were digitally stored and transferred to perform further quantitative analysis.
Quantitative OCT analysis and gating
For the gating algorithm, information derived from the lumen contours is necessary and those were found by applying a fully-automated contour detection algorithm, which has been described previously6. The gating algorithm identifies images acquired in the near end-diastolic phase. The following assumptions and features (e.g., information) were used in the computer algorithm for identification:
– During end-diastole, the lumen areas are smallest, due to the relative low blood pressure14.
– The catheter moves from distal to proximal during systole and moves back distally during diastole, reaching its original distal position at end-diastole12. Thus the centroid of a detected lumen contour could be used to detect the original position within the coronary vessel of the catheter (e.g., the two contours must be similar or will most likely be close look-a-likes).
– As above-described, images acquired in the near end-diastolic phase are more equal to each other than images acquired during other phases of the cardiac cycle. This should result, if these images are stacked together, into a more or less smooth appearance of the coronary vessel in a longitudinal reconstruction (e.g., an L-view without saw-tooth shaped artefacts)11.
– During a continuous acquisition the images are showing a repetitive motion induced by the cardiac dynamics. Using image analysis, from these repetitive motions, the beats per minute can be estimated12.
For every feature signal a feature value is calculated, which later is used to compare all possible different selections of images and to estimate in which selection the most near end-diastolic images can be found. As the OCT datasets contains hundreds of individual cross-sectional images it makes this selection/gating process a discrete high-dimensional problem. Therefore, we implemented the gating method in a genetic algorithm.
Validation
The results of the gated QOCT analysis (all frames in the pullback are analysed) were compared against the current standard method consisting in the analysis of an n-number of individual cross-sectional images selected at fixed time intervals assuming constant pullback without catheter displacement artefacts5,15.
In addition we used the quantitative results of previous observer-defined and analysed regions of interest (ROI’s) within these total pullbacks, performed with the above-described method for comparison against gating. As the patient selection for this study incorporated patients participating in several different clinical studies, the ROI selection by the observers was based on identification of an implanted stent structure or by using anatomical landmarks such as side-branches or calcium deposits. For the comparison between the methods, the observer defined frame numbers in the non-gated analysis identified the frames within the gated analysis.
Statistical analysis
Quantitative data are presented as mean±standard deviation (SD). Comparison between methods was performed by the two-tailed paired Student’s t-test. A p-value <0.05 was considered statistically significant. In addition regression analysis and the method as proposed by Bland and Altman16 was performed.
Results
From the 20 datasets, 12 could be retrospectively gated. The computational time required on average 30 minutes per dataset. The eight datasets which could not be gated showed a limited amount of the typical saw-tooth appearance of the coronary lumen (e.g., not enough motion-induced artefacts). The other OCT datasets, which could be gated, were analysed for their total length and for the observer determined ROI’s (Figure 1). The average length of the total OCT pullbacks was 32.4±6.7 mm (range 25-95 mm) and for the ROI’s 13.9±3.8 (range 10-26 mm). The average frame rate was 19.4±15 frames/s and the average cardiac rate, estimated from the image data, was 72±16 beats per minute.
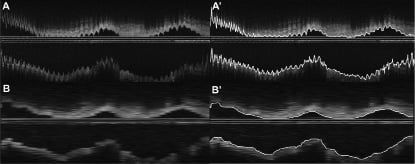
Figure 1. Panel A, shows a reconstructed longitudinal view (L-view) of an intracoronary optical coherence tomography (OCT) study. The lumen is presented with a saw-tooth shaped appearance, typical for non-gated acquisitions. In panel A’, the results of the quantitative analysis with the longitudinal lumen contours as an overlay is presented. Panel B, shows the result of the L-view after gating. The lumen is much “smoother” as is actually expected from coronary arteries. This more realistic appearance also simplifies the quantitative process as is illustrated in panel B’ where the quantitative contour detection can be appreciated. That the coronary in panel A looks much more “sharper” than in panel B is due to the fact that there are much more images/mm artery present in non-gated data, while due to the gating dataset B has much lesser images and is artificially stretched to match the same physical length as panel A.
Both area and volumetric measurements showed statistical significant differences between the gated and the non-gated analyses in all possible comparisons (Table 1). Gating results in significant smaller lumen areas showing a relative difference of –13% for the mean areas (Figure 2) for the total pullback length (range –3 up to –24%) and –9% for the ROI’s (range –5 up to –15%). Consequently also the volumes showed similar differences, –13% for the mean total volume (range –5 up to –24%) and for the ROI’s –12% (range –4 up to –15%) (Table 1).
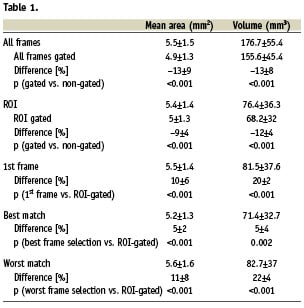
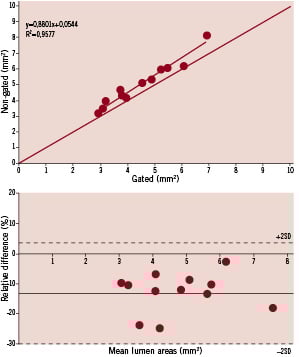
Figure 2. The top panel shows the regression analysis and the bottom panel the analysis according to the method as proposed by Bland and Altman. Both graphs shows that the gated mean lumen areas are much smaller than non-gated analyses.
Comparisons between the standard method, varying the start frame by starting with the 1st and ending with frame 20, against the gated result were performed. Using this approach the quantitative results closest to the gated outcome (called best match) showed a significant difference (p<0.001) with a relative difference of 5% for both mean areas and volumes. The worst match selection showed a relative difference of 11% for mean areas and 22% for volumes (p<0.001) (Table 1). To illustrate the quantitative effects of this manual observer frame selection into more detail, an individual case is presented (Figure 3). In this dataset the mean areas of all frames shows as a result 4.7±2 mm2, the non-gated analysis 4.7±2.4 mm2 and the gated analysis 3.7±1.9 mm2. However, these results, and more in particular the standard deviation, are heavily influenced by the large change in lumen dimensions halfway during the pullback; a subsegment analysis shows the differences between the methods more effectively. In the distal subsegment of frames between 0 and 150 the mean areas of all frames is 3.7±0.7 mm2, the non-gated analysis 3.4±1.1 mm2 and the gated analysis 2.6±0.6 mm2 and thus the gated analysis has a standard deviation almost half of that of the non-gated analysis.
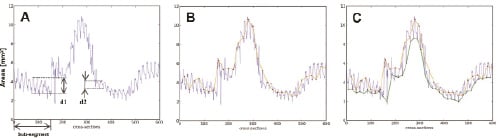
Figure 3. Panel A, shows all area measurements of one case. The length of the investigated segment was 30 mm and the frame rate 20 frames/s. Frame 0 (left hand-side) represents the distal part of the segment where the pullback started and frame 600 the proximal end of the pullback. Panel B, shows one possible manual analysis with images selected every 1 second (or every 20th frame) by the red-dots connected by the orange line. Panel C, shows both the manual analysis and the result of the gated analysis. The bottom (green line) connects the gated selected frames. This panel illustrates that the measured areas between the two methods is largely different. In addition, in panel A it can also be appreciated that there are large cyclic local changes in lumen dimensions at various parts of the coronary vessel. For example, at region d1 the relative change during the cardiac cycle of the lumen dimensions is 38% (change 2.8 to 4.5 mm2) while more proximal the change is only 5% (change from 3.7 to 4 mm2).
Discussion
This study shows that retrospective image-based gating for time-domain OCT coronary image data is feasible for cases where there are enough motion induced artefacts (60% in this study). Furthermore, this study also shows that there are significant different quantitative outcomes between gated and non-gated QOCT analyses, which is in line with previous reports based on QCU11. This should be taken into account if time-domain QOCT derived parameters are considered to be applied as surrogate endpoints in studies evaluating new therapies4.
ECG-gating and image-based retrospective gating methods for ICUS and its advantages for QCU analysis have been presented previously12,17. Although the acquisition of OCT is in many ways analogous to ICUS, these methods are unfortunately not applicable for OCT-gating10,12. Hardware-based ECG-gated acquisition18 cannot be applied since it prolongs the pullback procedure considerably, which is not acceptable if the vessel is closed, as is necessary for the first generation OCT. Although we tried it, the ICUS image-based retrospective gating method12 did not work. This is due to the limited penetration depth of OCT showing a limited part of the coronary vessel wall only (the first 1-2 mm). However, due to the much better visualisation of the lumen-intima interface by OCT, fully-automated contour detection is, in contrast to ICUS, possible, which facilitated the possibility to use those to develop an image-based gating method for OCT.
This study is the first to report on a possible OCT retrospective image-based gating method for time-domain OCT (first generation). However, the success rate to be able to gate OCT datasets is much lower than that of the ICUS methods. This is caused by 1) the relatively fast pullback of OCT as compared to ICUS (OCT 1-3 mm/s and ICUS 0.5 mm/s) and 2) the lower frame rates of the first generation OCT systems (5-20 frames/s, where ICUS has frame rates of 25-30 frames/s). This results in much less samples per mm/artery and also in fewer images per cardiac cycle, making the chances smaller of acquiring images in the near end-diastolic phase.
Despite this lower success rate, the quantitative differences between gated and non-gated QOCT are significant and are in line of those reported for gated QCU (e.g., significant smaller lumen areas and volumes for gated data, which is expected as it is acquired at end-diastole when the luminal dimensions are smallest and the catheter is at its most distal point)11,14. It has been suggested that perhaps manual gating would be possible by using the L-views and selecting the peak and the valley frames as surrogate identifiers that these frames are acquired in the near end-diastolic phase. However, this will not result in a similar result as the gating solution as proposed in this paper (Figure 4).
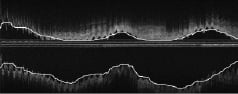
Figure 4. This figure shows the longitudinal reconstruction (L-view) of a non-gated optical coherence tomography (OCT) dataset with as an overlay the gated contour result. As can be appreciated, manual selection of cross-sections in peak- and/or valleys would not have resulted in a selection of frames acquired during end-diastole. This implies that 1) manual gating is not possible and 2) using non-gated L-views for quantitative analysis is useless.
In many trials, where intracoronary imaging methods are applied, one of the most used parameters of quantification outcome is the mean area (lumen-, vessel- and/or the plaque area) of the investigated segment and their changes over time19,20, despite the fact that mean area measurements are inferior compared to volumetric measurements. This study shows that the lumen area changes considerably during the cardiac cycle. As the possible changes to these dimensions induced by new therapies evaluated in longitudinal trials are most likely small, gating could increase the sensitivity of the OCT measurements.
Newer generation OCT systems are being developed, called frequency-domain OCT (abbreviated as OFDI) or also called the second generation, of which some are in the evaluation phase to be applied for clinical research21. These systems are pulling back the catheter at high speeds (≥20 mm/s), without the necessity to close the vessel for imaging and the coronary is imaged in a few seconds. This minimises motion-induced artefacts and results in a smoother appearance of the coronary vessel in reconstructed L-views. However, within these few seconds there are several heartbeats. What the effects are of the combination of a fast pullback and 3-5 cardiac cycles with, as presented in this study, possible considerable lumen dimensional changes during the pullback for the quantitative analysis needs to be further investigated.
Limitations
There is unfortunately no golden standard that can be used to validate this gating method. Despite this, the proposed retrospective gating method is preferable to the current standard method of manual observer-selected individual frame analysis, if only that it increases the accuracy of reproducibility. However, future studies are necessary to investigate if this gating method will result in improved measurement reproducibility within longitudinal studies.
The lower success rate to perform gating as compared to ICUS is mainly due to the much lower frame rates of the first generation systems (minimum of 5 frames/s up to a maximum of 20 frames/s, by comparison ICUS acquires images at 30 frames/s). This results in datasets where there are many fewer cross-sections acquired in the near end-diastolic phase, since at a frame rate of <5 frames/s, images are acquired with time gaps between frames of ≥200 ms. These gaps are too large to acquire images closely to the, relatively short, end-diastolic moment. Furthermore, since the imaging-probe for OCT is a wire, it sticks more easily to the coronary vessel wall, and is possibly much less influenced by longitudinal motion artefacts, by dislocation compared to ICUS catheters. It may look like a contradiction but larger motion artefacts results in better chances for image based-gating methods.
Conclusion
Retrospective image-based time-domain OCT gating in the presence of motion induced artefacts is feasible. Significant changes in coronary lumen dimensions during the cardiac cycle were observed by OCT and in consequence, quantitative gated OCT analysis showed significant differences compared to non-gated QOCT analyses.