Abstract
Aims: Accurate risk prediction in patients undergoing revascularisation is essential. We aimed to assess the predictive performance of Society of Thoracic Surgeons (STS) risk models in patients with left main coronary artery disease (LMCAD) undergoing coronary artery bypass grafting (CABG) or percutaneous coronary intervention with everolimus-eluting stents (PCI-EES).
Methods and results: The predictive performance of STS risk models for perioperative mortality, stroke and renal failure was evaluated for their discriminative ability (C statistic) and calibration (Hosmer-Lemeshow goodness-of-fit-test; χ2 and p-values) among patients with LMCAD undergoing PCI-EES (n=935) and CABG (n=923) from the randomised EXCEL trial. STS risk scores, in CABG patients, showed good discrimination for 30-day mortality and average discrimination for stroke (C statistic 0.730 and 0.629, respectively) with average calibration. For PCI, STS risk scores had no discrimination for mortality (C statistic 0.507), yet good discrimination (C statistic 0.751) and calibration for stroke. The predictive performance for renal failure was good for CABG (C statistic 0.82), yet poor for PCI (C statistic 0.59).
Conclusions: In selected patients with LMCAD from the EXCEL trial, STS risk models showed good predictive performance for CABG yet lacked predictive performance for PCI for perioperative mortality and renal failure. The STS stroke risk model was surprisingly more discriminating in PCI compared to CABG. Improved and procedure-specific risk prediction instruments are needed to accurately estimate adverse events after LMCAD revascularisation by CABG and PCI. ClinicalTrials.gov Identifier: NCT01205776
Introduction
Accurate preoperative risk assessment is essential to decide between percutaneous coronary intervention (PCI) and coronary artery bypass graft (CABG) surgery in patients with advanced coronary artery disease (CAD). This is particularly true now as PCI is increasingly accepted as a suitable alternative to CABG in selected patients with multivessel and left main coronary artery disease (LMCAD)1,2,3,4,5,6,7,8. Moreover, it is unclear how risk score calculators perform in selected patients with isolated LMCAD undergoing revascularisation in the current era.
The randomised EXCEL (Evaluation of XIENCE versus Coronary Artery Bypass Grafting for Effectiveness of Left Main Revascularisation) trial showed that PCI with everolimus-eluting stents (EES) was non-inferior to CABG in patients with LMCAD and simple or moderate anatomic coronary complexity in terms of death, large myocardial infarction9, or stroke at an intermediate follow-up time of three years. Patients who underwent PCI had fewer major adverse events in the periprocedural period compared with those who underwent CABG, yet had a higher three-year rate of ischaemia-driven repeat revascularisation10. Patients at low risk of surgical complications may thus have a more favourable risk-benefit profile after CABG.
Multiple risk stratification tools have been developed to predict perioperative outcomes after CABG11,12,13,14. These predictive models can guide cardiothoracic surgeons and cardiologists during Heart Team meetings to select the optimal treatment and predict their clinical outcomes, as recommended by the ESC/EACTS 2018 Guidelines on myocardial revascularisation6,15.
It is unclear, however, whether the accuracy of isolated “CABG-only” STS risk models will remain as robust when applied in specific patient sub-cohorts (e.g., LMCAD EXCEL patients) treated with CABG or alternatively with PCI. We therefore sought to investigate the predictive performance of STS risk scores in patients who underwent CABG for LMCAD in the randomised EXCEL trial. We also examined the utility of STS risk models in PCI-treated subjects to determine whether these models enable the identification of those patients best managed by one or the other revascularisation modality.
Methods
STUDY DESIGN
The design and results of the EXCEL study have been reported previously10,16. In brief, the EXCEL trial was a multicentre randomised trial that compared CABG to PCI with EES (XIENCE; Abbott Vascular, Santa Clara, CA, USA) in patients with LMCAD. The trial was approved by the local ethics committees of all participating sites and is registered at ClinicalTrials.gov (NCT01205776). The EXCEL trial randomised 1,905 patients with LMCAD and a low or intermediate SYNTAX score (≤32, site-determined) to undergo CABG (n=957) or PCI with EES (n=948). Of the 957 patients randomised to CABG, 930 underwent revascularisation, with CABG being the primary procedure in 923 patients (as-treated). Of the 948 patients randomised to PCI, 942 underwent revascularisation and, of these, 935 patients underwent PCI as the primary procedure (as-treated). The current study included the as-treated randomised patients (CABG n=923 and PCI n=935) to assess whether 30-day clinical outcomes could be accurately predicted by the STS predicted risk of mortality (PROM), stroke, and renal failure risk models. STS risk scores were calculated by implementing the STS CABG risk models as per the specifications described by Shahian et al12; the accuracy of implementation was confirmed by robust cross-checking with the “online STS Adult Cardiac Surgery Risk Calculator” for “isolated coronary artery bypass”17. The definitions of death, stroke and renal failure used by the EXCEL trial are consistent with the definitions used by the STS adult cardiac surgery database.
STUDY ENDPOINTS
The primary endpoint was the predictive performance of the STS PROM and stroke risk scores in the as-treated LMCAD population that underwent CABG or PCI. The secondary endpoint was the predictive performance of the STS renal failure risk score in the CABG and PCI cohorts.
STATISTICAL ANALYSIS
Continuous variables were expressed as mean±standard deviation (SD), and discrete variables were expressed as percentage with frequency, unless otherwise stated. An unpaired t-test was used to compare mean outcomes, and the Wilcoxon two-sample test was used to compare median outcomes. Overall observed to expected (O/E) ratios were visualised by bar plots. The χ2 test was used to calculate p-values and 95% confidence intervals (CI) on the difference in observed to expected proportions (O/E ratios) between treatment groups. An O/E ratio of >1 indicated underprediction of the clinical outcome by the STS risk score.
Each treatment group was split into quintiles based on the mean predicted STS risk scores, ranking subgroups from lowest predicted risk scores to highest predicted risk scores. The PROM, stroke, and renal STS models were evaluated for their discriminating ability using the area under the receiver operating curve according to the “concordance” (C statistic) methodology. A C statistic outcome of 1.0 indicates perfect discriminative power, whereas 0.5 indicates no discriminative ability18. Risk model calibration competence was assessed using the Hosmer-Lemeshow goodness-of-fit test to examine the observed versus expected outcomes for all quintiles. Specifically for the Hosmer-Lemeshow goodness-of-fit test, a two-sided p-value of ≤0.05 indicates a statistically significant difference between observed and expected values; therefore, a p-value >0.05 indicates better predictive performance. For all other statistical tests, a p<0.05 was considered to be statistically significant. Statistical analyses were performed with SAS version 9.4 (SAS Institute, Cary, NC, USA).
Results
BASELINE AND PROCEDURAL CHARACTERISTICS
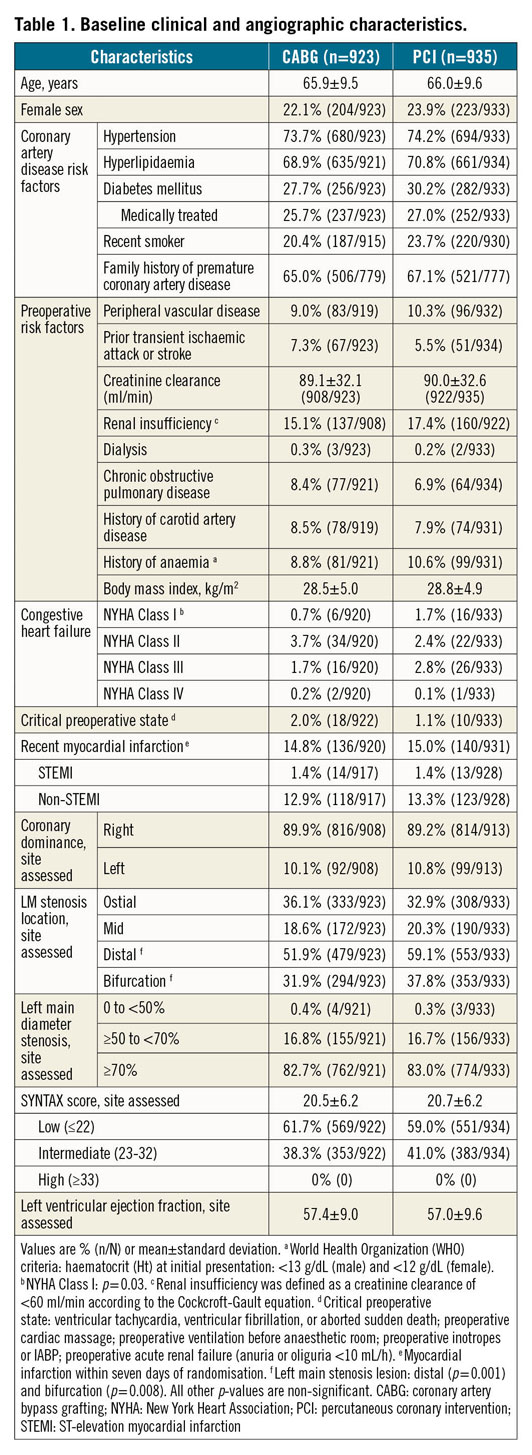
Baseline characteristics between the as-treated CABG and PCI groups were similar except for modest differences in New York Heart Association Class I, and distal left main stenosis anatomy (Table 1). Off-pump CABG was performed in 29.4% of the procedures; bilateral internal thoracic arteries were used in 22.4%. Mean post-procedural in-hospital stay was 8.3±7.8 days for CABG and 2.2±2.9 days for PCI (p<0.0001) (Supplementary Table 1).
STS PROM RISK SCORES
The mean expected 30-day STS PROM scores were similar for patients who underwent CABG (0.85%±0.76%) versus PCI (0.90%±0.89%, p=0.21). Observed 30-day mortality rates were also similar between CABG (n=10, 1.1%) and PCI (n=9; 1.0%) (p=0.83). This resulted in comparable O/E ratios (1.27 vs 1.07, respectively, p=0.32) (Figure 1, Supplementary Table 1-Supplementary Table 3). The STS PROM C statistic for CABG was 0.73 (Figure 2A) and 0.51 for PCI (Figure 2B). The Hosmer-Lemeshow goodness-of-fit test was 10.21 (p=0.25) for CABG and 8.81 (p=0.36) for PCI (Figure 2C, Figure 2D).
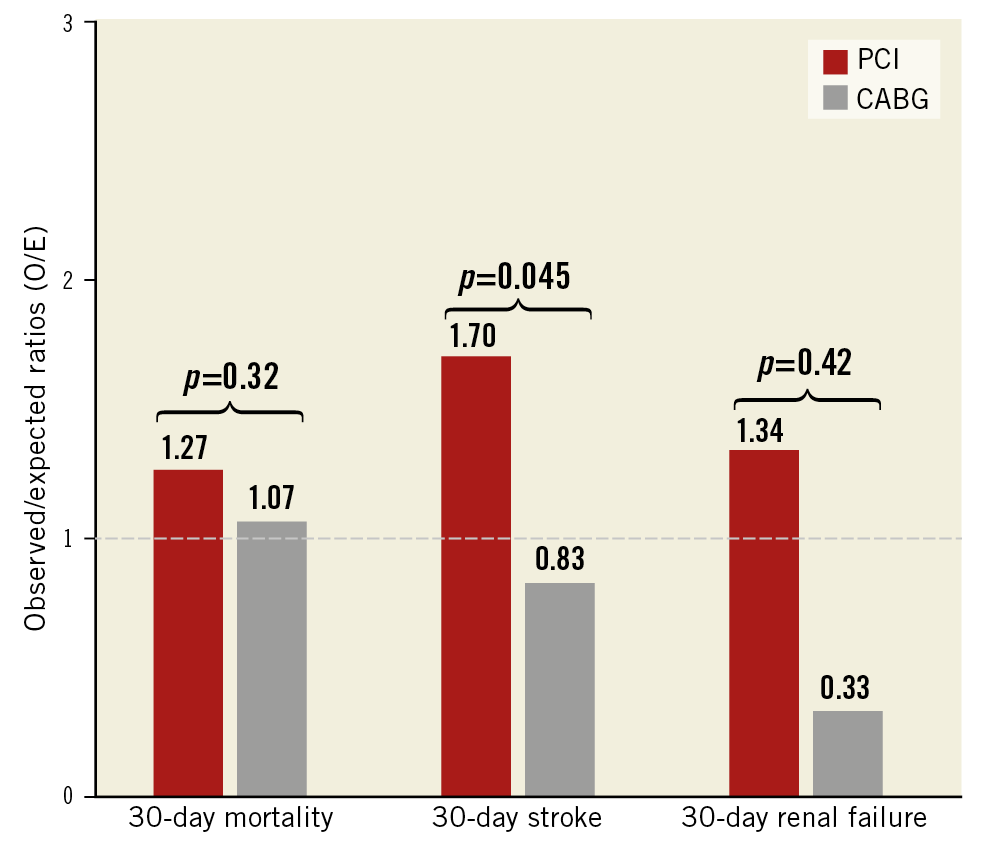
Figure 1. Observed to expected (O/E) ratios for 30-day all-cause mortality, 30-day stroke, and 30-day renal failure after coronary artery bypass grafting (CABG; n=923) and percutaneous coronary intervention (PCI; n=935).
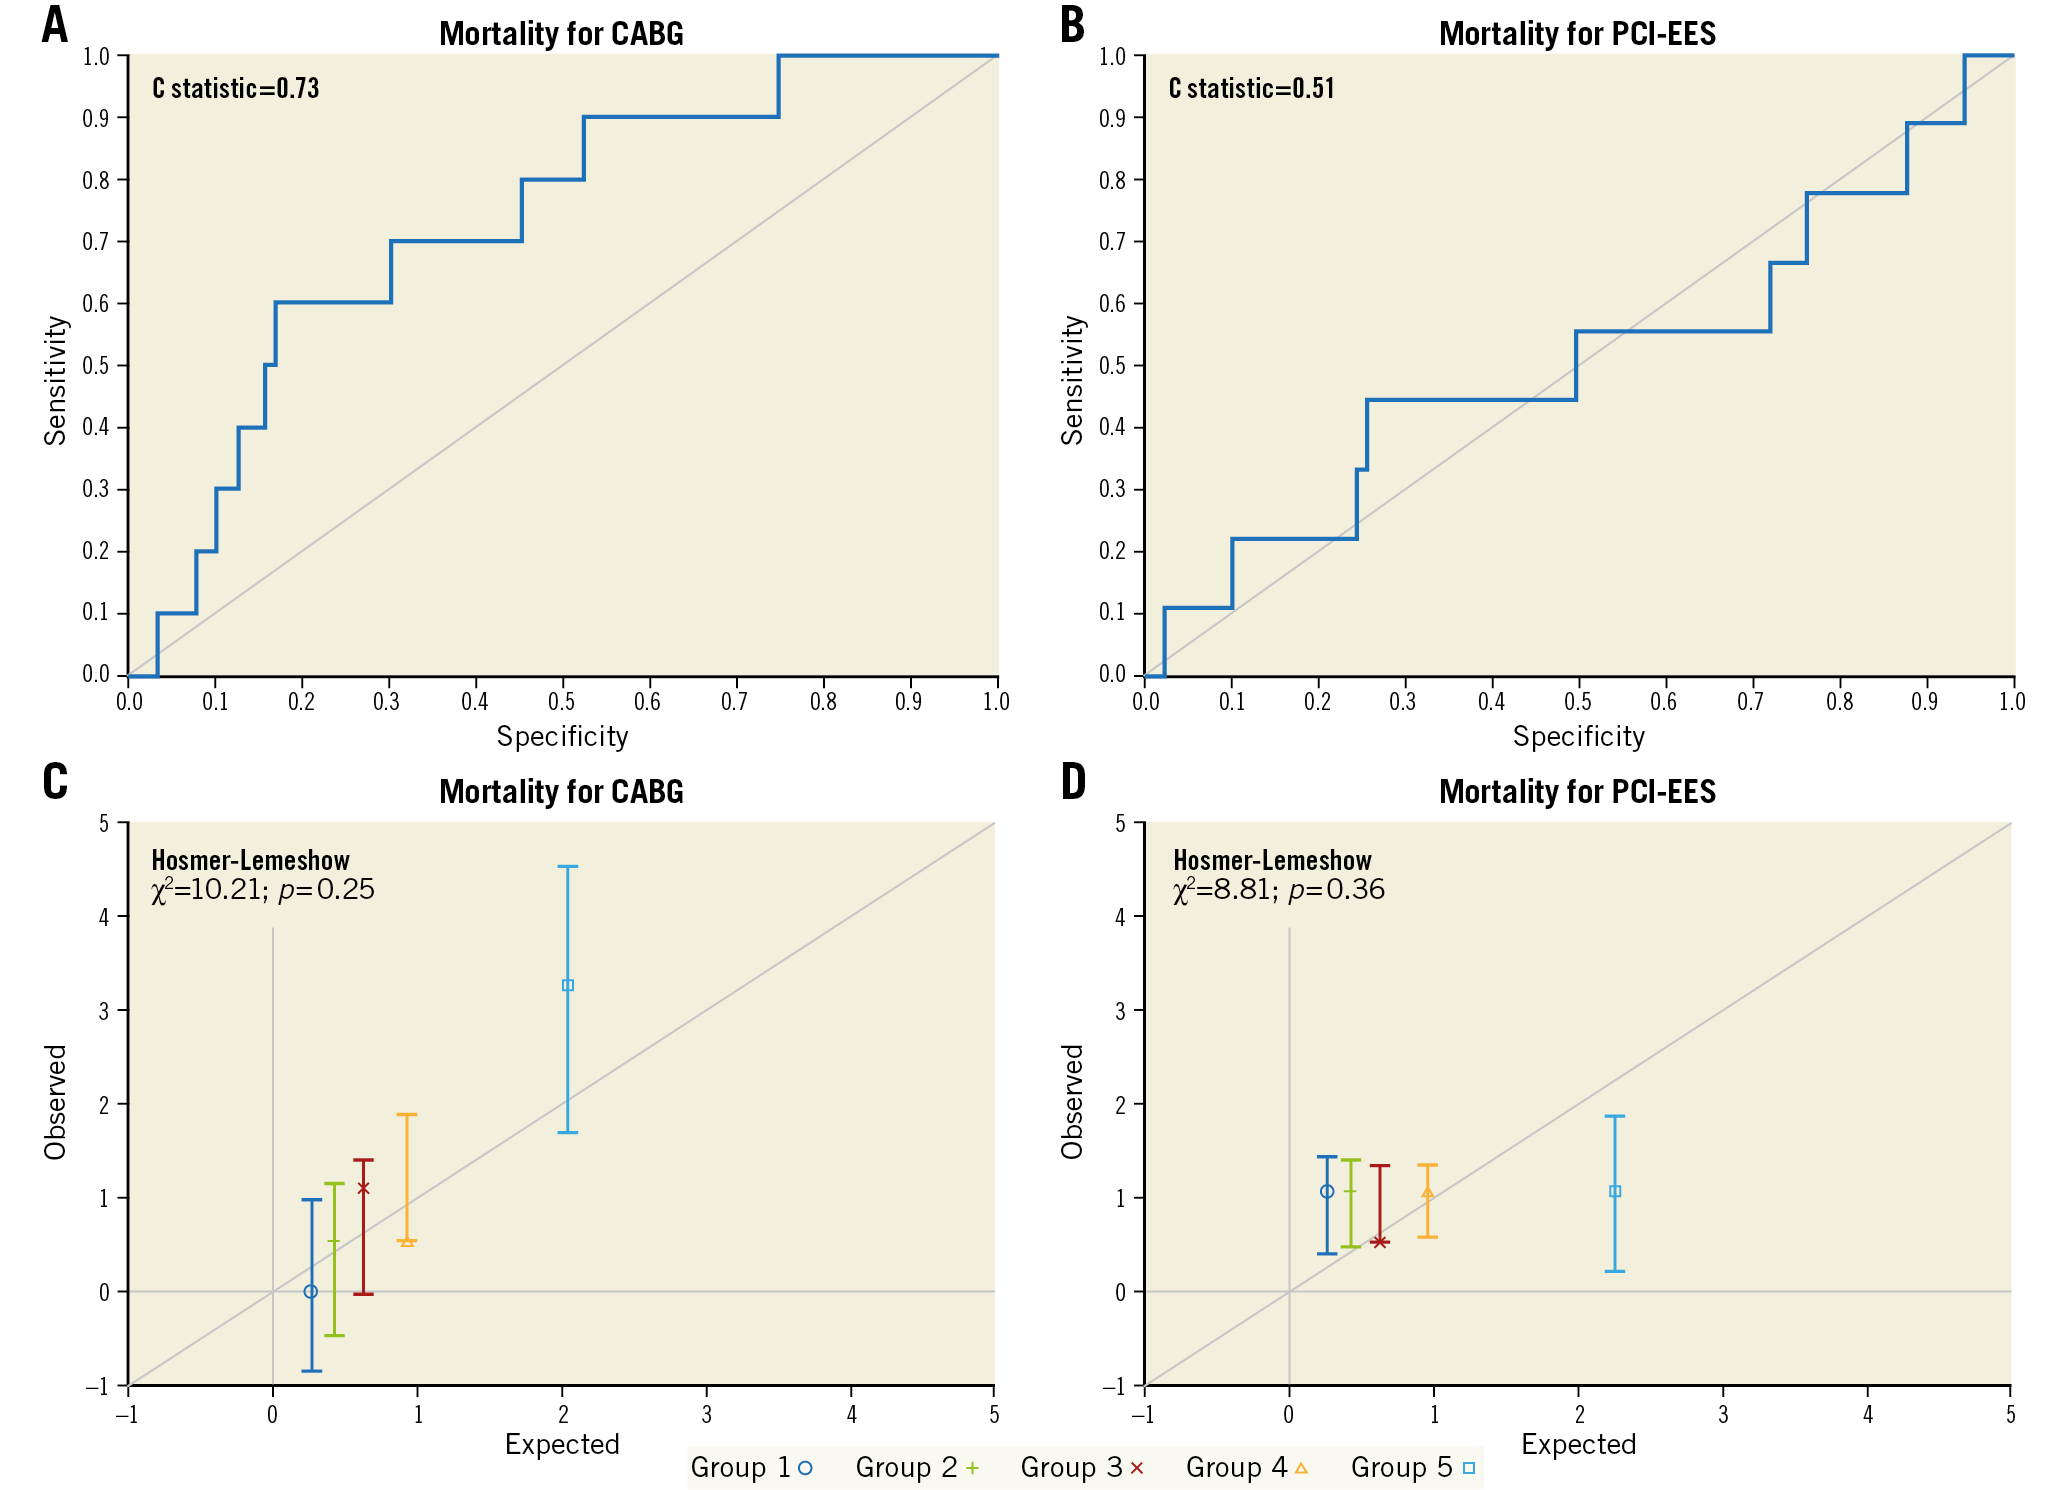
Figure 2. Representation of STS PROM score performance by C statistic (A & B) and Hosmer-Lemeshow goodness-of-fit tests (C & D) for coronary artery bypass grafting (CABG) and percutaneous coronary intervention with everolimus-eluting stents (PCI-EES). Panels C and D represent groups ordered by quintiles from the lowest predicted risk scores to the highest predicted risk scores.
STS STROKE RISK SCORES
The mean expected 30-day STS stroke scores were 0.76%±0.54% for CABG versus 0.77%±0.61% for PCI patients (p=0.86). Stroke occurred in 1.3% (n=12) after CABG versus 0.6% (n=6) after PCI (p=0.12). Consequently, stroke O/E ratios were 1.70 for CABG and 0.83 for PCI (p=0.045) (Figure 1, Supplementary Table 2-Supplementary Table 4). The C statistic for the STS stroke risk score was 0.63 for CABG compared with 0.75 for PCI (Figure 3A, Figure 3B). The Hosmer-Lemeshow goodness-of-fit test was 7.21 (p=0.51) for CABG and 6.13 (p=0.63) for PCI (Figure 3C, Figure 3D).
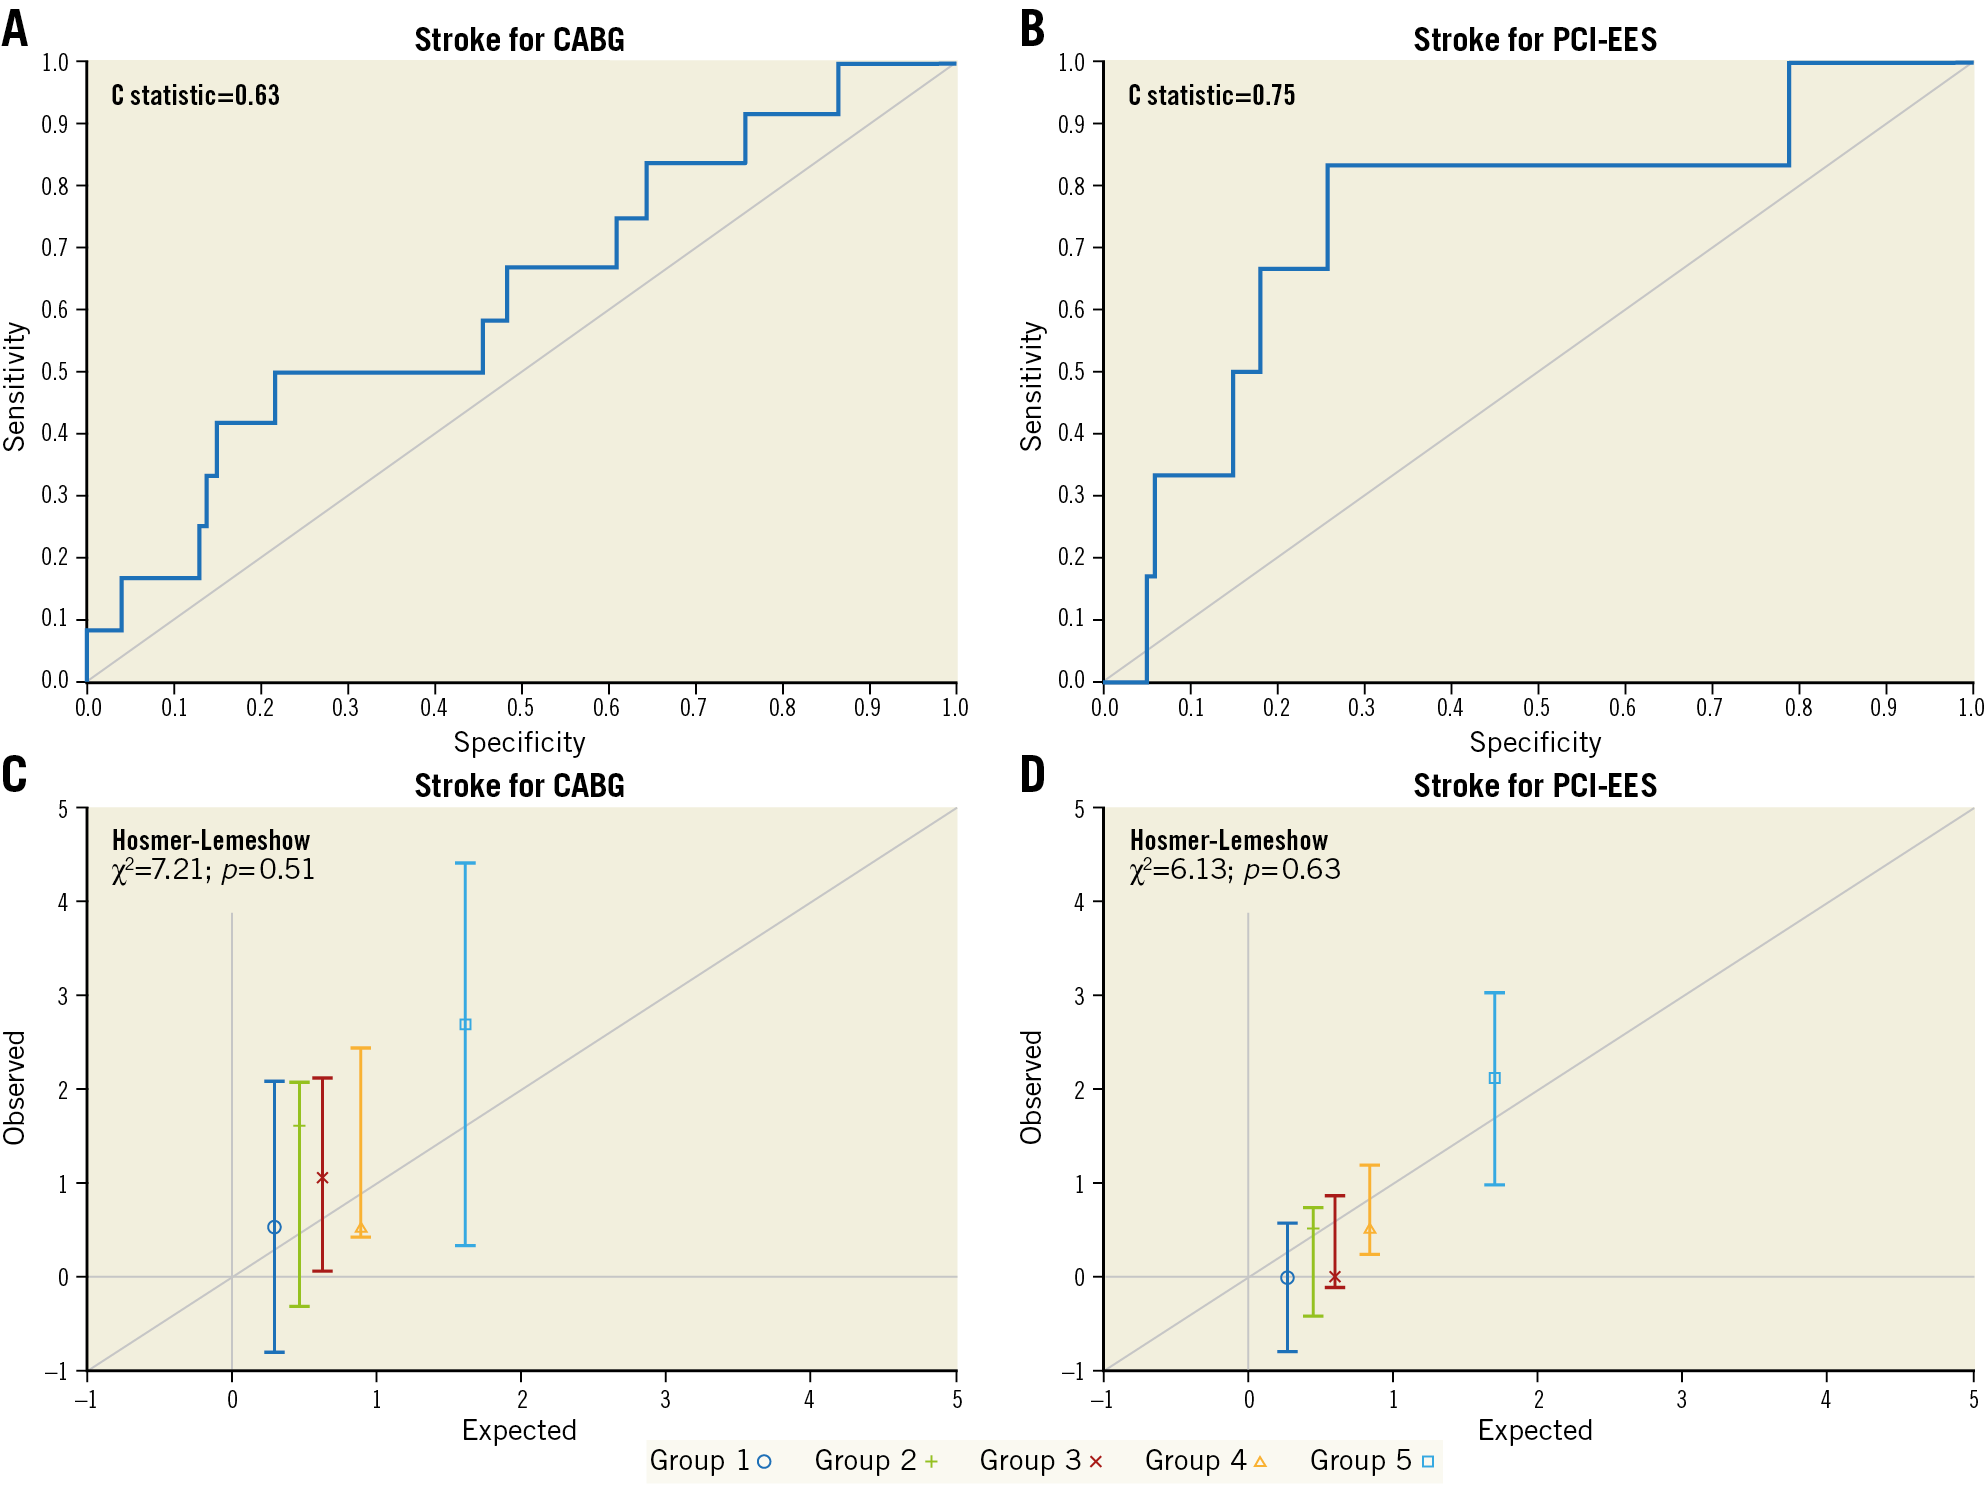
Figure 3. Representation of STS stroke risk score performance by C statistic (A & B) and Hosmer-Lemeshow goodness-of-fit tests (C & D) for coronary artery bypass grafting (CABG) and percutaneous coronary intervention with everolimus-eluting stents (PCI-EES). Panels C and D represent groups ordered by quintiles from the lowest predicted risk scores to the highest predicted risk scores.
STS RENAL FAILURE RISK SCORES
No differences were found between the mean expected 30-day STS renal failure scores in the CABG cohort (1.95%±2.13%) and the PCI cohort (1.95%±2.35%, p=0.96). Observed renal failure rates, at 30 days, were 2.6% in patients who underwent CABG (n=24) and 0.6% in patients who underwent PCI (n=6) (p<0.001). Subsequently, renal O/E ratios were 1.34 for CABG and 0.33 for PCI (p=0.42) (Figure 1, Supplementary Table 3-Supplementary Table 5). The C statistic was 0.82 for CABG and 0.59 for PCI (Figure 4A, Figure 4B), and the Hosmer-Lemeshow goodness-of-fit test was 14.73 (p=0.065) for CABG (Figure 4C) and 11.98 (p=0.15) for PCI (Figure 4D).
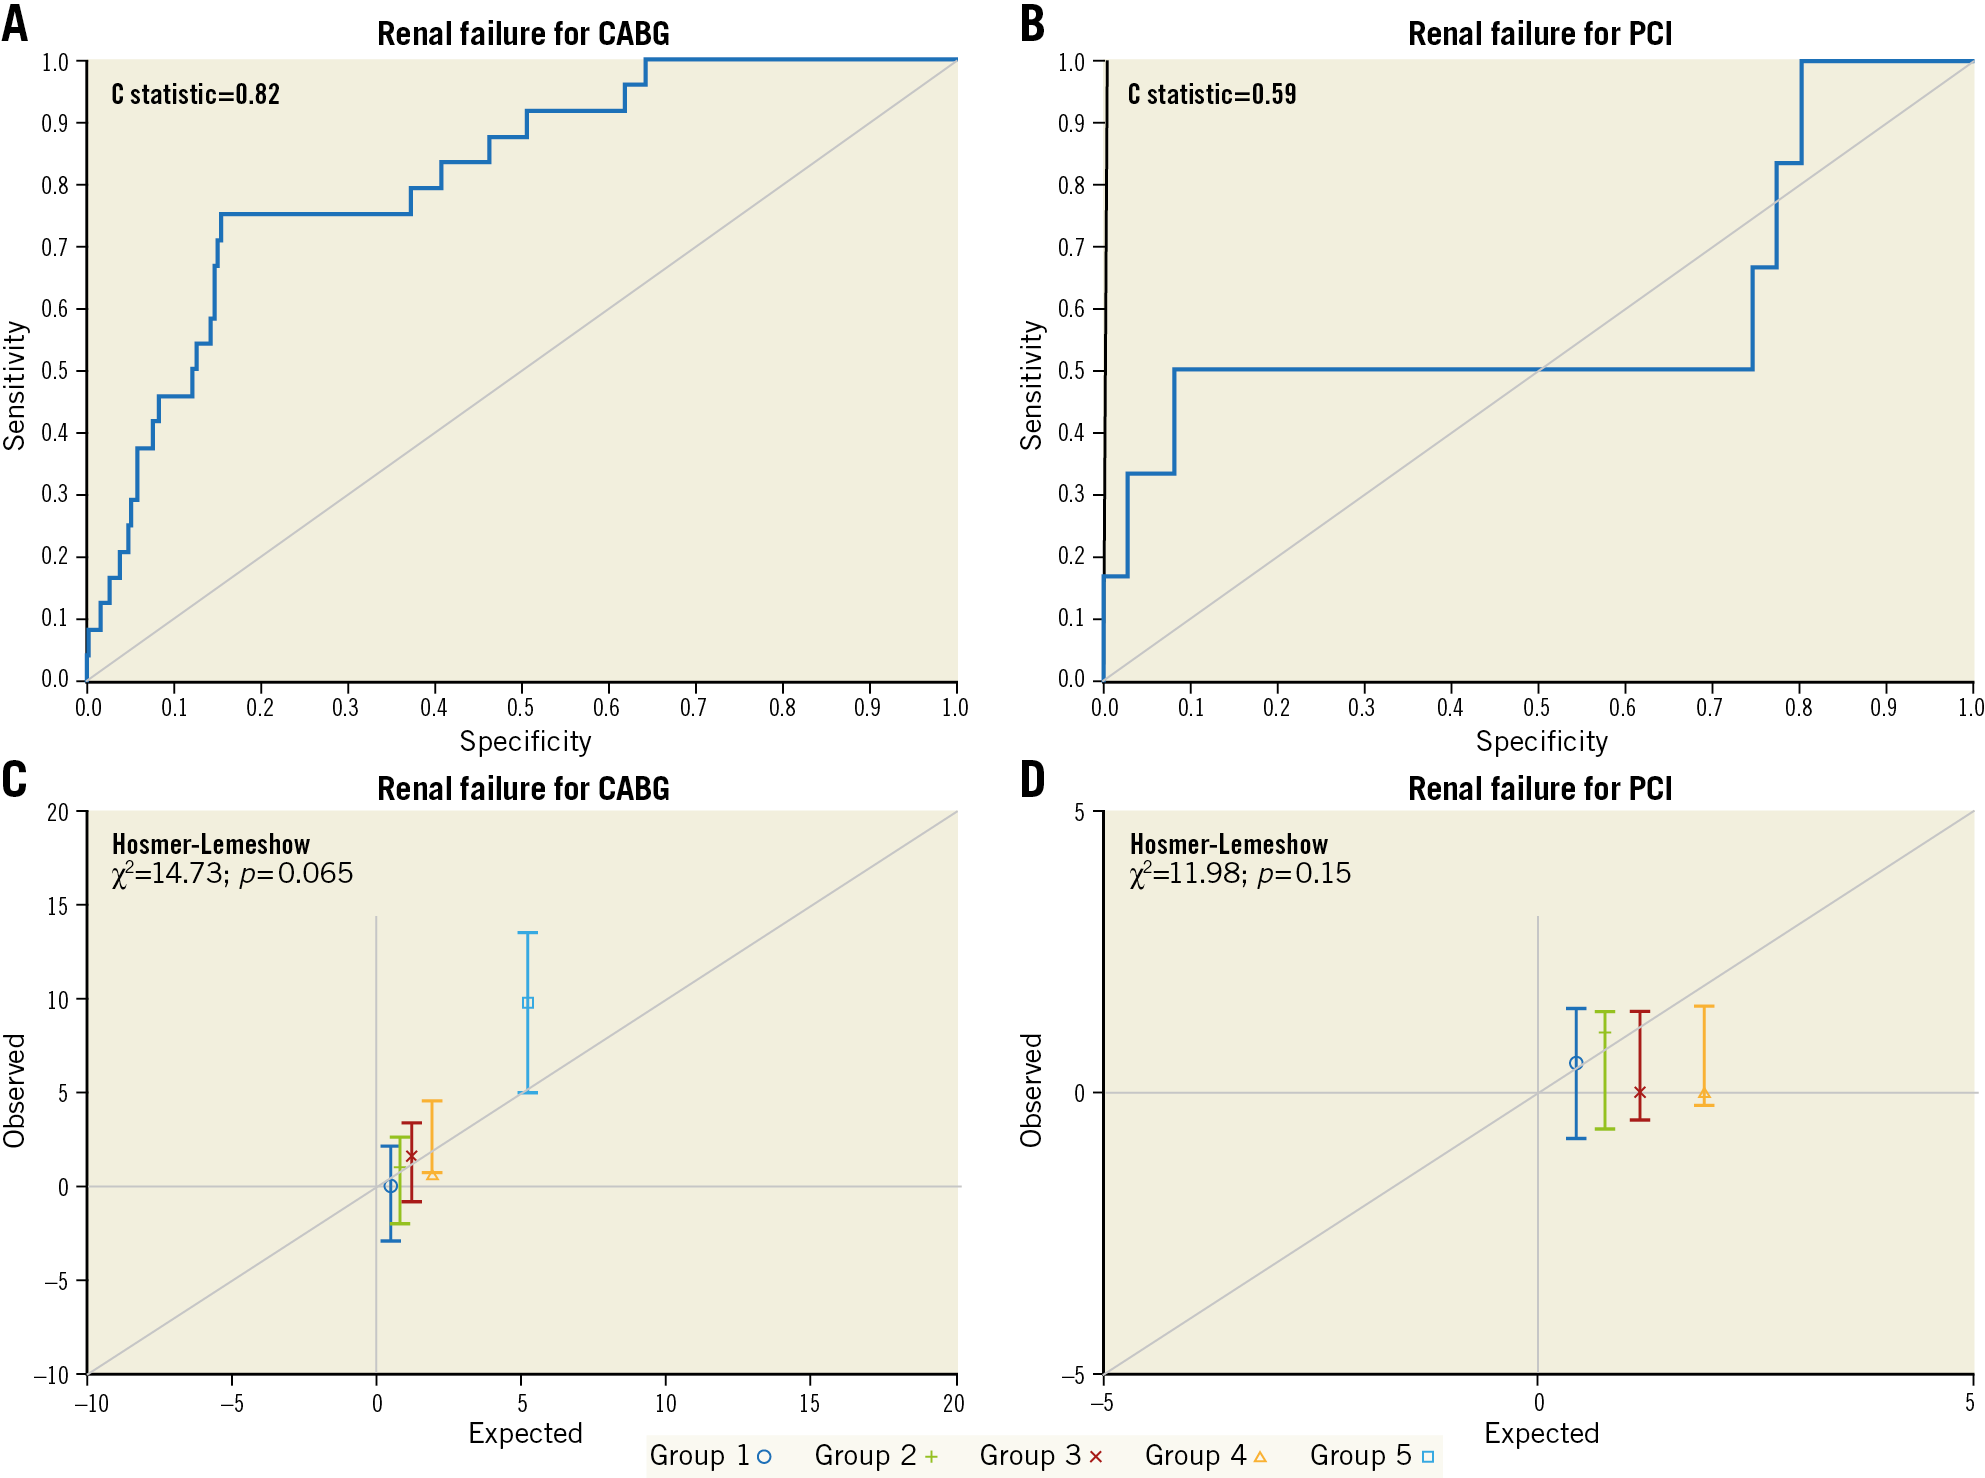
Figure 4. Representation of STS renal failure risk score performance by C statistic (A & B) and Hosmer-Lemeshow goodness-of-fit tests (C & D) for coronary artery bypass grafting (CABG) and percutaneous coronary intervention with everolimus-eluting stents (PCI-EES). Panels C and D represent groups ordered by quintiles from the lowest predicted risk scores to the highest predicted risk scores.
Discussion
For patients with LMCAD undergoing revascularisation in the EXCEL trial, the perioperative STS PROM risk model for CABG patients showed good predictive performance based on the C statistic and was well calibrated according to the Hosmer-Lemeshow goodness-of-fit test, with modest underprediction of mortality among high-risk patients. Conversely, the STS PROM risk model was non-predictive after PCI with EES (C statistic 0.507; comparable to “flipping a coin”). In particular, perioperative mortality was overestimated by the STS PROM in the highest PCI risk quintile10; however, the number of very high risk patients was limited in EXCEL, potentially reducing the precision of the STS predictive ability in higher risk groups19. The predictive ability for stroke was reasonably good for both PCI and CABG. Finally, the predictive performance of STS renal failure risk scores was good in the CABG cohort, but poor in the PCI group. As the number of more complex patients with CAD who are discussed during Heart Team meetings increases, it is important to be able to predict the risk of adverse events after CABG or PCI accurately. Therefore, evaluating the predictive performance of the STS risk score calculator provides valuable insights into perioperative risk assessment in the contemporary revascularisation era.
The STS isolated CABG risk models were developed and validated for short-term outcomes (in-hospital or 30-day mortality and other major morbidity) based on a large, national-scale and all-inclusive isolated CABG surgery patient population derived from the STS adult cardiac surgery database over a period of time (one to three years)12. It is therefore not surprising that STS risk models predicted outcomes less accurately in patients undergoing PCI with EES compared with those undergoing CABG. During structured Heart Team meetings, clinicians should combine the results from the STS and other risk scores with clinical judgement and current guidelines to determine the optimal patient-tailored and evidence-based revascularisation decision6,15. Besides, it is important to account for the expected increased short-term risk of surgical intervention versus potential differential long-term outcomes of available treatment options.
In the current study, stroke within 30 days occurred less often after PCI compared to CABG. This finding is in line with a prior large-scale meta-analysis reporting a significantly lower 30-day rate of stroke after PCI compared with CABG in LMCAD (odds ratio [OR] 0.36, 95% CI: 0.16-0.82, p=0.007)8,20. Nonetheless, it was surprising that the STS risk model underestimated the risk of stroke at 30 days in patients who underwent CABG (O/E 1.70). The STS stroke risk model was developed and validated in an all-inclusive (LMCAD and non-LMCAD) patient population without including LMCAD as a predictor variable of perioperative stroke. Risk models developed in specific sub-cohorts (e.g., LMCAD only) can differ appreciably from models based on overall patient populations. In the EXCEL trial, the PCI cohort had a lower 30-day stroke rate (n=6, 0.6%) compared with CABG (n=12, 1.3%; OR 0.5, 95% CI: 0.19-1.33, p=0.15)9. The risk of developing stroke is influenced by multiple underlying causes, in both CABG and PCI cohorts, such as (i) on-pump versus off-pump, (ii) usage of side-biting aorta clamp, (iii) single versus dual antiplatelet therapy, (iv) use of single versus bilateral internal thoracic arteries, (v) post-procedural atrial fibrillation, and (vi) femoral versus radial artery percutaneous access20,21. STS risk models are solely based on demographic and preoperative CABG patient factors and comorbidity. Therefore, a different way of modelling is warranted to take into account all periprocedural factors influencing the risk of stroke.
Renal failure is a well-known and serious complication after cardiopulmonary bypass, and the excess use of contrast agents during PCI22 increases the risk of mortality and morbidity23. A subgroup analysis of patients with versus without chronic kidney disease from the EXCEL trial showed that PCI compared with CABG was associated with lower rates of acute renal failure in patients with (2.3% vs 7.6%; OR 0.28, 95% CI: 0.09-0.87) versus without chronic kidney disease (0.3% vs 1.3%; OR 0.20, 95% CI: 0.04-0.90)24. Nonetheless, no treatment interaction was identified (p for interaction=0.71). It is important to predict the risk of renal failure after revascularisation adequately in order to personalise treatment strategies in individual patients. The predictive performance of the STS renal failure risk model was excellent in the CABG cohort; however, it performed poorly in the PCI cohort.
To date, no risk model has focused exclusively on predicting perioperative outcomes in patients with LMCAD. The CABG-specific STS risk model did not include LMCAD as a predictor of the risk for mortality, stroke, renal failure, and reoperation. Rather, it only included LMCAD-specific coefficients for “prolonged ventilation” and “any composite adverse outcome”12. The SYNTAX score II did take LMCAD into account by grading the presence of a ≥50% left main with the highest possible weighting factor, but this risk score was developed and validated for predicting long-term (four-year) mortality in patients with complex CAD14. To determine perioperative clinical outcomes for LMCAD patients more accurately, risk models specifically and separately created for the LMCAD-CABG and LMCAD-PCI patient populations will probably prove to be more discriminating.
Limitations
In the current study, the predicted STS risk scores were computed based on the 2008 STS risk models. The STS Adult Cardiac Surgery Risk models were recently updated using a more recent patient population and considering a larger number of predictive variables25. Since not all variables that were used in the updated STS models were collected in the EXCEL trial, it was not possible to evaluate the predictive performance of the 2018 STS CABG risk models in the EXCEL trial population. Furthermore, the EXCEL trial excluded patients with high site-determined SYNTAX scores; therefore, the results of this study cannot be generalised to such patients (SYNTAX score ≥33).
Conclusions
In selected patients with LMCAD from the EXCEL trial, STS risk models showed good predictive performance for CABG yet were non-predictive for PCI regarding perioperative mortality and renal failure. The STS stroke risk model was surprisingly more discriminating in PCI compared to CABG. Derivation and validation of treatment- and cohort-specific risk models are warranted for optimal prediction of perioperative clinical outcomes in patients with LMCAD requiring revascularisation, bearing in mind the between-treatment differences emerging beyond 30 days.
|
Impact on daily practice In selected patients with LMCAD from the EXCEL trial, STS risk models showed good predictive performance for CABG yet lacked predictive ability for PCI regarding perioperative mortality and renal failure. The STS stroke risk model was surprisingly more discriminating in PCI compared to CABG. Derivation and validation of treatment- and cohort-specific risk models are warranted for optimal prediction of perioperative clinical outcomes of CABG and PCI in patients with LMCAD to guide clinical decision support better and to choose the best revascularisation treatment. |
Guest Editor
This paper was guest edited by Alec Vahanian, MD, PhD; Department of Cardiology, Hôpital Bichat-Claude Bernard, and University Paris VII, Paris, France.
Acknowledgements
We would like to thank Alyssar Habib for her contributions in computing the expected STS risk scores.
Funding
The EXCEL trial was supported by Abbott Vascular (Santa Clara, CA, USA).
Conflict of interest statement
G.W. Stone has served as a consultant to Matrizyme, Miracor, Neovasc, V-wave, Shockwave, Valfix, TherOx, Reva, Vascular Dynamics, Robocath, HeartFlow, Gore, Ablative Solutions, Abiomed and Ancora; has received speaker honoraria from Amaranth and Terumo; holds equity/options in Ancora, Cagent, Qool Therapeutics, Aria, Caliber, MedFocus family of funds, Biostar family of funds, Applied Therapeutics and SpectraWAVE; has served as a director for SpectraWAVE; and his employer, Columbia University, receives royalties for sale of the MitraClip from Abbott. P.W. Serruys reports receiving personal fees from Abbott, Biosensors, Medtronic, Micell Technologies, Qualimed, Sinomedical Technologies, St. Jude Medical, Stentys, Svelte, Philips/Volcano, Xeltis, and HeartFlow outside the submitted work. J. Sabik reports receiving personal fees from Medtronic, Edwards, and Sorin, and sits on the advisory board of Medtronic Cardiac Surgery. J. Puskas reports working as a consultant to Medtronic. A. Kappetein reports working as an employee of Medtronic, outside the submitted work. S. Head reports being an employee of Medtronic. The other authors have no conflicts of interest to declare. The Guest Editor is a consultant for Edwards Lifesciences.
Supplementary data
To read the full content of this article, please download the PDF.
