Abstract
Aims: The aim of the study was to develop a formula enabling the quantification of aortic valve calcification (AVC) on contrast-enhanced CT of patients undergoing transcatheter aortic valve implantation (TAVI).
Methods and results: Two hundred and seventeen (217) consecutive patients with severe aortic valve stenosis undergoing non-enhanced electrocardiography-gated CT angiography (NECT) and contrast-enhanced electrocardiography-gated CT angiography (CECT) prior to TAVI were subdivided into a training cohort (n=145) and a validation cohort (n=72). Aortic valve calcification (AVC) was semi-automatically segmented on CECT (AVCCE). Agatston score (AS) quantified on NECT served as reference standard. Applying a linear regression model, we derived a formula for quantification of the AS on CECT in the training cohort ![]() . Testing the formula in CECT of the validation cohort yielded a calculated median AS of 2,339 (interquartile range [IQR]: 1,609-3,643), being not significantly different to the reference standard AS based on NECT (median 2,455, IQR: 1,503-3,611, p=0.452). Intra-class correlation coefficient (0.897) and Bland-Altman analysis (mean difference of scores: –0.75) showed excellent agreement. As a rule of thumb, the formula AS=2×AVCCE may be applied to calculate the AS.
. Testing the formula in CECT of the validation cohort yielded a calculated median AS of 2,339 (interquartile range [IQR]: 1,609-3,643), being not significantly different to the reference standard AS based on NECT (median 2,455, IQR: 1,503-3,611, p=0.452). Intra-class correlation coefficient (0.897) and Bland-Altman analysis (mean difference of scores: –0.75) showed excellent agreement. As a rule of thumb, the formula AS=2×AVCCE may be applied to calculate the AS.
Conclusions: We introduced a formula enabling the accurate quantification of AVC on CECT, to speed up clinical workflow in cases where NECT scans are initially not available and to assist echocardiography in assessing aortic stenosis severity.
Abbreviations
AVA: aortic valve area
AVC: aortic valve calcification
AVCCE: aortic valve calcification segmented on CECT
AS: Agatston score
CECT: contrast-enhanced computed tomography
CT: computed tomography
ECG: electrocardiography
HU: Hounsfield unit
HUAV: HU average attenuation of the aorta
HUSD: HU standard deviation of the attenuation of the aorta
ICC: intra-class correlation coefficient
IQR: interquartile range
NECT: non-enhanced computed tomography
ROI: region of interest
TAVI: transcatheter aortic valve implantation
Introduction
Aortic valve calcification (AVC) is the process leading to aortic valve stenosis and correlates with the severity of aortic stenosis1,2. Moderate or severe AVC is a strong and independent risk factor for adverse clinical outcome in patients with asymptomatic aortic stenosis and delayed surgery3. AVC is a risk factor for post-interventional conduction disturbances, aortic regurgitation, and a predictor of adverse outcome after transcatheter aortic valve implantation (TAVI)4-8.
Echocardiography is the reference method for grading aortic stenosis9. However, in about one third of patients there are discordant findings, mainly in those with a small aortic valve area (AVA) but low systolic pressure gradients (≤40 mmHg), resulting in a potentially inconclusive echocardiographic assessment1,10,11. In these patients, a multimodality imaging approach has been suggested for the assessment of aortic stenosis severity12,13, paying particular attention to the extent of AVC determined with computed tomography (CT)1,2,12. It has been shown that there is a good correlation between the extent of AVC and AVA2, and that the AVC provides incremental prognostic value for survival beyond clinical and Doppler echocardiographic assessment compared to the AVA alone1.
Prior to TAVI, quantification of AVC with CT is performed using the method proposed by Agatston1,2,14, which requires the acquisition of a non-enhanced CT (NECT) scan at 120 kVp in addition to the contrast-enhanced CT angiography scan. In daily practice, however, calcifications of the aortic valve are often incidental findings in CT angiography scans, initially not intended for preoperative planning of the TAVI procedure, and the Agatston score of the valve cannot be accurately determined without having a NECT scan available. Thus, patients must be rescheduled for a separate NECT scan if quantification of AVC is required. It would also be desirable to have a method available allowing the quantification of AVC on CECT examinations. Obviating the need for a NECT scan to determine AVC prior to TAVI would be preferable, also for saving radiation dose in the increasingly younger population undergoing the TAVI procedure15-17.
The purpose of this study was to develop a formula enabling the quantification of AVC on the CECT scans of patients planned to undergo the TAVI procedure.
Methods
PATIENT POPULATION
Between September 2008 and November 2016, we screened all 227 patients who underwent NECT and CECT as part of the same CT examination for preinterventional TAVI assessment for inclusion into this retrospective study. Patients with previous aortic valve replacement (n=10) were excluded, resulting in 217 included patients. Patients were subdivided into a training cohort (n=145 patients) and a validation cohort (n=72 patients). Baseline data collection, including clinical and echocardiographic information, was performed in the context of a nationwide prospective registry (SWISS TAVI registry). This study had institutional and local ethics committee approval. All patients provided written informed consent.
CT DATA ACQUISITION AND IMAGE RECONSTRUCTION
All patients underwent NECT and CECT on a 192-slice dual-source CT scanner (Somatom Force; Siemens Healthineers, Forchheim, Germany).
Prospectively electrocardiography (ECG)-gated NECT was performed in a sequential mode at 70% of the RR interval using institutional standard protocol and reconstruction settings including a tube voltage of 120 kVp.
Then, prospectively ECG-gated high-pitch CECT was performed with our default scan and reconstruction protocol using automated attenuation-based tube voltage selection (CarekV, reference 100 kVp), resulting in an effective tube voltage of between 70 and 140 kVp. Volume and flow rate of contrast media (iopromide, Ultravist®, 370 mg/mL; Bayer HealthCare, Berlin, Germany) was chosen according to the automatically selected tube voltages18. A signal attenuation threshold of 100 Hounsfield units (HU) at 120 kVp was used for bolus tracking in the ascending aorta. The scan ranged from the apex of the lungs to the lesser trochanter of the femur.
AGATSTON SCORE
For quantification of AVC using the Agatston score method19, we applied software developed for semi-automatic assessment of coronary calcium (Calcium Scoring application, syngo.via; Siemens Healthineers), which predefines areas with attenuation of ≥130 HU at 120 kVp and allows the user to select the calcification supposed to be related to the aortic valve via a mouse click on axial images (Figure 1).
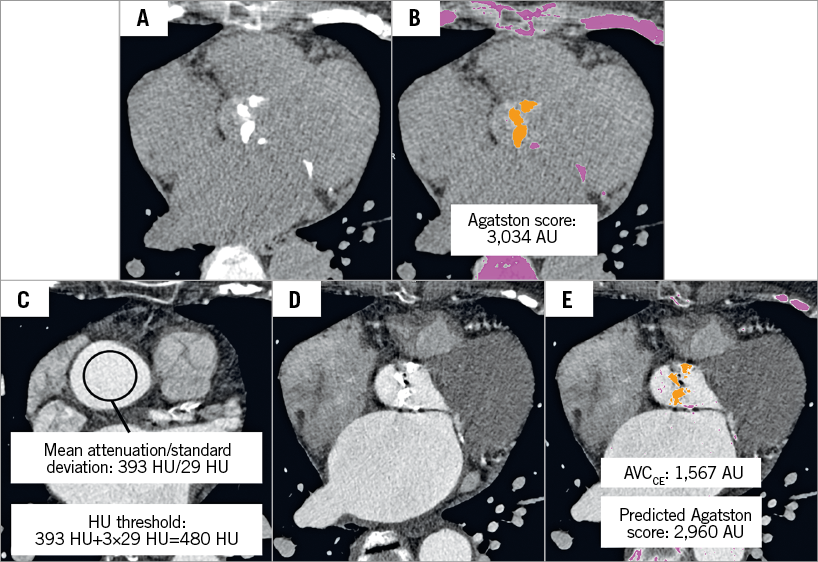
Figure 1. An 87-year-old female referred for pre-interventional CT assessment for sizing of the aortic prosthesis. A) Non-enhanced axial CT scan showed aortic valve calcification. B) Semi-automatic detection of aortic valve calcification with attenuation threshold of ≥130 HU for non-enhanced CT scans. C) Manual placement of a region of interest in the ascending aorta near the sinotubular junction to derive the mean attenuation of the aortic root to calculate the HU threshold for segmenting aortic valve calcification in a contrast-enhanced CT scan. D) Contrast-enhanced CT scan showed aortic valve calcification at the same level as panel A. E) Semi-automatic detection of aortic valve calcification with a calculated HU threshold of 480 HU according to the attenuation of the ascending aorta. For calculation of the Agatston score, the formula: ![]() was applied. AVCCE: aortic valve calcification quantified on contrast-enhanced CT; CT: computed tomography; HU: Hounsfield unit
was applied. AVCCE: aortic valve calcification quantified on contrast-enhanced CT; CT: computed tomography; HU: Hounsfield unit
QUANTIFICATION OF AVC ON CECT
For AVC quantification on CECT (AVCCE), the same software was used as for Agatston score assessment on NECT, but with an adapted threshold due to the contrast media attenuation in the aortic root. Contrast attenuation at the level of the sinotubular junction was measured with a circular region of interest (ROI) covering the central 2/3 of the vessel lumen, thereby avoiding partial volume effects from adjacent structures. The average attenuation (HUAV) and the standard deviation of attenuation (HUSD) in the ROI were recorded. Then, the threshold for the Agatston scoring method was adapted to account for the higher attenuation in the vessels in CECT scans as follows: HUAV+3×HUSD. This new threshold was chosen based on our experience indicating that the extent of segmentation of AVCCE, which is marked with colours by the software, is visually comparable to the extent of calcification when being segmented on NECT scans. Subsequently, AVCCE was semi-automatically segmented and determined with the new threshold (Figure 1).
STATISTICAL ANALYSIS
Continuous variables are presented as median and interquartile range (IQR) and compared between groups using the Mann-Whitney test. Categorical variables are presented as counts and percentages and compared using the chi-square test or Fisher’s exact test wherever appropriate. Correlations between continuous variables were evaluated using Pearson’s correlation coefficient.
A linear regression model was applied to derive a formula for quantification of the Agatston score on contrast-enhanced CT in the training cohort. In the linear regression model, we used the third root of AVC due to the volumetric nature of calcification and to achieve homoscedasticity. The newly developed formula was subsequently tested in the validation cohort. Reliability of the Agatston score and calculated Agatston score was evaluated by the intra-class correlation coefficient (ICC) using the absolute agreement definition and Bland-Altman plots. A threshold of 1,651 HU for indicating severe aortic stenosis was used as previously shown2. Agreement between the categorised Agatston score from NECT, using this threshold, and the categorised Agatston score from CECT using the newly developed formula, using the same threshold, was assessed using Cohen’s kappa coefficient. Correlation of the absolute difference of the Agatston score and calculated Agatston score with tube voltage was assessed using Spearman’s rho.
A two-tailed p-value <0.05 was considered significant. All analyses were performed using SPSS, Version 22 (IBM Corp., Armonk, NY, USA).
Results
PATIENT POPULATION
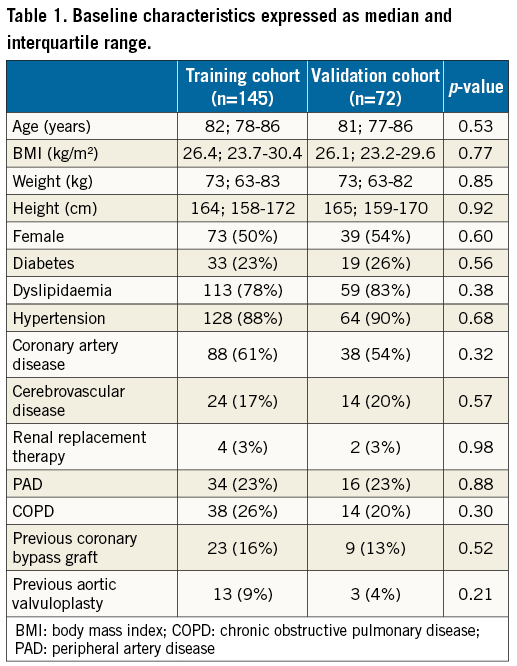
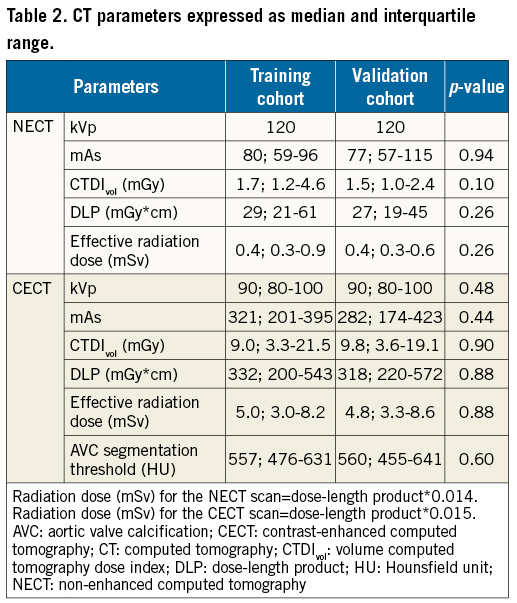
One-hundred and forty-five patients were included in the training cohort, and 72 patients were included in the validation cohort. No significant differences were present between the training and validation cohorts regarding patient baseline characteristics, cardiovascular risk factors and comorbidities (Table 1), for the CT protocol settings and radiation dose parameters (Table 2).
CORRELATION OF AVC IN NECT AND CECT
Patients in the training cohort had a median Agatston score of 2,454 (IQR: 1,511-3,636), derived from NECT, and a median AVCCE of 1,163 (IQR: 772-1,916), derived from CECT. Correlation between the Agatston score and AVCCE in the training cohort was excellent (r=0.907, p<0.001) (Figure 2).
PREDICTION OF THE AGATSTON SCORE IN THE TRAINING COHORT
Using a linear regression model (adjusted R2=0.855, p<0.001), we calculated a formula enabling the prediction of the Agatston score using CECT scans. The formula for calculating the Agatston score on CECT in the training cohort was derived from the line of best fit (calculated Agatston score=![]() , shown in Figure 2. Using this formula, we calculated the Agatston score on CECT scans in the training cohort (median 2,308, IQR 1,651-3,508), which showed an excellent agreement with the Agatston score derived from NECT in the same patients (ICC: 0.907 [p<0.001]; 95% CI: 0.873-0.932).
, shown in Figure 2. Using this formula, we calculated the Agatston score on CECT scans in the training cohort (median 2,308, IQR 1,651-3,508), which showed an excellent agreement with the Agatston score derived from NECT in the same patients (ICC: 0.907 [p<0.001]; 95% CI: 0.873-0.932).
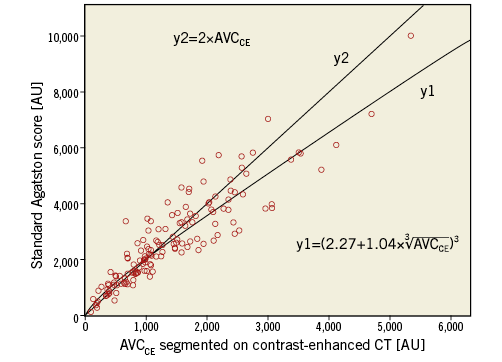
Figure 2. Correlation of AVCCE segmented on contrast-enhanced CT and standard Agatston score segmented on non-enhanced CT with the addition of a line of best fit with the equation derived from linear regression (y1) to calculate the Agatston score with the use of contrast-enhanced CT. A second line was added with a less complicated equation (y2) to represent a rule of thumb to calculate the Agatston score.
CALCULATION OF THE AVC ON CECT IN THE VALIDATION COHORT
The formula to calculate the Agatston score (calculated Agatston score=![]() derived from the training cohort was used to calculate the Agatston score of the aortic valve from CECT scans in the validation cohort. The calculated Agatston score from CECT (median 2,339, IQR 1,609-3,643) showed an excellent agreement (ICC: 0.897 [p<0.001]; 95% CI: 0.840-0.934) with the standard Agatston score from NECT (median 2,455, IQR 1,503-3,611). Bland-Altman analysis comparing the standard and calculated Agatston scores in the validation cohort showed no significant proportional bias (p=0.60) but a tendency towards better agreement at lower Agatston scores (Figure 3).
derived from the training cohort was used to calculate the Agatston score of the aortic valve from CECT scans in the validation cohort. The calculated Agatston score from CECT (median 2,339, IQR 1,609-3,643) showed an excellent agreement (ICC: 0.897 [p<0.001]; 95% CI: 0.840-0.934) with the standard Agatston score from NECT (median 2,455, IQR 1,503-3,611). Bland-Altman analysis comparing the standard and calculated Agatston scores in the validation cohort showed no significant proportional bias (p=0.60) but a tendency towards better agreement at lower Agatston scores (Figure 3).
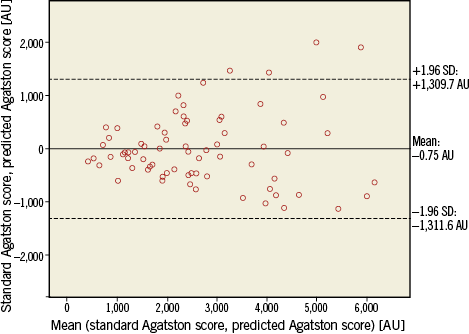
Figure 3. Bland-Altman plot comparing standard Agatston score for quantification of aortic valve calcification and calculated contrast-enhanced CT-derived Agatston score for quantification of aortic valve calcification in the validation cohort. CT: computed tomography
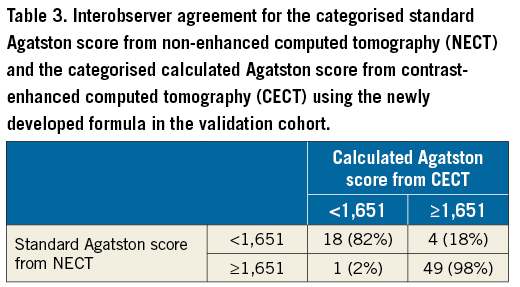
Categorisation using the threshold of 1,651 HU for predicting severe aortic stenosis2 yielded an excellent agreement between the standard and the calculated Agatston scores: kappa=0.83 (p<0.001, 95% CI: 0.69-0.97). Table 3 shows the agreement of the categorisation in 67/72 patients (93%) between the standard and the calculated Agatston score, and a disagreement in 5/72 (7%) patients: the calculated Agatston score would have overestimated the degree of AVC in four patients and would have underestimated the degree of aortic valve calcifications in one patient.
NO CHANGE OF ACCURACY WITH HIGHER TUBE VOLTAGE
There was no significant correlation between the absolute difference of the Agatston score and the calculated Agatston score with tube voltage (r=0.066, p=0.33), indicating that there was no significant influence of the automatically selected tube voltage on quantification of AVC on CECT.
RULE OF THUMB
The less complicated equation Agatston score=2×AVCCE shows good correlation with the standard Agatston score and the AVCCE (Figure 2) with a minor reduction of agreement, compared to the more complex formula shown above.
Discussion
Quantification of AVC is usually made on NECT scans. However, in some patients planned to undergo TAVI, only CECT scans, such as CT angiography studies, may be available and the extent of AVC cannot be calculated preinterventionally using conventional tools. Our study introduces formulas enabling the quantification of AVC on CECT scans with excellent agreement to the reference standard on NECT. Thus, to assess AVC, there is no need to recall patients for a separate NECT examination, which results in time saving, reduction of costs and of radiation exposure to patients. Along with a more scientific formula, we also introduce an easy to memorise rule of thumb for quantification of AVC on CECT scans in daily practice.
The argument of saving a NECT examination in patients undergoing aortic valve replacement appears weak, particularly considering the high average age of these patients (median 82 years in our study). Considering the fact that the TAVI procedure is also becoming more popular for younger patients15-17, and may represent the method of choice for aortic valve replacement in the future, the potential of saving radiation dose still appears relevant and may be even more relevant in the future.
The Agatston score, originally developed for quantifying the extent of calcifications of the coronary arteries, is usually performed with NECT scans at 120 kVp and using a threshold of 130 HU for calcium segmentation19,20. Lowering tube voltage in calcium scoring in NECT leads to higher pixel noise levels, thus calcium segmentation thresholds have to be adapted21. Tube voltage reduction in calcium scoring is therefore not routinely used. Recent advances of CT angiography protocols have resulted in significant reduction of radiation dose and the required amount of contrast media, mainly by implementing the automated attenuation-based tube voltage selection technique18,22. This algorithm was also implemented in the CECT scans of our study, resulting in tube voltages which varied from 70 to 140 kVp in both our training and our validation cohort. Besides the reduction in radiation dose, lowering of the tube potential in CT angiography provides higher attenuation for iodinated contrast media, as a result of the greater photoelectric effect and decreased Compton scattering22. In our study, agreement between Agatston score and calculated Agatston score was not affected by tube voltage setting. Our study describes a generalisable approach which can be applied to each CT angiography examination, being independent of protocol settings.
Similar to our results, recent studies indicated that the quantification of coronary artery calcification was also feasible using CECT scans, with Agatston scores correlating well with the standard Agatston score derived from NECT scans23,24. Mylonas et al24 segmented coronary calcium in CECT scans by using an individualised HU threshold of two standard deviations above the average attenuation in the ascending aorta. In our cohort, application of an individualised threshold at three standard deviations above the average HU attenuation in the aortic root was considered to represent the extent of calcium best. This difference may be due to the fact that the attenuation of blood distal to the severely stenosed aortic valve is more heterogenous due to turbulent blood flow, and that most of our CECT scans were performed at low kVp settings, leading to high attenuation of the contrast-enhanced blood because of the k-edge of iodine.
Study limitations
First, this was a retrospective single-centre study with its inherent limitations. Second, Bland-Altman analysis indicated a trend towards higher discrepancies between the standard and the calculated Agatston score at increasing AVC load. However, considering the threshold for differentiating between moderate and severe aortic stenosis (1,651 AU, as proposed by Cueff et al2) relative to the maximum Agatston score of 10,034 AU encountered in our study, this problem is a minor issue, and only 6% of our patients were falsely categorised using this threshold for predicting aortic stenosis severity. Third, as we used a CT scanner and post-processing software from only one vendor (Siemens) we do not know whether our results are generalisable to other scanners and software packages. Fourth, slice thickness and increment are known to influence coronary calcium scoring and also potentially the quantification of AVC, necessitating further research in this regard.
Conclusions
We introduced formulas enabling the accurate quantification of AVC on CECT scans, such as those routinely acquired in CT angiography examinations, and, being independent of protocol-specific settings, which yield similar results as compared to the standard Agatston score method on NECT scans. Thus, our study indicates that quantification of AVC no longer requires the acquisition of a separate NECT scan, which may save time, costs, and radiation exposure to patients.
| Impact on daily practice The present study shows that using our proposed formula or a rule of thumb, contrast-enhanced CT scan-derived quantification of aortic valve calcification can be compared to the standard Agatston method, yielding results which are similar compared to the standard Agatston method using non-enhanced CT scans. Thus, first our study indicates that quantification of aortic valve calcification no longer requires the acquisition of a separate non-enhanced CT scan, obviating the need for another CT scan and saving radiation exposure to patients, as TAVI is implemented towards a younger population. Second, quantification of aortic valve calcification can also be performed retrospectively in CT angiography studies where aortic valve calcification may be an incidental finding and no non-enhanced CT scan was scheduled. This may save costs and time in clinical practice. |
Funding
Thi Dan Linh Nguyen-Kim is funded by the research grant “Filling the gap” from the University of Zurich, Zurich, Switzerland.
Conflict of interest statement
F. Maisano is cofounder of 4Tech, a consultant for Abbott Vascular, St. Jude Medical, Medtronic, and Valtech Cardio, and receives royalties from Edwards Lifesciences. F. Nietlispach is a consultant for Edwards Lifesciences, Medtronic, and St. Jude Medical. The other authors have no conflicts of interest to declare.