Abstract
Aims: The functional impact of downstream coronary stenoses on left main coronary artery (LMCA) stenosis has not been fully elucidated. This study therefore aimed to use in vitro and in vivo experiments to assess two novel equations that predict the true fractional flow reserve (FFR) of a left main coronary artery (LMCA) stenosis with concomitant downstream stenoses.
Methods and results: Two novel equations were derived. One equation predicts the true fractional flow reserve (FFR) of an LMCA stenosis with a downstream stenosis (Equation A), and the other predicts the true FFR of an LMCA stenosis with downstream stenoses in both the left anterior descending and left circumflex arteries (Equation B). The equations were validated in both in vitro and in vivo models of the coronary circulation. The agreements between the apparent FFR (FFRapp), the predicted FFR (FFRpred) and the true FFR (FFRtrue) were assessed by Passing-Bablok regression analysis. Passing-Bablok regression analysis revealed that there were fixed proportional errors between FFRapp-m and FFRtrue-m, though a very small fixed error and no proportional errors between FFRpred-m and FFRtrue-m. The absolute differences between FFRpred and FFRtrue were significantly lower as compared to those between FFRapp and FFRtrue in all experiments.
Conclusions: Two novel equations which predict the true FFR of LMCA stenosis were demonstrated to be correct. The study also revealed that the functional impact of downstream stenoses on the LMCA stenosis became stronger when the downstream stenoses became more severe.
Background
Left main coronary artery (LMCA) stenosis is a relatively infrequent but serious finding. Coronary artery bypass grafting is recommended as the first-line treatment in the current guidelines1. A precise evaluation of the severity of LMCA stenosis is crucial, since revascularisation of a non-significant LMCA stenosis may lead to early occlusion of the grafts2 and disease progression in the grafted native artery3. The accurate assessment of FFR in an LMCA stenosis is often difficult, since LMCA stenosis is frequently accompanied by stenoses of the left anterior descending (LAD) and/or left circumflex (LCX) arteries, and the presence of these downstream stenoses inevitably affects the FFR of the LMCA stenosis. The downstream LAD/LCX stenoses impair flow across the LMCA and falsely elevate the FFR of the LMCA stenosis. The effect of downstream stenosis on the LMCA stenosis becomes greater when the downstream stenosis becomes more severe. Daniels and colleagues reported that, if an FFR ≥0.65 was measured distal to both the left main and a downstream stenosis, the FFR of the LMCA stenosis can be measured reliably in an in vitro model of coronary circulation4. The same group conducted a similar experiment in a sheep model and concluded that there is a clinically relevant effect on the assessment of the LMCA stenosis FFR only when the downstream stenosis is proximal and very severe5.
These studies provide an important guide for the management of moderate LMCA stenosis. However, the theoretical background has still not been fully elucidated and discussion continues6-8. The equation employed by previous investigators to predict the true FFR of LMCA stenosis was expressed in terms of resistance and could not be used without a flow meter4. Furthermore, the application of the equation was limited to an LMCA stenosis with a single downstream coronary stenosis4,5. However, LMCA stenosis accompanied by both LAD and LCX artery stenoses is not rare.
In this study, two novel equations which predict the true FFR of an LMCA stenosis with concomitant downstream stenoses were derived. One equation predicts the true FFR of an LMCA stenosis with a single downstream stenosis, and the other predicts the true FFR of an LMCA stenosis with downstream stenoses in both the LAD and LCX arteries. The equations were validated in both in vitro and in vivo models of the coronary circulation. The equations clarify the relationship between the main body stenosis and the downstream stenoses in an LMCA bifurcation lesion.
Derivation of the equations
DESCRIBING THE RESISTANCES USING PRESSURE DATA
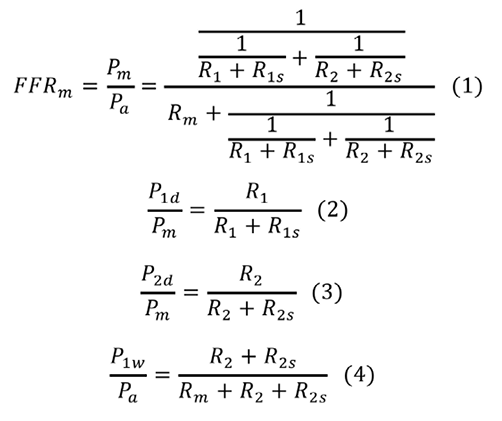
Figure 1A depicts a coronary model simulating an LMCA stenosis with concomitant downstream LAD and LCX artery stenoses. Collateral flow is excluded from the model. The pressure gradient across the stenosis is proportional to the flow, since the coronary flow conforms to the Hagen-Poiseuille law –the equivalent of Ohm’s law in an electrical circuit. The coronary model can be described using an analogous electrical circuit (Figure 1B). Artery 1 represents the LAD artery and Artery 2 represents the LCX artery in the model. The abbreviations are given in the Figure 1A legend. All the pressure data in the present study are considered as the mean pressure obtained under maximum hyperaemia. Myocardial FFR is calculated as follows: FFRm=Pm/Pa, FFR1=P1d/Pa, and FFR2=P2d/Pa. Composite FFR refers to the LMCA stenosis plus the downstream LAD/LCX artery stenosis4. FFR1 denotes the composite FFR of the LMCA plus the LAD artery. FFR2 denotes the composite FFR of the LMCA plus the LCX artery. n is defined as the ratio of R2 to R1. It corresponds to the LAD/LCX artery flow ratio when there are no stenoses in the LAD and LCX arteries.
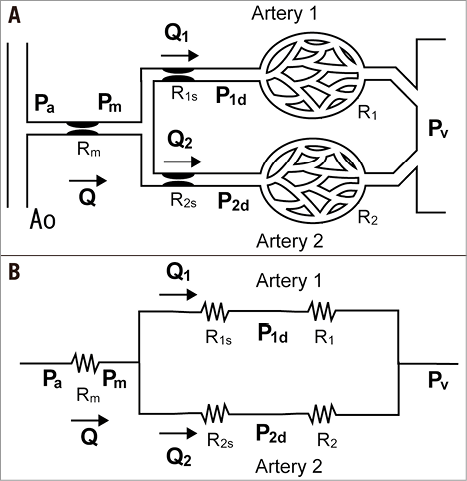
Figure 1. Schematic model and the corresponding electric circuit. A) Schematic model representing the coronary circulation with stenoses in the LMCA and downstream LAD and LCX arteries. The systemic circulation is omitted to simplify the model. Artery 1 represents the LAD artery and Artery 2 represents the LCX artery. Rm is the stenosis resistance in the LMCA, R1s is the stenosis resistance in Artery 1, and R2s is the stenosis resistance in Artery 2. R1 and R2 represent the microcirculatory resistances in Arteries 1 and 2. The following pressures are defined as follows: Pa, aortic pressure; Pm, pressure distal to Rm; P1d, pressure distal to R1s; P2d, pressure distal to R2s; Pv, central venous pressure; P1w, pressure distal to Rm when Artery 1 is temporarily occluded. Note that the definition of P1w is different from the original definition of the coronary wedge pressure12. B) The corresponding electrical circuit. All abbreviations are the same as in Figure 1A.
PREDICTING THE TRUE FFR OF AN LMCA STENOSIS WITH ONE STENOSIS IN ONE OF THE DOWNSTREAM BRANCHES
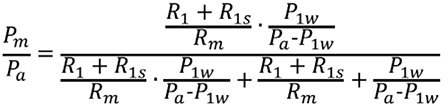
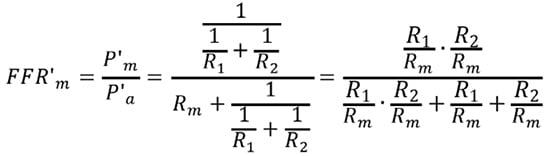
Suppose an intervention to release R1s is performed. P’a and P’m indicate the corresponding pressures after the intervention that release R1s. FFRpred-m is expressed as follows:
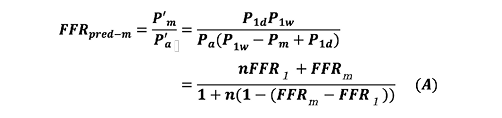
Equation A calculates the true FFR of an LMCA stenosis with a single downstream stenosis. FFRpred-m is the predicted true FFR of LMCA stenosis after the downstream stenosis in Artery 1 is released. The derivation of Equation A is described in the Appendix.
PREDICTING THE TRUE FFR OF AN LMCA STENOSIS WITH STENOSES IN BOTH DOWNSTREAM BRANCHES
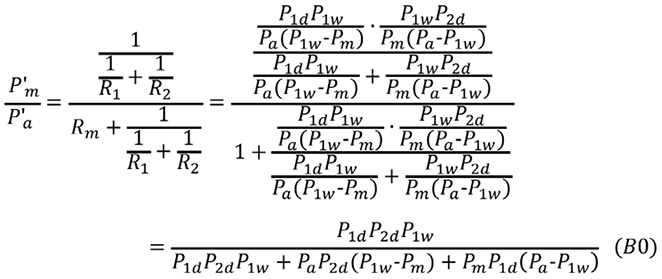
Suppose an intervention to release both R1s and R2s is performed. P”a and P”m indicate the corresponding pressures after both R1s and R2s are released. FFRpred-m is expressed as follows:
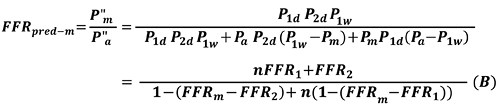
Equation B calculates the true FFR of an LMCA stenosis with downstream stenoses in both the LAD and LCX arteries. The derivation of Equation B is also described in detail in the Appendix.
In vitro experiment
EXPERIMENTAL PROTOCOL
The experimental system was similar to that described in our previous study (Figure 2)9. The correctness of Equation A and Equation B was validated in this experimental system. It consisted of a pump, systemic circulation, coronary circulation, and up to five constrictors placed in the coronary artery. The pump created a pulsatile flow at 60 beats/min. The total output of the pump was approximately 2 L/min. The pressure and flow in the coronary artery could be adjusted by a valve placed in the aorta and constrictors placed in the coronary circulation. The coronary flow was approximately 300 to 500 mL/min. Distilled water was used as the perfusate. The systemic and coronary circulations were made of silicone rubber tubes that mimic the human arterial system. The inner diameter of the coronary artery was 4 mm and the inner diameter of the aorta was 12 mm. The main artery was divided into Artery 1 and Artery 2. Artery 1 corresponded to the LAD artery and Artery 2 to the LCX artery. The constrictors were originally developed to create variable stenoses using a rotating screw. The naming of the constrictors corresponded to the names of the resistances in the mathematical model. Rm, R1s, and R2s were epicardial coronary stenoses. R1 and R2 represented microcirculatory resistance in Artery 1 and Artery 2. FFR measurements were conducted using two 0.014 inch pressure wires (St. Jude Medical, St. Paul, MN, USA), one placed in Artery 1 and the other placed in Artery 2. We conducted two experiments: Experiment 1 assessed Equation A, whereas Experiment 2 assessed Equation B.
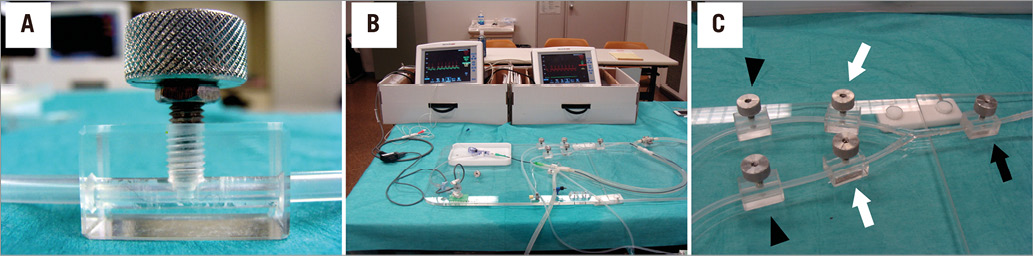
Figure 2. In vitro experimental system. A) The constrictor creating a variable degree of stenosis in the coronary artery by rotating the screw. B) The entire simulation system. The system consists of a pump, systemic and coronary circulation, and five constrictors. A 6 Fr introducer sheath is placed in the systemic circulation, and a guiding catheter is advanced proximal to the main artery through the 6 Fr sheath. Two pressure wires are placed in the coronary circulation, one in Artery 1, the other in Artery 2. C) Magnified view of the coronary circulation, simulating an LMCA stenosis (black arrow) and concomitant LAD and LCX artery stenoses (white arrows). The other two constrictors are placed in the distal parts of Artery 1 and Artery 2 to simulate microcirculatory resistance (arrowheads).
EXPERIMENT 1
Experiment 1 was conducted to validate Equation A, which predicts the true FFR of the main artery stenosis after releasing the stenosis in Artery 1, when no epicardial stenosis exists in Artery 2. Four constrictors were placed in the coronary artery. The apparent FFR value of the main artery stenosis (FFRapp-m) was defined as Pm/Pa or P2d/Pa. Note that Pm is equal to P2d in Experiment 1, since there were no stenoses in Artery 2. The predicted FFR value of the main artery stenosis (FFRpred-m) was calculated from Equation A. The true value of the main artery stenosis (FFRtrue-m) was measured after R1s was released. The severity of the coronary stenoses (Rm, R1s and R2s) and microvascular resistances (R1 and R2) was changed randomly each time. Experiment 1 was conducted 50 times to obtain 50 different data sets.
EXPERIMENT 2
Experiment 2 was conducted to validate Equation B, which predicts the true FFR of the main artery stenosis after the stenoses in both Artery 1 and Artery 2 are released. Five constrictors were employed in Experiment 2. FFRapp-m was defined as Pm/Pa. FFRpred-m was calculated from Equation B. FFRtrue-m was measured after both R1s and R2s were released. Experiment 2 was also conducted 50 times to obtain 50 different data sets. Various degrees of coronary stenosis with different microvascular resistances were created randomly by adjusting the five constrictors.
In vivo experiment
EXPERIMENTAL PROTOCOL
The correctness of Equations A and B was also examined using in vivo experiments. One female pig weighing 40 kg was studied in accordance with the Guide for the Care and Use of Laboratory Animals proposed by the Institute of Laboratory Animal Resources. The in vivo experimental protocol was approved by the institutional animal care and use committee at the Medical School of Kyoto University.
Anaesthesia was induced using xylazine (1 mg/kg) and ketamine (30 mg/kg) and, after intubation, anaesthesia was maintained with inhaled isofluorane 2%. One 6 Fr introducer sheath was surgically inserted into the right femoral artery and another was surgically inserted into the right femoral vein. Coronary angiography performed via the right femoral artery revealed that the LAD artery was relatively small, but the LCX artery was relatively large. The LCX artery bifurcation was used in the present study. The LCX artery main branch was the substitute for the LAD, and the LCX artery side branch was the substitute for the LCX artery. The difference between the LMCA bifurcation and the LCX artery bifurcation is the main branch/side branch flow ratio. The functional relationship between the main branch stenosis and downstream stenoses is essentially the same as that between the LMCA bifurcation and the LCX artery bifurcation. Three vascular occluders (Intermedics Co., Kyoto, Japan) were deployed to create variable degrees of coronary stenosis: one was placed in the LCX main artery proximal to the bifurcation, one in the LCX main artery distal to the bifurcation, and the other in the LCX artery side branch. FFR measurements were conducted during maximal hyperaemia induced by continuous administration of adenosine via the right femoral vein (140 μg/kg/min). We conducted two in vivo experiments: Experiment 3 assessed Equation A, whereas Experiment 4 assessed Equation B. The experimental system and procedure are described in Figure 3.
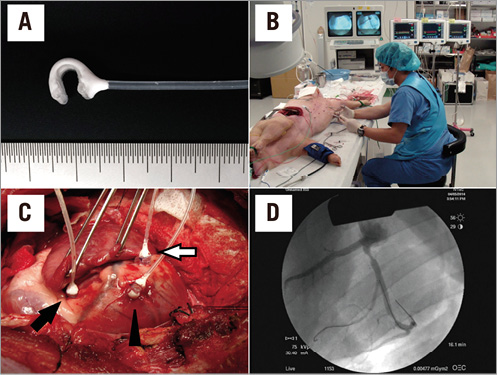
Figure 3. In vivo experimental system. A) The vascular occluder employed in the study. A variable degree of coronary stenosis is achieved by inflating the cuff attached to the occluder. B) The entire experimental system. Three pressure wire systems were employed. C) The swine heart. Three vascular occluders are placed in the LCX artery, one in the proximal main artery (black arrow), one in the distal main artery (white arrow) and the other in the obtuse marginal branch (arrowhead) in the LCX artery. D) Angiographic image. Three different degrees of coronary stenosis are induced by the vascular occluders.
EXPERIMENT 3
Experiment 3 was conducted to validate Equation A. The experimental procedure was similar to that of Experiment 1. Two vascular occluders were placed in the LCX artery bifurcation, one in the LCX main artery proximal to the bifurcation, the other in the LCX main artery distal to the bifurcation. FFRapp-m and FFRpred-m were calculated from Equation A based on the pressure data obtained before releasing R1s. FFRtrue-m was obtained from the pressure data after releasing R1s. Experiment 3 was conducted 50 times to obtain 50 different data sets. The severity of the epicardial stenoses was changed randomly each time.
EXPERIMENT 4
Experiment 4 was conducted to validate Equation B. The experimental procedure was very similar to that of Experiment 2. Three vascular occluders were used in Experiment 4 to mimic LMCA stenosis plus downstream coronary stenoses in both the LAD and LCX arteries. FFRapp-m and FFRpred-m were calculated from Equation B. FFRtrue-m was measured after releasing both R1s and R2s. Experiment 4 was also conducted 50 times to obtain 50 different data sets. Various degrees of coronary stenosis were created randomly by adjusting the three vascular occluders.
Statistics
The absolute difference between FFRapp-m and FFRtrue-m was compared with the absolute difference between FFRpred-m and FFRtrue-m using a paired t-test. The agreements between FFRapp-m, FFRpred-m and FFRtrue-m were assessed using Passing-Bablok regression and Bland-Altman analysis. Passing-Bablok regression calculated the slope and intercept with their 95% confidence interval (CI). These confidence intervals were used to assess fixed and proportional error. If 95% CI for intercept includes zero, there is no fixed error. Similarly, if 95% CI for slope includes value one, there is no proportional bias. In a Bland-Altman plot, the difference between the measurements was plotted against the mean. The Bland-Altman analysis was also used to assess fixed and proportional error. If 95% CI for the average difference includes zero, there is no fixed error. If 95% CI for regression slope includes zero, there is no proportional bias. All continuous variables were presented as mean±standard deviation, unless otherwise stated. A two-sided p-value <0.05 was considered statistically significant.
Results
Fifty different combinations of the main artery and one or two downstream stenoses were created randomly in each experiment. FFRtrue-m were 0.66±0.17, 0.68±0.15, 0.77±0.13, and 0.70±0.12 in Experiment 1 to 4, respectively. First, the impact of downstream stenoses on the LMCA stenosis assessment was analysed by comparing the difference of FFRapp-m and FFRtrue-m with FFR1 (Experiments 1-4), as well as by comparing the difference of FFRapp-m and FFRtrue-m with FFR2 (Experiments 2 and 4). In all analyses, the smaller FFR1 or FFR2 became, the larger the difference between FFRapp-m and FFRtrue-m became (Figure 4).
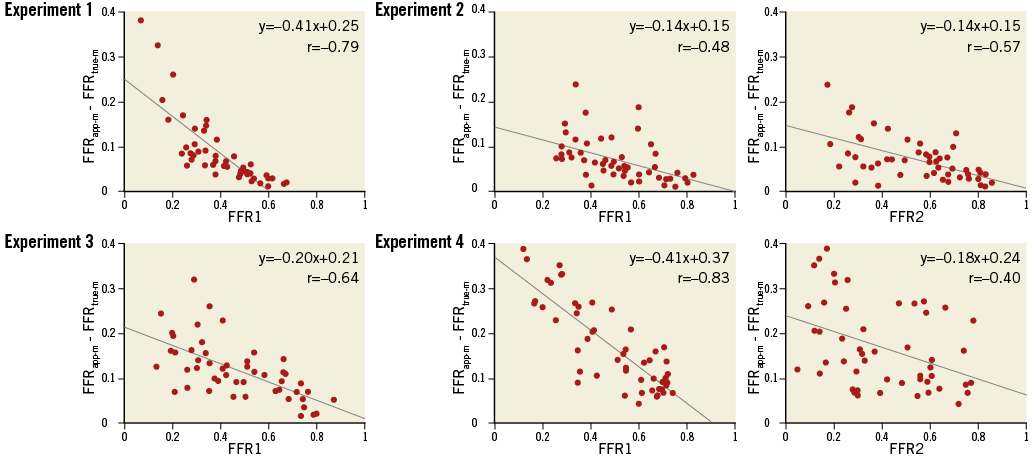
Figure 4. Plots of the difference between FFRapp-m and FFRtrue-m against composite FFR. In all analyses, the difference between FFRapp-m and FFRtrue-m is negatively correlated with the composite FFR in the linear regression analysis.
The experimental results of Passing-Bablok regression and Bland-Altman analyses are presented in Figure 5 and Table 1. Passing-Bablok regression analysis revealed that there were fixed proportional errors between FFRapp-m and FFRtrue-m in all experiments. Bland-Altman analysis also revealed that the difference between FFRapp-m and FFRtrue-m was always significantly larger than zero and the regression slope was always smaller than zero. The analysis indicated that FFRapp-m was always larger than FFRtrue-m, and the difference became larger when the mean of FFRtrue-m and FFRapp-m became smaller. Meanwhile, Passing-Bablok regression analysis showed a very small fixed error in Experiments 1 to 4, while there were no proportional errors in Experiments 1 to 4. Bland-Altman analysis also showed that the difference between FFRpred-m and FFRtrue-m was slightly smaller than zero in Experiments 1 and 2, and was larger than zero in Experiments 3 and 4. The regression slopes in Bland-Altman plots when comparing FFRpred-m and FFRtrue-m were not significantly different from zero in all experiments, which indicated that there were no significant proportional errors between FFRpred-m and FFRtrue-m.
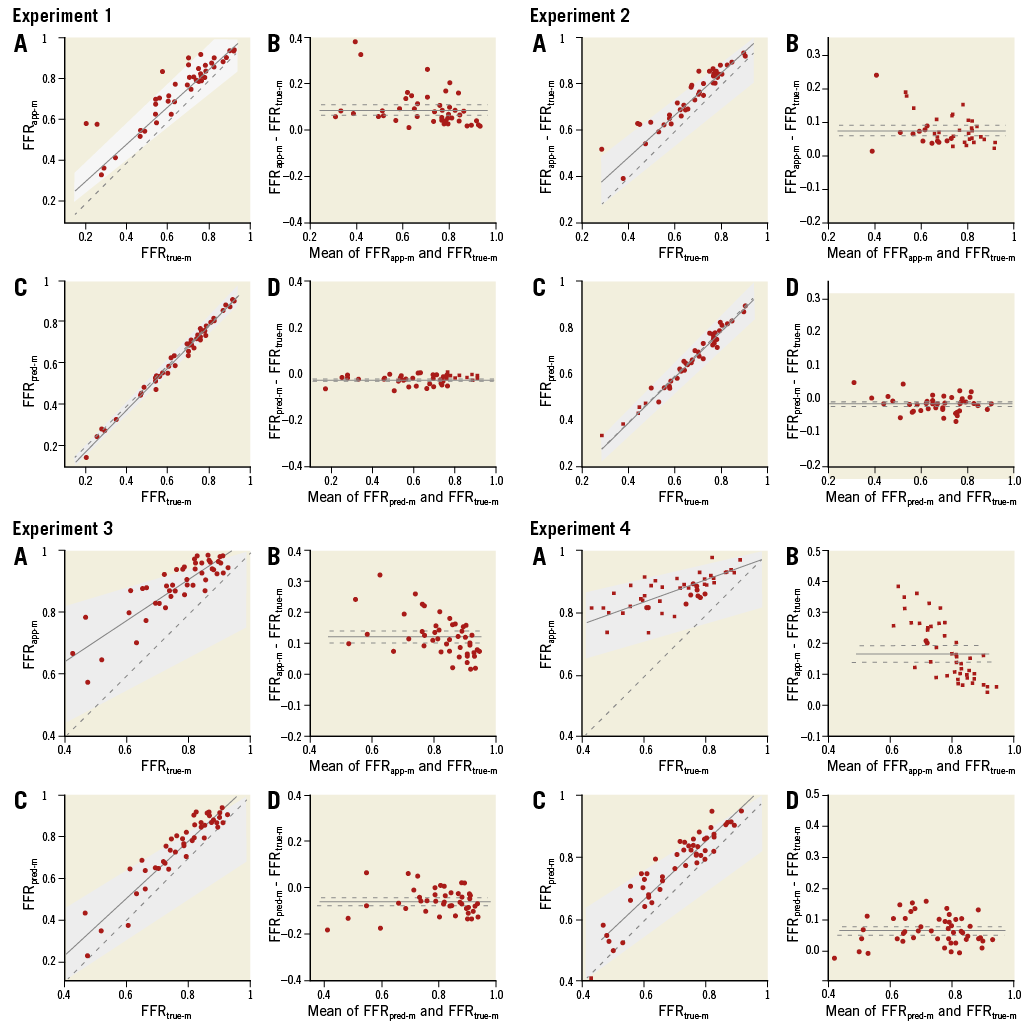
Figure 5. Passing-Bablok regressions and Bland-Altman plots of Experiments 1 to 4. A) FFRapp-m compared with FFRtrue-m by Passing-Bablok regression (solid line) with 95% CI (grey zone). B) Corresponding Bland-Altman plot. The solid line denotes the mean of the difference and the dashed line denotes the 95% CI. C) FFTpred-m compared with FFRtrue-m. D) Corresponding Bland-Altman plot.
The absolute difference between FFRapp-m and FFRtrue-m was significantly larger than the absolute difference between FFRpred-m and FFRtrue-m in all experiments (Figure 6). These analyses indicated that the agreements between FFRpred-m and FFRtrue-m were better than those between FFRapp-m and FFRtrue-m in all experiments.
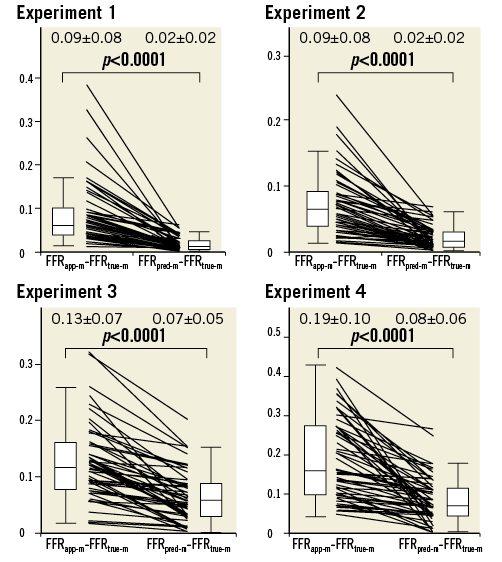
Figure 6. The absolute difference between FFRapp-m and FFRtrue-m compared with the absolute difference between FFRpred-m and FFRtrue-m in Experiments 1 to 4. The absolute difference between FFRapp-m and FFRtrue-m was significantly greater than the absolute difference between FFRpred-m and FFRtrue-m in all experiments.
Discussion
Downstream stenosis affects the FFR of the LMCA stenosis. The more severe the downstream stenosis is, the larger the impact of downstream stenosis is. Two novel equations were derived to predict the true FFR of the LMCA stenosis in case of one downstream stenosis (Equation A) or two downstream stenoses (Equation B). Both Equation A and Equation B were proved to be accurate in predicting the true FFR of the LMCA stenosis.
A previous in vitro study reported that, when the composite FFR of the LMCA and a single downstream stenosis is >0.65, the apparent FFR of the LMCA stenosis does not differ greatly from its true value4. The same group conducted a similar experiment and concluded that, when the apparent FFR of the LMCA is >0.80 and epicardial FFR (combined FFR of the LMCA and a downstream stenosed vessel) is >0.50, the true FFR of the LMCA stenosis is always >0.755. We consider that the theoretical backgrounds of these study results were not fully elucidated. These results are completely explained mathematically by Equation A. The mathematical proof is fully described in the Appendix. FFRpred-m is monotonically increasing in FFR1, FFRm and n. Thus, when FFR1 is <0.65 and FFRm is >0.80, FFRpred-m can become <0.75. This consideration suggests that the cut-off line for the apparent LMCA FFR of 0.80 will potentially cause a false negative misinterpretation of the functional severity of an LMCA stenosis when downstream stenosis is severe. However, when the cut-off line is set to 0.85, FFRpred-m never becomes <0.75 when FFR1 is >0.50. Thus, we propose that the apparent LMCA FFR between 0.80 and 0.85 is in a grey zone when a downstream LAD/LCX stenosis exists. When the apparent FFR of the LMCA stenosis is in the grey zone, the true FFR of the LMCA stenosis should be assessed after treating the downstream stenosis. Another option to determine the true functional severity of the LMCA stenosis is to apply Equation A to predict the true FFR. However, Equation A is not practical since it requires coronary occlusion to obtain “n” in the present form. Thus, we propose applying the assumption of the LAD/LCX flow ratio as 2:1, then Equation A becomes as follows.
![]()
Equation A’ can be applied without occluding the coronary artery. The mathematical proof of all these considerations is given in the Appendix.
Similar considerations apply in Equation B, which is a more general form of Equation A. Equation B predicts the true FFR of an LMCA stenosis with both LAD and LCX artery stenoses. An LMCA stenosis accompanied by both LAD and LCX artery stenoses is not rare in daily clinical practice10,11. An FFR of >0.85 would almost certainly indicate that the LMCA stenosis is not functionally significant, despite the presence of downstream LAD/LCX artery stenoses. When the composite FFR of the LMCA plus epicardial stenoses in the LAD and LCX arteries are both >0.65 and the apparent FFR of the LMCA stenosis is >0.80, the true FFR value of the LMCA stenosis calculated from Equation B is >0.75. An apparent FFR of an LMCA stenosis between 0.80 and 0.85 is in a grey zone when either downstream LAD or LCX stenosis is <0.65. When the apparent FFR of an LMCA stenosis is in the grey zone, the true FFR of the LMCA stenosis should be assessed after treating both the LAD and LCX downstream stenoses, or the following Equation B’, which is obtained on the assumption that LAD/LCX flow ratio is 2:1, should be applied. The mathematical proof of all these considerations is given in the Appendix.
![]()
Limitations
The present study had several important limitations. First, the in vitro model of coronary circulation was different from the complex human coronary circulation in many ways. In the present study, distilled water was used as the perfusate. The viscosity of water is lower than that of blood, which might have influenced the study results. Most importantly, the experimental system lacked any collateral circulation, which certainly exists in humans. However, the legitimacy of the equation was also proven by the in vivo experiments which included collateral circulation. Second, a stenosis is not uniform as in the experiment, and the locations of stenoses are sometimes close to each other. If the LAD and LCX stenoses are both very proximal and the LMCA stenosis is very distal, it is very hard to obtain FFRm. In this scenario, it is not possible to calculate FFRpred. Third, the LCX artery bifurcation was employed as a substitute for the LMCA bifurcation in the in vivo experiments. The blood flow ratio between the main branch and side branch of the LCX artery bifurcation was different from that of the LMCA bifurcation. However, the difference between the LCX artery bifurcation and the LMCA bifurcation is only the blood flow ratio of the downstream artery. Equations A and B are applicable not only to the LMCA bifurcation, but to any bifurcation. Fourth, one may consider that the equations in the present study are not practical, since Equations A and B in the present study require temporary coronary occlusion of the downstream artery to measure P1w. However, with the assumption of an LAD/LCX artery flow ratio of 2:1, Equations A and B can be applied in clinical practice. More importantly, a better understanding of the background theory helps to improve the performance of daily practice. Finally, the present study included severe LMCA lesions with an FFR <0.50, which usually do not require FFR assessment in clinical practice. The study aimed to assess the legitimacy of Equations A and B in many settings and the study results showed that both Equation A and Equation B strongly predict the true FFR of the LMCA stenosis, even when the LMCA stenosis is very severe.
Conclusions
Novel equations to predict the true FFR of an LMCA stenosis in the presence of concomitant downstream LAD/LCX artery stenoses were derived mathematically. These equations were validated in an in vitro model of coronary circulation. The functional impact of downstream LAD/LCX stenoses became greater when the downstream stenoses became more severe. We propose that an apparent LMCA FFR between 0.80 and 0.85 is in a grey zone when downstream LAD/LCX stenoses exist and are severe.
| Impact on daily practice FFR is an important tool to guide the decision for revascularisation of an intermediate LMCA stenosis. However, the functional impact of downstream coronary stenoses on the LMCA stenosis has not been fully elucidated. The two novel equations described in the present paper revealed that 1) the more severe the downstream stenosis, the larger the functional impact of downstream stenosis, and 2) an apparent LMCA FFR between 0.80 and 0.85 is in a grey zone when downstream LAD/LCX stenoses exist and are severe. |
Acknowledgements
The authors would like to thank Ms Sumiko Horie, Mr Katsuhiko Morita, Mr Fumito Kimura and Mr Yasuo Hara for their advice regarding the experiments. Special thanks also go to Ms Rika Sugiura, Ms Yoko Shimizu and Ms Kotoko Omishi for their secretarial support.
Conflict of interest statement
The authors have no conflicts of interest to declare.
Appendix. Derivation of Equations A and B
First, the derivations of Equations A and B are presented. Then the minimum values of the true FFR of LMCA stenoses are calculated in some specific settings.
The terminology is consistent with the main text and Figure 1. Consider a model of coronary circulation simulating an LMCA stenosis with downstream LAD and LCX artery stenoses (Figure 1). Collateral flow is excluded from the model in the present study. Artery 1 represents the LAD artery and Artery 2 represents the LCX artery in the model. The LMCA is denoted as the main artery. The abbreviations are defined as follows: Rm=stenosis resistance in the main artery, R1s=stenosis resistance in Artery 1, R2s=stenosis resistance in Artery 2, R1=microcirculatory resistance in Artery 1, R2=microcirculatory resistance in Artery 2, Pa=aortic pressure, Pm=pressure distal to Rm, P1d=pressure distal to R1s, P2d=pressure distal to R2s, P1w=pressure distal to Rm when Artery 1 is totally occluded, Pv=central venous pressure, Q=total coronary flow, Q1=coronary flow in Artery 1, Q2=coronary flow in Artery 2. Pv approximates to zero in the model. All the pressure data employed in the present study refer to the mean pressure obtained under maximum hyperaemia. One should note that the definition of P1w is different from the original article. The pressure gradient across the stenosis is proportional to the flow, which is assumed to be Hagen-Poiseuille flow in the model. The concept of a voltage divider can be applied by analogy to fluids. Myocardial FFR is calculated as follows: FFRm=Pm/Pa, FFR1=P1d/Pa, and FFR2=P2d/Pa. Composite FFR is defined as the LMCA stenosis plus the downstream LAD/LCX artery stenosis. FFR1 indicates the composite FFR of the LMCA plus the LAD artery, whereas FFR2 indicates the composite FFR of the LMCA plus the LCX artery. FFRm, FFR1, and FFR2 can be described in terms of resistance, as presented previously4.
P1w is measured at the point just distal to Rm when Artery 1 is totally occluded. Artery 1 P1w needs to be adjusted according to the change in Pa.
Calculation of resistance using the pressure
R1s/Rm, R1/Rm, R2s/Rm, and R2/Rm can be expressed using the pressure by solving Equations 1 to 4, as follows.
First, transform Equation 4 as follows:
![]()
Substituting Equation 4’ into Equation 3 gives,
![]()
or
![]()
Substituting into Equation 4’ we have
![]()
or
![]()
Equation 1 is transformed as follows:
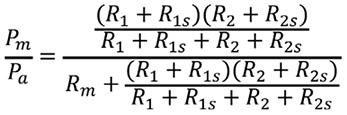
or
![]()
Substituting Equation 4’ into Equation 1’ gives:
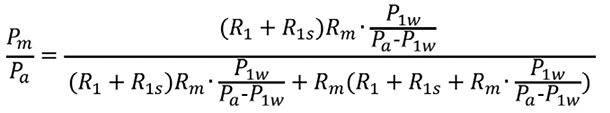
or
or
![]()
FFR1 is expressed as follows:
![]()
Substituting Equation 1’ and Equation 2 into the above formula gives:
Substituting Equation 4’ into the above formula gives:
or
![]()
Substituting Equation 1” into the above formula, we get
![]()
or
![]()
Substituting this equation into Equation 1”:
![]()
All the resistances, including R1s, R1, R2s, and R2, are now expressed as a fraction of Rm, as follows:
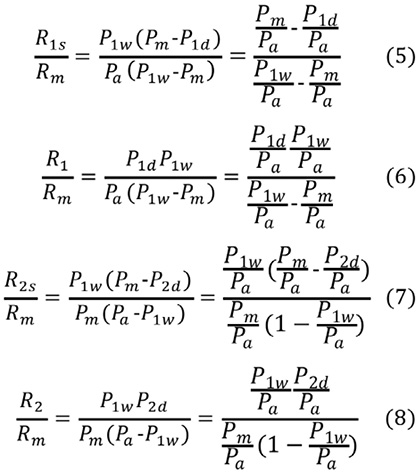
When n is defined as the ratio of R2 to R1, n corresponds to the Artery 1/Artery 2 flow ratio.
![]()
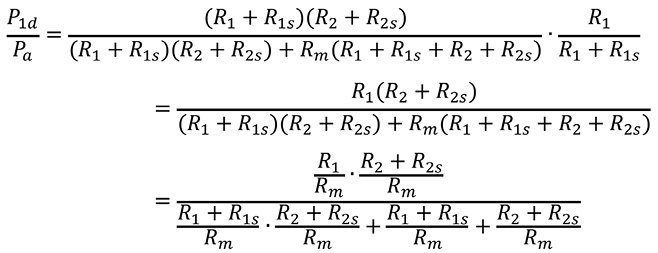
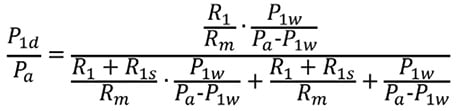
Derivation of Equation A
Equation A calculates the true FFR of a main artery stenosis with a concomitant downstream stenosis in Artery 1. When there are no stenoses in Artery 2, P2d=Pm. Suppose an intervention is conducted in R1s and R1s is completely released. P’a, P’m, and P’1d indicate the corresponding pressures after the intervention. One should note that P’m=P’1d when R1s is released. FFR’m=P’m/P’a and FFR’1=P’1d/P’a are the corresponding FFR after releasing R1s. FFR’m is equal to FFR’1 after releasing R1s.
Under these conditions, using the resistance data, FFR’m is expressed as follows:
Substitute Equations 6 and 8 into the above equation:
Pm=P2d is applied to Equation 9, and transformed:
![]()
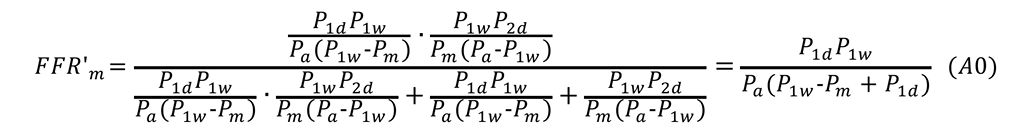
Putting Equation 9’ into Equation A0 gives Equation A:
![]()
Derivation of Equation B
P”a, P”m, P”1d, and P”2d indicate the corresponding pressures after both R1s and R2s are released. R1s=0, R2s=0, and P”a=P”1d =P”2d are all true under these conditions. FFR”m is expressed in terms of the pressure in the following form:
Equation 9 is transformed:
![]()
Substituting Equation 9” into Equation B0 gives Equation B:
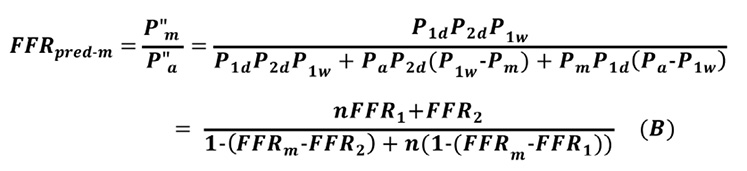
Note that, when FFR2=FFRm, Equation B is the same as Equation A.
The predicted FFR of an LMCA stenosis with a downstream LAD artery stenosis under various conditions
The predicted FFR of an LMCA stenosis with a downstream stenosis is calculated from Equation A.
![]()
The partial derivative of FFRpred-m with respect to FFR1 and its range are calculated as:
![]()
The above inequality shows that FFRpred-m increases with FFR1.The partial derivatives of FFRpred-m with respect to FFRm and n are also calculated as:
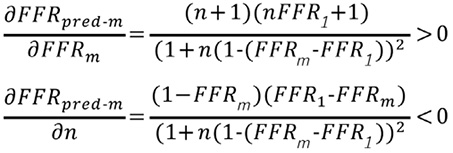
Thus, FFRpred-m increases with FFR1 and FFRm, but decreases with an increase in n.
When FFR1 is >0.50 and FFRm is >0.85, the following inequality is obtained from Equation A:
![]()
Note that, FFRpred-m=0.77, when FFR1=0.50, FFRm=0.85 and n=∞.
Thus, when the apparent FFR of LMCA is >0.85 and the composite FFR is >0.50, the predicted FFR of an LMCA stenosis with a downstream stenosis is always >0.77. This is true independently of the LAD/LCX artery flow ratio.
When FFR1 is >0.50 and FFRm is >0.80, the following inequality is obtained from Equation A:
![]()
The predicted FFR of an LMCA stenosis can be <0.75. The cut-off line of the apparent LMCA FFR of 0.80 could potentially cause a false-negative misinterpretation of the functional severity of the LMCA stenosis. However, when the LAD/LCX artery flow rate is two, the following inequality is obtained:
![]()
The predicted FFR of an LMCA stenosis with a downstream stenosis is always >0.75 when the LAD/LCX artery blood flow is two, FFRm >0.85, and FFR1 >0.50. This is the mathematical proof of previously published study results4,5.
The predicted FFR of an LMCA stenosis with downstream stenoses in both LAD and LCX arteries
Equation B predicts the true FFR of an LMCA stenosis with downstream stenoses in both the LAD and LCX arteries.
![]()
Similar calculations are also made. The partial derivatives of FFRpred-m with respect to FFR1, FFR2, FFRm, and n are calculated:
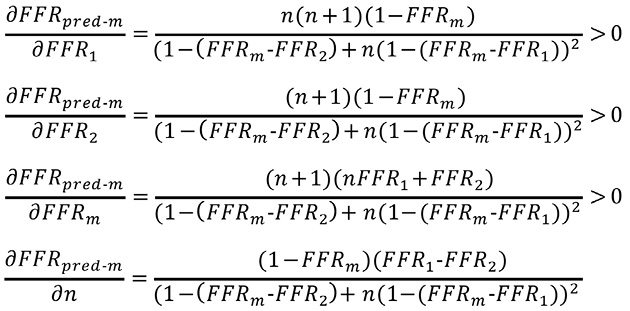
FFRpred-m increases with FFR1, FFR2, and FFRm. When FFR1 is >FFR2, FFRpred-m increases with n, but when FFR1 is
![]()
Note that, when FFR1=0.50, FFR2=0.50 and FFRm=0.85, FFRpred-m=0.77, which is independent of the value of n.
When the composite FFR of the LMCA plus epicardial stenoses in the LAD and LCX arteries are both >0.50 and the apparent FFR of the LMCA stenosis is >0.85, the true FFR value of the LMCA stenosis calculated from Equation B is always >0.75, independently of the LAD/LCX artery flow ratio.
Derivation of Equation A’ and B’
One may consider that the equations in the present study are not practical, since Equations A and B in the present study require temporary coronary occlusion of the downstream artery to measure P1w. However, with the assumption of an LAD/LCX artery flow ratio of 2:1, Equations A and B can be applied in clinical practice. Equations A and B become as follows when n=2 is applied.
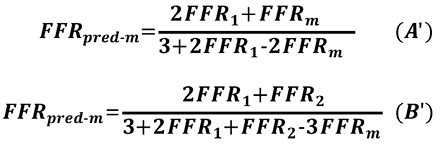
Equations A’ and B’ can be applicable without measuring Pw. Needless to say, the true applicability of these equations should be assessed in a future clinical study.