Abstract
Background: Atrial fibrillation (AF) associated with postoperative pericardial effusion is the most commonly reported adverse event after cardiac surgery.
Aims: We aimed to determine the role of posterior pericardiotomy in preventing postoperative AF (POAF).
Methods: We searched PubMed, Scopus, Web of Science, Ovid, and EBSCO from inception until 30 June 2022. We included randomised clinical trials (RCTs) that compared posterior pericardiotomy (PP) versus control (no PP) in patients undergoing cardiac surgery. The primary endpoint was the incidence of POAF after cardiac surgery. The secondary endpoints were supraventricular arrhythmias, early/late pericardial effusion, pericardial tamponade, pleural effusion, length of hospital/intensive care unit stay, intra-aortic balloon pump use, revision surgery for bleeding, and mortality.
Results: Twenty-five RCTs comprising 4,467 patients were included in this systematic review and meta-analysis. The overall incidence rate of POAF was 11.7% in the PP group compared with 23.67% in the no PP or control group, with a significant decrease in the risk of POAF following PP (odds ratio [OR] 0.49, 95% confidence interval [CI]: 0.38-0.61). Compared with the control group, the risk of supraventricular tachycardia (OR 0.66, 95% CI: 0.43-0.89), early pericardial effusion (OR 0.32, 95% CI: 0.22-0.46), late pericardial effusion (OR 0.15, 95% CI: 0.09-0.25), and pericardiac tamponade (OR 0.18, 95% CI: 0.10-0.33) were lower in the PP group.
Conclusions: PP is an effective intervention for reducing the risk of POAF after cardiac surgery. Also, PP is economically efficient in terms of decreasing the length of hospital stay.
Introduction
Following cardiac surgery, atrial fibrillation (AF) is the most commonly reported arrhythmia. The incidence of AF after cardiac surgery affects between 10% and 65% of patients and is more prominent on the second or third postoperative day1. Postoperative AF (POAF) has increased morbidity rates, haemodynamic instability, prolonged hospital stays, and healthcare costs12.
The pathophysiology behind AF post-cardiac surgery is multi-faceted, and multiple aetiologies have been identified. These include catecholamine surge, atrial stretch, metabolic abnormalities, electrolyte imbalance, inflammatory response, and postoperative pericardial effusion (PPE)23.
Prophylactic beta blockers have been shown to control the catecholamine surge in the perioperative period, demonstrating a significant decrease in the rate of postoperative AF14. Another proposed aetiology is the presence of PPE. Earlier reports have shown a high incidence of PPE following cardiac surgery in up to 64% of patients5, with a decreasing rate over time that went as low as 1.5%6.
As PPE has been shown to be associated with an increased incidence of postoperative AF, the drainage of pericardial blood or effusion will consequently decrease the incidence of the associated AF. In a retrospective study by Kuvin et al7, 49% of pericardial effusions were posterior and 46% were diffuse. Thus, multiple studies have proposed a method for decreasing the incidence of PPE by making an incision in the posterior pericardium and opening it to the left pleura. This eases the drainage of pericardial fluid and prevents the occurrence of PPE, thus lowering the incidence of AF289.
Multiple randomised controlled trials have tested the efficacy of performing a posterior pericardiotomy (PP) after cardiac surgery as a prophylactic measure to prevent postoperative AF (POAF). There are conflicting results on the ability of PP to reduce the incidence of AF after coronary artery bypass graft (CABG): several studies have found that PP did not reduce the incidence of AF after CABG21011, whereas other studies and three meta-analyses have shown that PP significantly reduced the incidence of AF after CABG81213. However, the most recent meta-analysis had only three high-quality trials and many uncontrolled confounders that may have affected their results13.
So, in our study, we are trying to resolve this controversy by including more high-quality trials and stratifications of as many confounding variables as possible in order to evaluate the role of posterior pericardiotomy in preventing postoperative AF.
Methods
We followed the Preferred Reporting Items for Systematic Reviews and Meta-Analysis (PRISMA) statement guidelines when performing this systematic review and meta-analysis14. The methods were carried out in accordance with the Cochrane Handbook of Systematic Reviews and Meta-analysis of Interventions (version 5.1.0).
Eligibility criteria
Randomised controlled trials (RCTs) of patients undergoing cardiac surgery who were randomly assigned to PP (intervention group) compared to conventional procedures (no PP: control group) were selected for this systematic review and meta-analysis. Definitions of PP and non-PP procedures are illustrated in Supplementary Table 1 and Supplementary Table 2. We excluded non-English, observational and animal studies, as well as conference abstracts.
Primary and secondary outcomes
The primary outcome of interest was the incidence of atrial fibrillation, while the secondary outcomes of interest were pleural effusion, length of hospital stay, early pericardial effusion, late pericardial effusion, pericardial tamponade, length of intensive care unit (ICU) stay, pulmonary complications, revision surgery for bleeding, intra-aortic balloon pump (IABP) use, and postoperative mortality. These outcomes were defined according to the study authors’ definitions.
Literature search
We performed a comprehensive literature search on PubMed, Scopus, Web of Science, Ovid, and EBSCO from inception until 30 June 2022, using the following search terms: [“pericardiotomy” OR “posterior left pericardiotomy” OR “post pericardiotomy” OR “pericardial fenestration”] AND [“CABG” OR “coronary artery bypass grafting” OR “heart surgery” OR “cardiothoracic surgery” OR “cardiac surgery” OR “extracorporeal circulation” OR “CAB”] AND [“atrial fibrillation”]. The detailed search terms used for each database are illustrated in Supplementary Appendix 1. All duplicates were removed with EndNote (Clarivate). Manual backward and forward citation analyses were done for all the references of the included studies.
The literature search results were screened in two steps: the titles and abstracts of all articles were screened for eligibility and a subsequent full-text screening was performed for the eligible studies.
Data extraction
Data were extracted to a specified data extraction sheet. The extracted data included (1) the characteristics of the included studies, (2) characteristics of the included studies’ population, (3) risk of bias domains, and (4) outcome measures: incidence of atrial fibrillation, supraventricular tachycardia (SVT), pleural effusion, length of hospital stay, early pericardial effusion, late pericardial effusion, pericardial tamponade, length of intensive care unit (ICU) stay, pulmonary complications, revision surgery for bleeding, IABP use and postoperative mortality in patients who had undergone PP versus no PP.
Synthesis of results
In the case of studies reporting data with multiple timepoints, we considered the most consistent follow-up time for our analysis. For outcomes with dichotomous data, the frequency of events and the total number of patients in each group were pooled as odds ratios (OR) between the two groups (PP vs no PP) in the DerSimonian-Laird random-effects model. For outcomes with continuous data, mean differences (MD) and 95% confidence intervals (CI) were pooled in the DerSimonian-Laird random-effects model. All statistical analyses were done by Stata MP Version 17 for Windows (StataCorp).
Assessment of heterogeneity
The chi-square test (Cochran’s Q test) was used to assess statistical heterogeneity among studies. Then, the I2 value was calculated using the chi-square statistic, Cochran Q, according to the equation:

A p-value of chi-square of less than 0.1 was considered a significant heterogeneity. High heterogeneity was defined as an I2 value ≥50%. When there was significant heterogeneity, a sensitivity analysis using the leave-one-out model was performed to resolve this; moreover, for every outcome in the meta-analysis, we ran sensitivity analyses in multiple scenarios, excluding one study in each scenario to ensure the overall effect size was not dependent on any single study. We also used the Galbraith plot to detect for any heterogeneity across studies.
Quality assessment
Two authors independently assessed the quality of included clinical trials according to the Cochrane risk of bias 2 (ROB-2) tool for RCTs that involves the following five domains: randomisation process (selection bias), deviation from intended interventions (performance bias), outcome measurement (detection bias), missing outcome data (attrition bias), selection of reported results (reporting bias) and other potential sources of bias1516. The authors’ decisions were classified as “low risk of bias”, “high risk of bias” or “some concerns”. Any conflicts between the two authors were resolved through discussion with a third author. To explore the publication bias across studies, funnel plots were considered to present the relationship between effect size and standard error. Egger’s regression test was used to assess evidence of publication bias.
The Grading of Recommendations Assessment, Development and Evaluation (GRADE) scale was used to evaluate the strength and level of evidence for recommendations and was stratified as follows: high quality, which indicates no further research is needed and unlikely to change the confidence of the effects estimations; moderate quality, which indicates that further studies may affect the confidence of the effects estimation; low quality, which indicates further research is likely to have an crucial impact on the confidence of the effects estimation and may change the estimation; and very low quality, which indicates that we cannot be certain about this estimation.
Due to the cumulative pooling of trials in a chronological order, there is an increased risk of a type 1 error. Given the limited amount of data, we used trial sequential analysis (TSA) to determine whether the pooled evidence was conclusive and reliable. When the cumulative z-line on the curve crosses the boundary of sequence monitoring, the level of confidence for the intervention is conclusive and sufficient, indicating that no further studies are required. On the other hand, if the z-line on the curve does not cross any boundaries, the level of confidence is insufficient to draw a conclusion, and further studies are still needed. In this meta-analysis, we used an alpha error of 0.05, a beta error of 80% power, and a reduction in the risk ratio (RR) of POAF of 20%. We calculated the proportion of events from the control group in the current meta-analysis to obtain the sample size required for TSA.
Results
â¨A total of 540 unique citations were revealed through the literature search. After title and abstract screening, only 50 studies were deemed eligible, and following further assessment, 25 studies were included in this systematic review and meta-analysis. The PRISMA flowchart for study selection is shown in Figure 1.
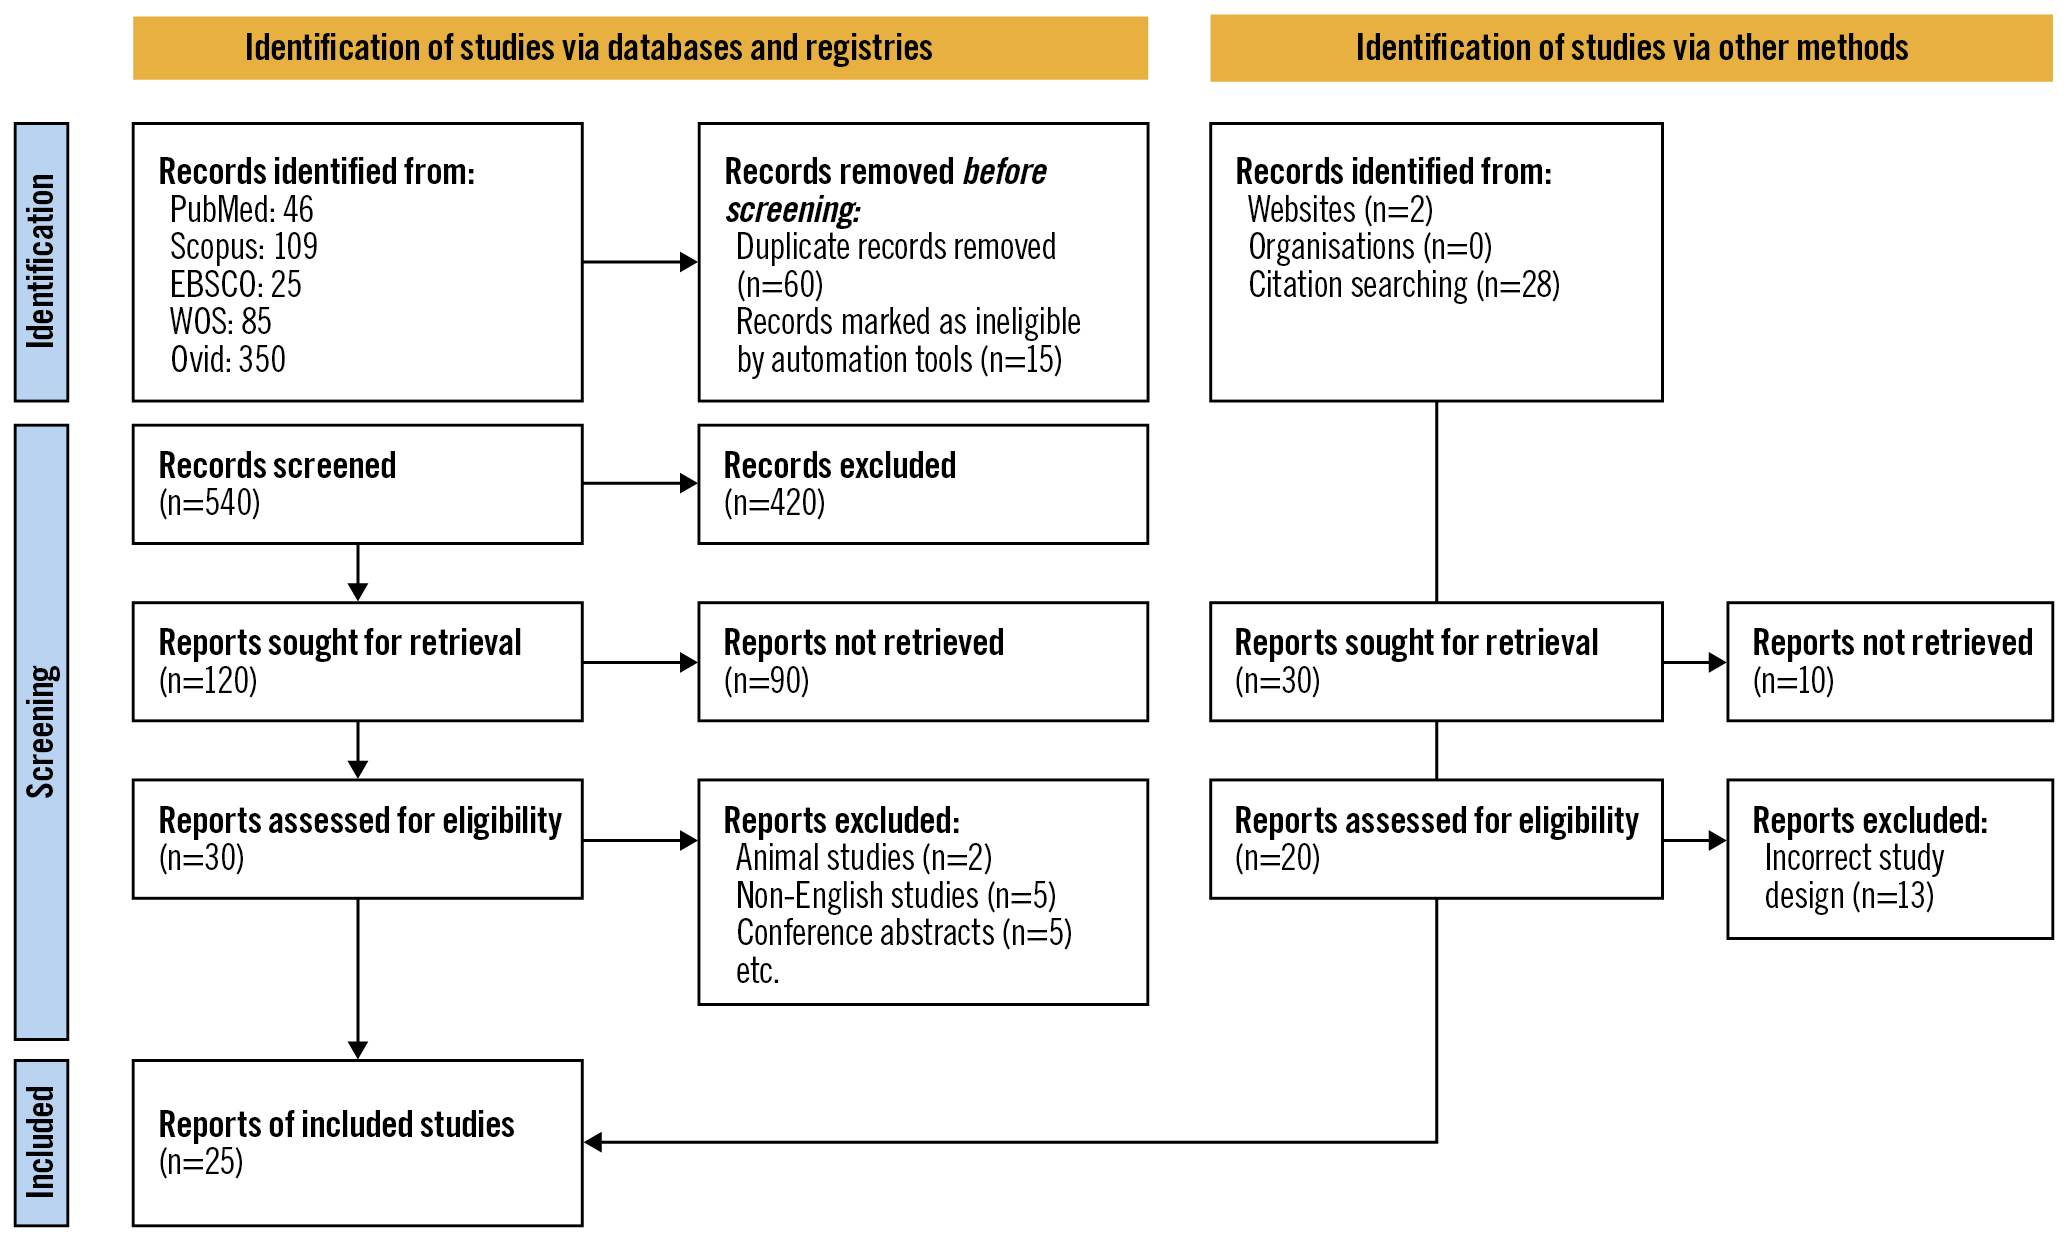
Figure 1. PRISMA flowchart for studies included in the systematic review and meta-analysis.
Characteristics of included studies
Our study included 25 trials of 4,467 patients comparing PP with the control group (no PP)2101117181920212223242526272829303132333435363738. Twenty-two studies of 4,300 patients assessed our primary outcome, POAF. Twenty studies assessed early pericardial effusion, 20 assessed pericardial tamponade, 16 assessed pleural effusion, and 11 assessed pulmonary complications. These studies were conducted in nine countries, mostly in Turkey (11 studies) and Egypt (5 studies). Baseline characteristics and a summary of the included studies are shown in Table 1 and Table 2.
Table 1. Main characteristics of randomised controlled trials included in the review.
| Author, year | Region | Study design | Surgery type | Sample size (PP/control) | Age | Male | Cross-clamp time (min) | CPB time (min) | ||||
|---|---|---|---|---|---|---|---|---|---|---|---|---|
| PP | control | PP | control | PP | control | PP | control | |||||
| Abd El-Wahab et al, 2022 | Egypt | RCT | CABG | 100 (50/50) | 58.34±8.73 | 53.80±8.56 | 66.0% | 80.0% | 20.5±54.5 | 16.5±59.2 | 28.6±88.6 | 22.9±86.9 |
| Ahmad et al, 2011 | Pakistan | RCT | CABG | 100 (50/50) | 54.3±8.4 | 54.3 ±8.8 | 72.0% | 68.0% | 37.08±5.8 | 37.76±6.3 | 56.50±5.08 | 54.97±4.13 |
| Amr et al, 2012 | Egypt | RCT | CABG | 64 (32/32) | 62.3±4.5 | 63.2±3.5 | 63.0% | 59.4% | 54.2 | 53.4 | 62.5 | 64.1 |
| Arbatli, 2003 | Turkey | RCT | CABG | 113 (54/59) | 62±8 | 60±9 | 83.0% | 74.6% | 58±17 | 60±19 | 117±32 | 112±35 |
| Asimakopoulos et al, 1997 | UK | RCT | CABG | 100 (50/50) | 61±9 | 61±2 | 35±2 | 33±8 | 66±17 | 62±17 | ||
| Bakhshandeh et al, 2009 | Iran | RCT | CABG alone or combined with valve repair or replacement | 410 (205/205) | 67.3±8.2 | 68.2±9 | 38.0% | 42.0% | NA | NA | NA | NA |
| Benyameen et al, 2021 | Egypt | RCT | Valve replacement, CABG. Both | 98 (48/50) | 48.10±14.34 | 53.10±14.82 | 54.2% | 56.0% | 85.59±29.76 | 84.06±24.20 | 115.35±25.52 | 113.70±16.90 |
| Cakalagaoglu et al, 2012 | Turkey | RCT | Valve replacement, CABG. Both | 100 (50/50) | 63.20±7.67 | 58.82±12.69 | 80.0% | 86.0% | 55.08±18.88 | 53.22±30.09 | 91.68±21.69 | 88.04±37.54 |
| Ebaid et al, 2021 | Egypt | RCT | Valvular or CABG | 400 (200/200) | 43.4±6.5 | 44.5±9.6 | 66.0% | 60.0% | 50±19.4 | 51.4±20.6 | 72.4±20.9 | 73.5±22.7 |
| Ekim et al, 2006 | Turkey | RCT | CABG | 100 (50/50) | 59.1±8.9 | 60.1±3.2 | 66.0% | 64.0% | 63±19 | 62±12 | 89±21 | 87±26 |
| Erdil et al, 2005 | Turkey | RCT | Heart valve operation with mechanical prosthesis | 100 (50/50) | 40.9±13.9 | 43.2±15.4 | 46.0% | 32.0% | 86.3±39.8 | 85.8±36.6 | 113.9±51.4 | 115.3±44.4 |
| Ezelsoy et al, 2019 | Turkey | RCT | CABG | 220 (110/110) | 67.51±7.35 | 66.84±6.92 | 64.5% | 61.8% | 53.15±17.23 | 55.31±09.11 | 86.48±21.89 | 89.32±19.15 |
| Farsak et al, 2002 | Turkey | RCT | CABG | 150 (75/75) | 64.2±8.9 | 62.8±5.4 | 36.0% | 32.0% | 35±11 | 40±9.3 | 57.5±6.1 | 61.4±8.7 |
| Fawzy et al, 2015 | Egypt | RCT | CABG | 200 (100/100) | 54.3±8.6 | 56±9.7 | 64.0% | 68.0% | 54.5±20.5 | 59.2±16.5 | 88.6±28.6 | 86.9±22.9 |
| Gaudino et al, 2021 | USA | RCT | Primary, elective interventions on the coronary arteries, the aortic valve, or the ascending aorta, or a combination of these | 212/208 | 61.0 (52.0-69.0) | 62.0 (55.0-70.0) | 162 (76%) | 156 (75%) | 81·0 (64·0-101·0) | 78·5 (61·0-100·0) | 104·0 (84·5-126·5) | 100·0 (82·0-121·0) |
| Haddadzadeh et al, 2015 | Iran | RCT | CABG | 105/102 | 61/07±10/4 | 61/4±11/6 | 72 (68.6%) | 70 (68.6%) | NA | NA | NA | NA |
| Kaleda et al, 2017 | Russian Federation | RCT | Primary isolated aortic valve replacement | 49/51 | 56.6±9.9 | 55.4±10.5 | 28 (57.0%) | 33 (65.0%) | 45±13 | 46±12 | 64±16 | 64±20 |
| Kaya et al, 2014 | Turkey | RCT | CABG | 30/33 | 56.9±10.13 | 58.91±10.90 | 23 (76.7%) | 29 (87.9%) | 43.47±15.67 | 45.79±21.19 | 79.6±26.08 | 86.24±27.33 |
| Kaya et al, 2015 | Turkey | RCT | CABG | 72/70 | 55.86±9.32 | 57.85±9.35 | 58 (80.6) | 60 (85.7) | 44.81±13.09 | 43.83±13.34 | 80.31±22.72 | 78.17±20.32 |
| Kaya et al, 2016 | Turkey | RCT | CABG | 103/107 | 58.39±9.24 | 57.46±9.13 | 80 (77.7%) | 84 (78.5%) | 45.47±19.05 | 42.89±14.91 | 81.6±26.53 | 77.02±22.83 |
| Kaygin et al, 2011 | Turkey | RCT | CABG | 213/212 | 58.8±11.3 | 59.0 ±11.3 | 107 (50.2%) | 105 (49.5%) | >50 min =115 (27%) | >50 min =110 (25.9%) | >80 min=101 (23.8%) | >80 min=99 (23.2%) |
| Kongmalai et al, 2014 | Thailand | RCT | CABG | 10//10 | 64.9±13.11 | 59.2±4.69 | 5 (50.0%) | 5 (50.0%) | 84.4±37.7 | 106.8±39.4 | 127.5±48.9 | 152.3±45.1 |
| Kuralay et al, 1999 | Turkey | RCT | CABG | 100/100 | 57±12 | 61±8 | 77 (77.0%) | 73 (77.0%) | 36±12 | 43±9 | 48±5 (perfusion time) | 51±4 (perfusion time) |
| Sadeghpour et al, 2011 | Iran | RCT | CABG | 40/40 | 60.68±8.49 | 60.3±12.6 | 31(77.5%) | 32 (80.0%) | 48.6+24.9 | NA | NA | NA |
| Zhao et al, 2014 | People’s Republic of China | RCT | Cardiac surgeries (CABG, valve replacement or ventricular aneurysm) | 228/230 | 54±16 | 56±18 | 138 (60.5%) | 125 (54.3%) | 67±29 | 62±23 | 110±46 | 103±51 |
| CABG: coronary artery bypass graft; CPB: cardiopulmonary bypass; NA: not applicable; RCT: randomised controlled trial | ||||||||||||
Table 2. Summary of randomised controlled trials included in the review.
| Study ID | Follow-up | POAF | Early pericardial effusion | Late pericardial effusion | Pulmonary complications | Pericardiac tamponade | ICU stay (days) | Hospitalisation time (days) | IABP usage | Mortality | Revision of bleeding | Pleural effusion | |||||||||||
|---|---|---|---|---|---|---|---|---|---|---|---|---|---|---|---|---|---|---|---|---|---|---|---|
| PP | non-PP | PP | non-PP | PP | non-PP | PP | non-PP | PP | non-PP | PP | non-PP | PP | non-PP | PP | non-PP | PP | non-PP | PP | non-PP | PP | non-PP | ||
| Abd El-Wahab et al, 2022 | One week | 6 | 12 | 6 | 18 | NA | NA | NA | NA | 0 | 2 | NA | NA | 6.1 ±1.25 | 6.3±1.83 | 1 | 0 | 0 | 0 | 1 | 2 | 15 | 10 |
| Ahmad et al, 2011 | Up to 2 weeks | 2 | 12 | 3 | 18 | NA | NA | 2 | 1 | NA | NA | NA | NA | 5.32±0.95 | 5.38±0.9 | NA | NA | 0 | 0 | 2 | 2 | 11 | 9 |
| Amr et al, 2012 | Up to 30 days | 6 | 13 | 7 | 17 | 10 | 30 | 2 | 2 | 0 | 1 | 1.3 ±0.7 | 1.2 ±0.5 | 7.9±4.7 | 8.5 ±5.1 | NA | NA | NA | NA | 1 | 2 | NA | NA |
| Arbatli 2003 | Up to 30 days | 7 | 12 | 14 | 28 | NA | NA | NA | NA | NA | NA | 3 ±2 | 3 ±3 | 14±8 | 13 ±5 | 1 | 0 | NA | NA | NA | NA | 7 | 3 |
| Asimakopoulos et al, 1997 | One week | 12 | 9 | NA | NA | NA | NA | NA | NA | NA | NA | NA | NA | NA | NA | 1 | 1 | 1 | 1 | 1 | 1 | NA | NA |
| Bakhshandeh et al, 2009 | Up to 30 days | 53 | 59 | 18 | 194 | 26 | 194 | 4 | 3 | 0 | 2 | 1.3±0.7 | 1.2 ±0.5 | 5.9±4.7 | 5.5±5.1 | NA | NA | 7 | 11 | 11 | 8 | NA | NA |
| Benyameen et al, 2020 | Up to 30 days | 8 | 22 | 12 | 32 | 10 | 28 | NA | NA | 0 | 6 | NA | NA | 10.5±2.27 | 12.4±3.08 | NA | NA | NA | NA | NA | NA | 4 | 0 |
| Cakalagaoglu et al, 2012 | Up to 30 days | NA | NA | 50 | 50 | NA | NA | 14 | 13 | 0 | 6 | 2.88 ±1.38 | 2.76 ±1.90 | 9.58 ±2.60 | 9.68 ±3.36 | NA | NA | 0 | 0 | 1 | 1 | NA | NA |
| Ebaid et al, 2021 | Up to 15 days | 6 | 12 | 6 | 46 | 6 | 40 | 40 | 26 | 0 | 46 | NA | NA | NA | NA | NA | NA | NA | NA | NA | NA | 34 | 26 |
| Ekim et al, 2006 | One week | 5 | 15 | 6 | 12 | 0 | 3 | 2 | 3 | 0 | 1 | NA | NA | NA | NA | NA | NA | 0 | 0 | 1 | 1 | 12 | 9 |
| Erdil et al, 2005 | Up to 30 days | NA | NA | 4 | 19 | 0 | 9 | 1 | 2 | 0 | 5 | NA | NA | 7.7 ±3.7 | 6.9 ±1.5 | NA | NA | 0 | 0 | 2 | 3 | 9 | 7 |
| Ezelsoy et al, 2019 | Up to 30 days | 5 | 16 | 0 | 2 | NA | NA | NA | NA | 0 | 4 | 1.19±0.6 | 1.77±0.69 | 7.3±1.65 | 7.8±2.15 | NA | NA | 0 | 0 | 3 | 2 | 7 | 3 |
| Farsak et al, 2002 | Up to 30 days | 7 | 24 | 8 | 32 | 0 | 7 | 3 | 2 | 0 | 0 | NA | NA | 7±3.7 | 8±1.5 | 1 | 1 | 1 | 0 | NA | NA | 19 | 13 |
| Fawzy et al, 2015 | Up to 30 days | 13 | 30 | 15 | 50 | NA | NA | NA | NA | 0 | 3 | NA | NA | 8±2.5 | 9±2.9 | 1 | 1 | NA | NA | NA | NA | NA | NA |
| Gaudino et al, 2021 | Up to 30 days | 37 | 66 | 26 | 45 | NA | NA | NA | NA | 1 | 1 | NA | NA | 5.7±1.49 | 5.7±1.49 | 5 | 2 | 2 | 1 | NA | NA | 63 | 67 |
| Haddadzadeh et al, 2015 | One week | 5 | 6 | 11 | 14 | NA | NA | NA | NA | NA | NA | NA | NA | NA | NA | NA | NA | NA | NA | NA | NA | NA | NA |
| Kaleda et al, 2017 | Up to 30 days | 8 | 7 | 5 | 6 | NA | NA | NA | NA | NA | NA | 2.6±1.6 | 2.3±1.0 | 12.4±4.3 | 11.9±4.1 | NA | NA | 0 | 0 | 1 | 4 | NA | NA |
| Kaya et al, 2014 | Up to 30 days | 6 | 11 | 0 | 4 | NA | NA | 4 | 12 | 0 | 4 | NA | NA | 6.63±2.71 | 11.56±10.64 | NA | NA | 0 | 2 | 0 | 2 | NA | NA |
| Kaya et al, 2015 | Up to 30 days | 6 | 20 | 34 | 55 | NA | NA | NA | NA | 1 | 1 | 1.07±0.31 | 1.38±1.09 | 6.29±1.87 | 7.7±4.18 | NA | NA | NA | NA | 2 | 3 | 3 | 5 |
| Kaya et al, 2016 | Up to 30 days | 15 | 30 | 36 | 57 | NA | NA | NA | NA | 0 | 4 | NA | NA | 6.11 2.31 | 7.33 4.05 | 0 | 1 | 0 | 1 | 1 | 2 | 6 | 9 |
| Kaygin et al, 2011 | Up to 30 days | 14 | 62 | 10 | 46 | 2 | 32 | 41 | 38 | 0 | 7 | NA | NA | NA | NA | 24 | 25 | 3 | 4 | 13 | 15 | 59 | 32 |
| Kongmalai et al, 2014 | Up to 30 days | 4 | 4 | 7 | 6 | NA | NA | NA | NA | 0 | 0 | 4+2 | 2.2+1.62 | 16.40+6.08 | 13.60+8.29 | 0 | 0 | 0 | 0 | NA | NA | 10 | 5 |
| Kuralay et al, 1999 | Up to 30 days | 6 | 34 | 1 | 54 | 0 | 21 | 3 | 2 | 0 | 10 | NA | NA | 7±2.5 | 8±2.9 | NA | NA | NA | NA | NA | NA | 35 | 29 |
| Sadeghpour 2011 | One week | NA | NA | 2 | 23 | 1 | 20 | NA | NA | NA | NA | NA | NA | NA | NA | NA | NA | NA | NA | NA | NA | NA | NA |
| Zhao et al, 2014 | One week | 20 | 35 | 4 | 27 | NA | NA | NA | NA | 3 | 13 | 2.54±1.92 | 2.21±1.54 | NA | NA | 22 | 19 | 0 | 0 | NA | NA | 42 | 24 |
| IABP: intra-aortic balloon pump; ICU: intensive care unit; NA: not applicable; POAF: postoperative atrial fibrillation; PP: posterior pericardiotomy | |||||||||||||||||||||||
Risk of bias assessments
A summary and graph of the risk of bias in our included studies are shown in Figure 2. Most studies showed an overall unclear risk of bias; however, eight studies showed a low risk. The authors’ judgments were made according to the Cochrane risk of bias assessment tool39.
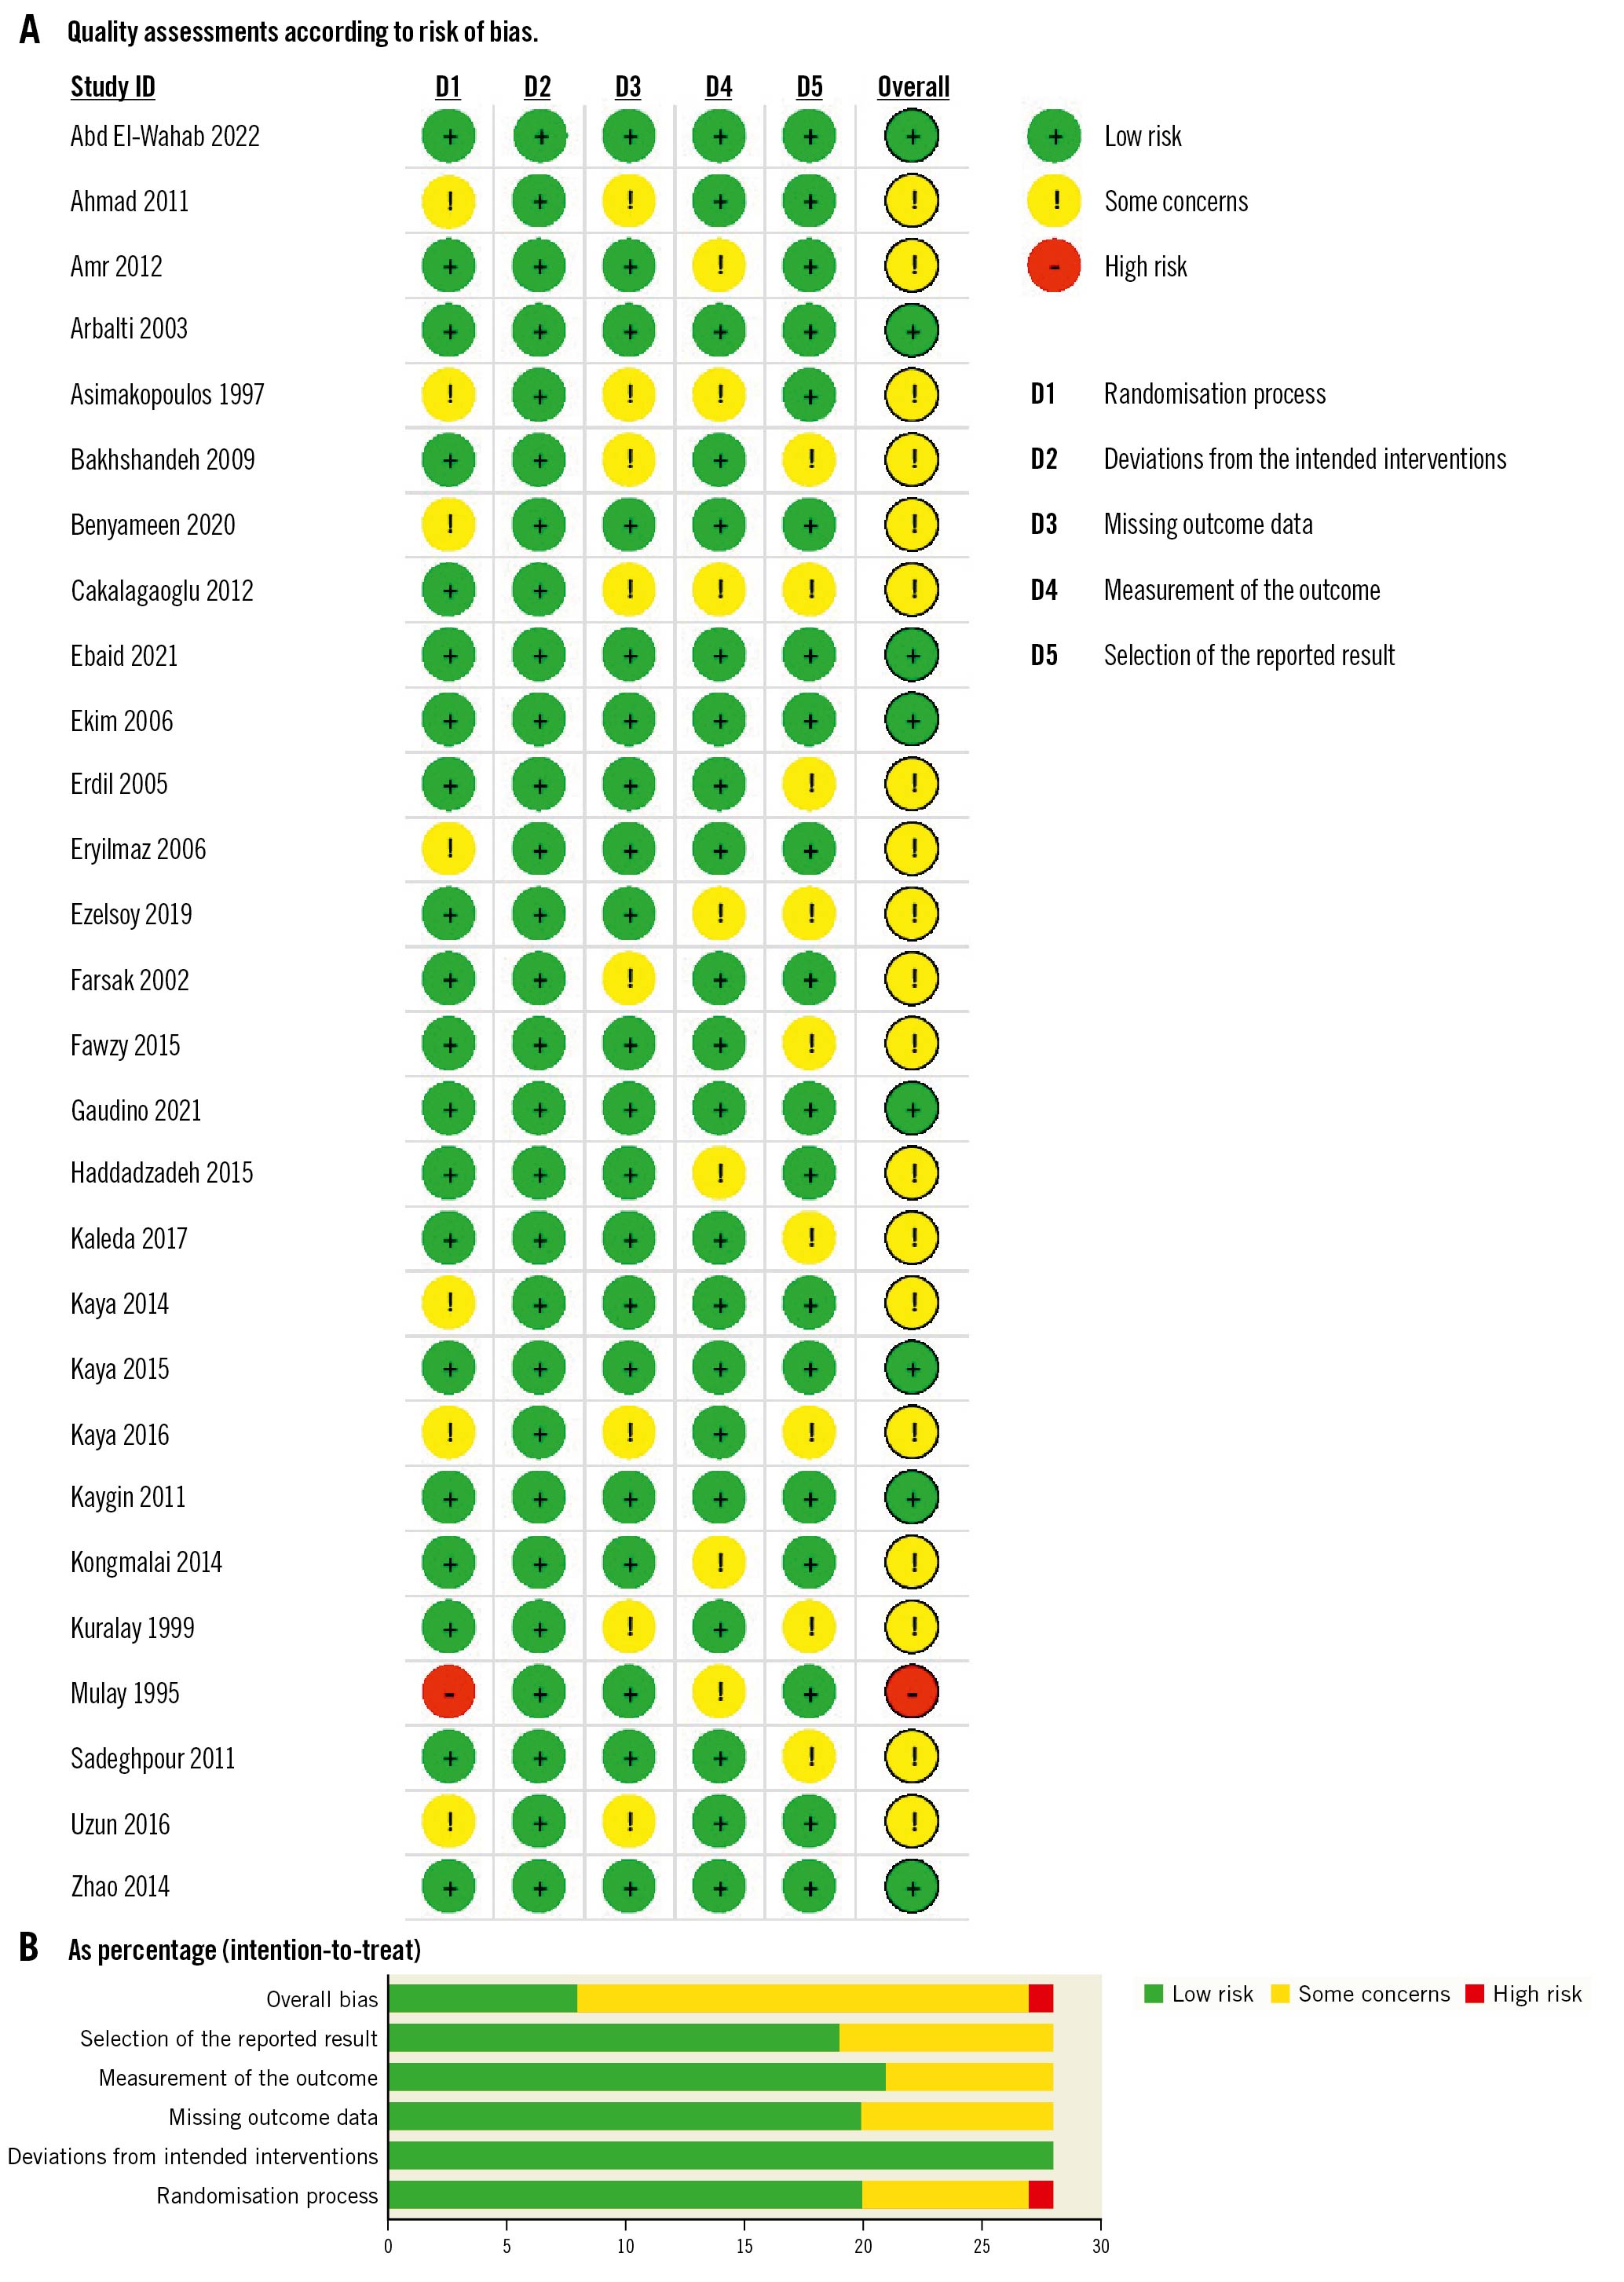
Figure 2. Quality-assessments. A) Quality assessment according to risk of bias for each study. B) Quality assessment according to risk of bias as percentage (intention to treat).
Postoperative atrial fibrillation (POAF)
POAF was reported in 22 studies included in our analysis. Our study’s cumulative incidence of POAF was 11.7% in the PP group and 23.67% in the control group. The pooled OR and 95% CI for POAF were 0.49, 95% CI: 0.38-0.61 (p<0.001) favouring PP for the decrease in POAF as shown in Figure 3. Pooled studies were heterogeneous (I2=38.74%; p=0.04). Leave-one-out sensitivity analysis showed that no single study had a disproportional effect on the pooled OR, which varied between 0.46 (95% CI: 0.37-057), after excluding Bakhshandeh et al, and 0.52 (95% CI: 0.42-0.65), after excluding Kaygin et al, as shown in Figure 4.
We tested the source of heterogeneity via a sensitivity analysis. First, we excluded studies with the smallest sample sizes1031. Then we used the random-effects model, which provided similar results to the overall results (OR 0.47, 95% CI: 0.37-0.60; p<0.001) with significant heterogeneity (I2=42.46%; p=0.02), as shown in Supplementary Figure 1.
We further analysed 16 studies in which the included patients did not take preoperative oral beta blockers. Still, significant heterogeneity was observed (I2= 34.70%; p =0.14). The pooled analysis of these 16 studies using the random-effects model showed that the PP group had a lower incidence of POAF compared to the control group (OR 0.47, 95% CI: 0.35-0.62; p<0.001), as shown in Supplementary Figure 2.
We also examined the clinical heterogeneity according to geographical area, as about 41% of the included studies that mentioned POAF were conducted in Turkey. When we pooled and analysed studies based on geography, studies in Egypt and Turkey showed clinical significance (OR 0.45, 95% CI: 0.30-0.67; and OR 0.33, 95% CI: 0.24-0.46), respectively. The pooled studies were homogenous for Egypt and Turkey (I2= 0.00%; p <0.001 and I2= 12.03%; p <0.001), respectively, as shown in Supplementary Figure 3.
We performed a subgroup analysis based on the type of surgery, as about 72.7% of the included studies assessing POAF had patients who had undergone CABG. Seventeen studies were pooled in the CABG group and only 7 studies included mixed surgeries, of which the pooled analysis showed that in both subgroups, CABG only or mixed surgeries, the PP group had a lower incidence of POAF compared to the control group (OR 0.41, 95% CI: 0.31-0.54; p<0.001; and OR 0.66, 95% CI: 0.50-0.87; p<0.001), respectively, as shown in Supplementary Figure 4.
We also tested heterogeneity using the Galbraith plot, and four studies appeared outside the 95% CI of the regression, indicating their heterogeneity from other trials (Figure 5). Moreover, the use of a trial sequential analysis (TSA) for 22 RCTs revealed that the evidence for using PP to decrease the postoperative AF was sufficient and conclusive, and no other trials are needed (Figure 6).
We conducted a trial sequential analysis (TSA) for 22 RCTs, as shown in Figure 6; the cumulative Z-curve crossed both the conventional boundary for the benefit and the trial sequential monitoring boundary for the benefit and entered the area of benefit suggesting that our evidence of use PP decrease postoperative AF was sufficient, conclusive, and no other trials are needed.
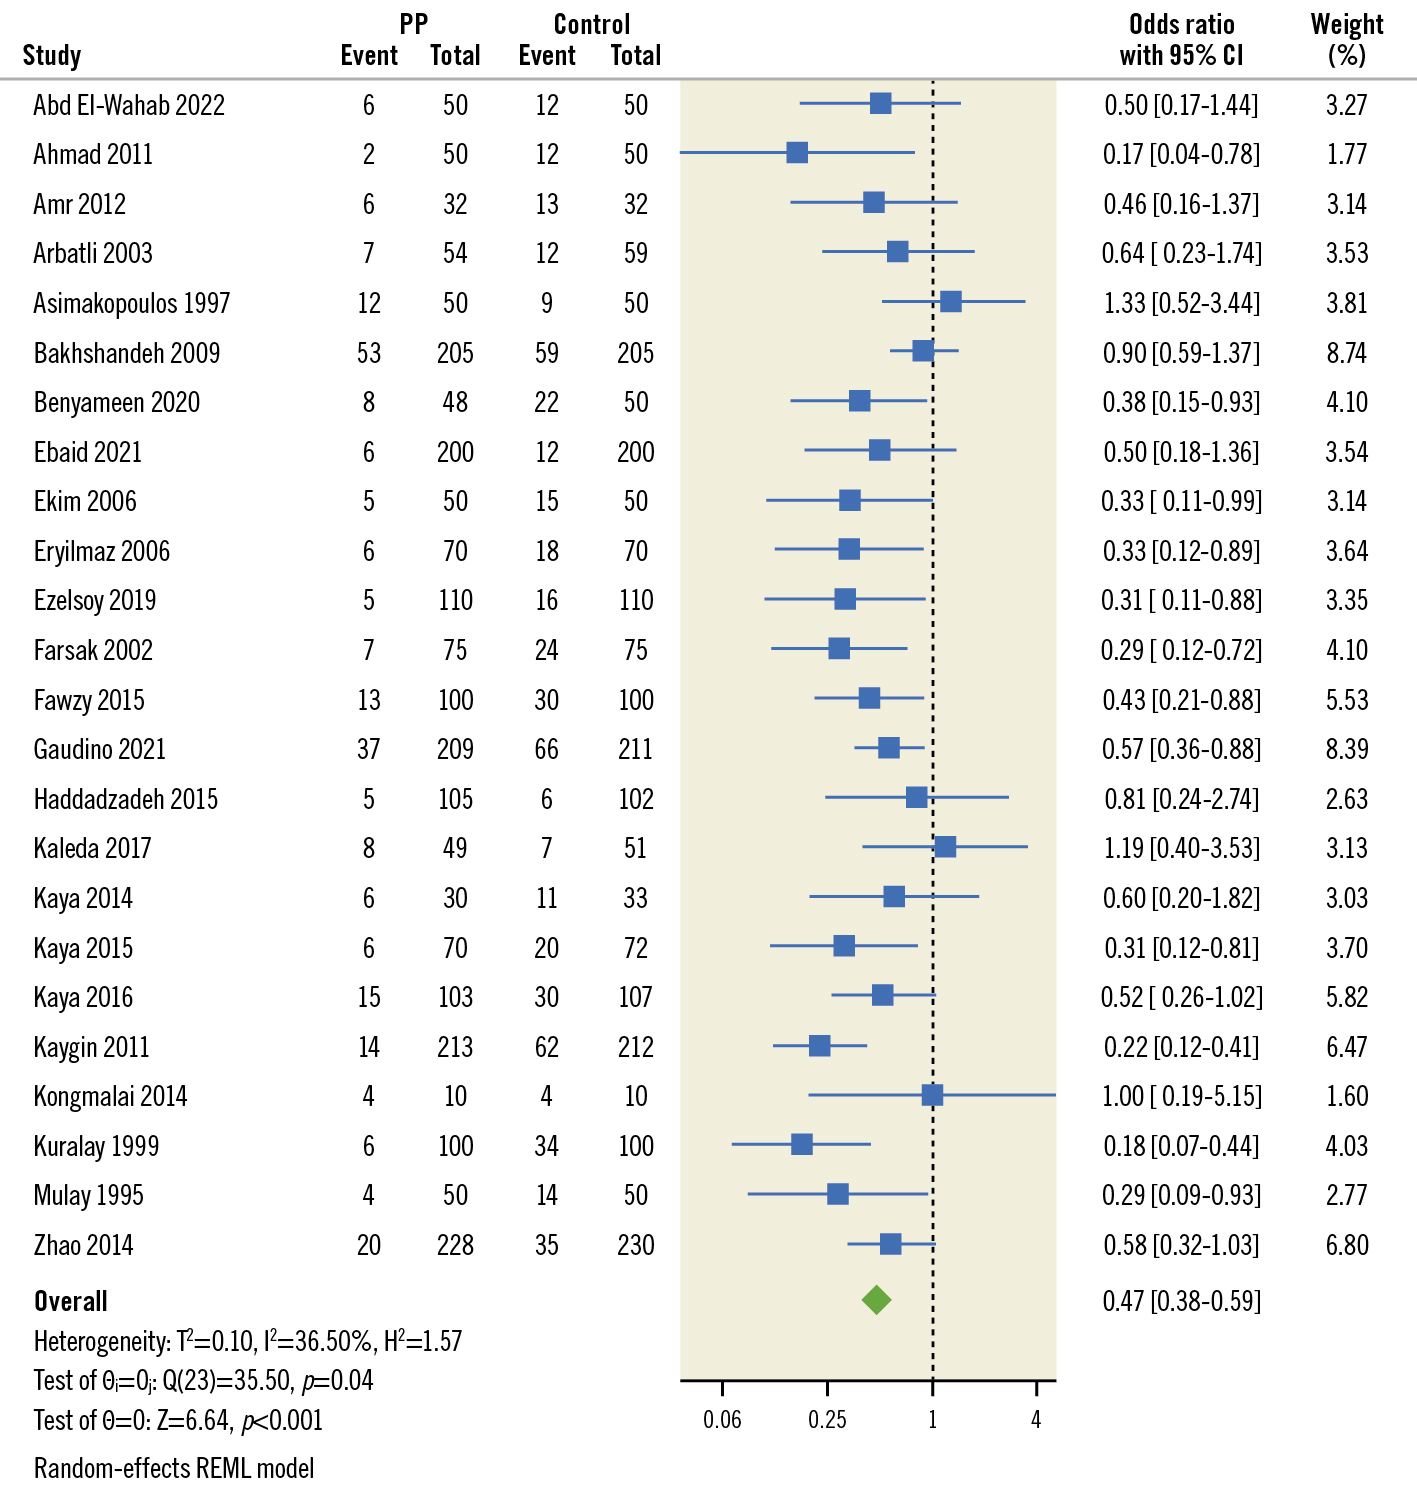
Figure 3. Pooled estimates from RCTs evaluating the effect of PP on the incidence of AF after cardiac surgery with a random-effects model. AF: atrial fibrillation; CI: confidence interval; PP: posterior pericardiotomy RCT: randomised controlled trials; REML: restricted maximum likelihood
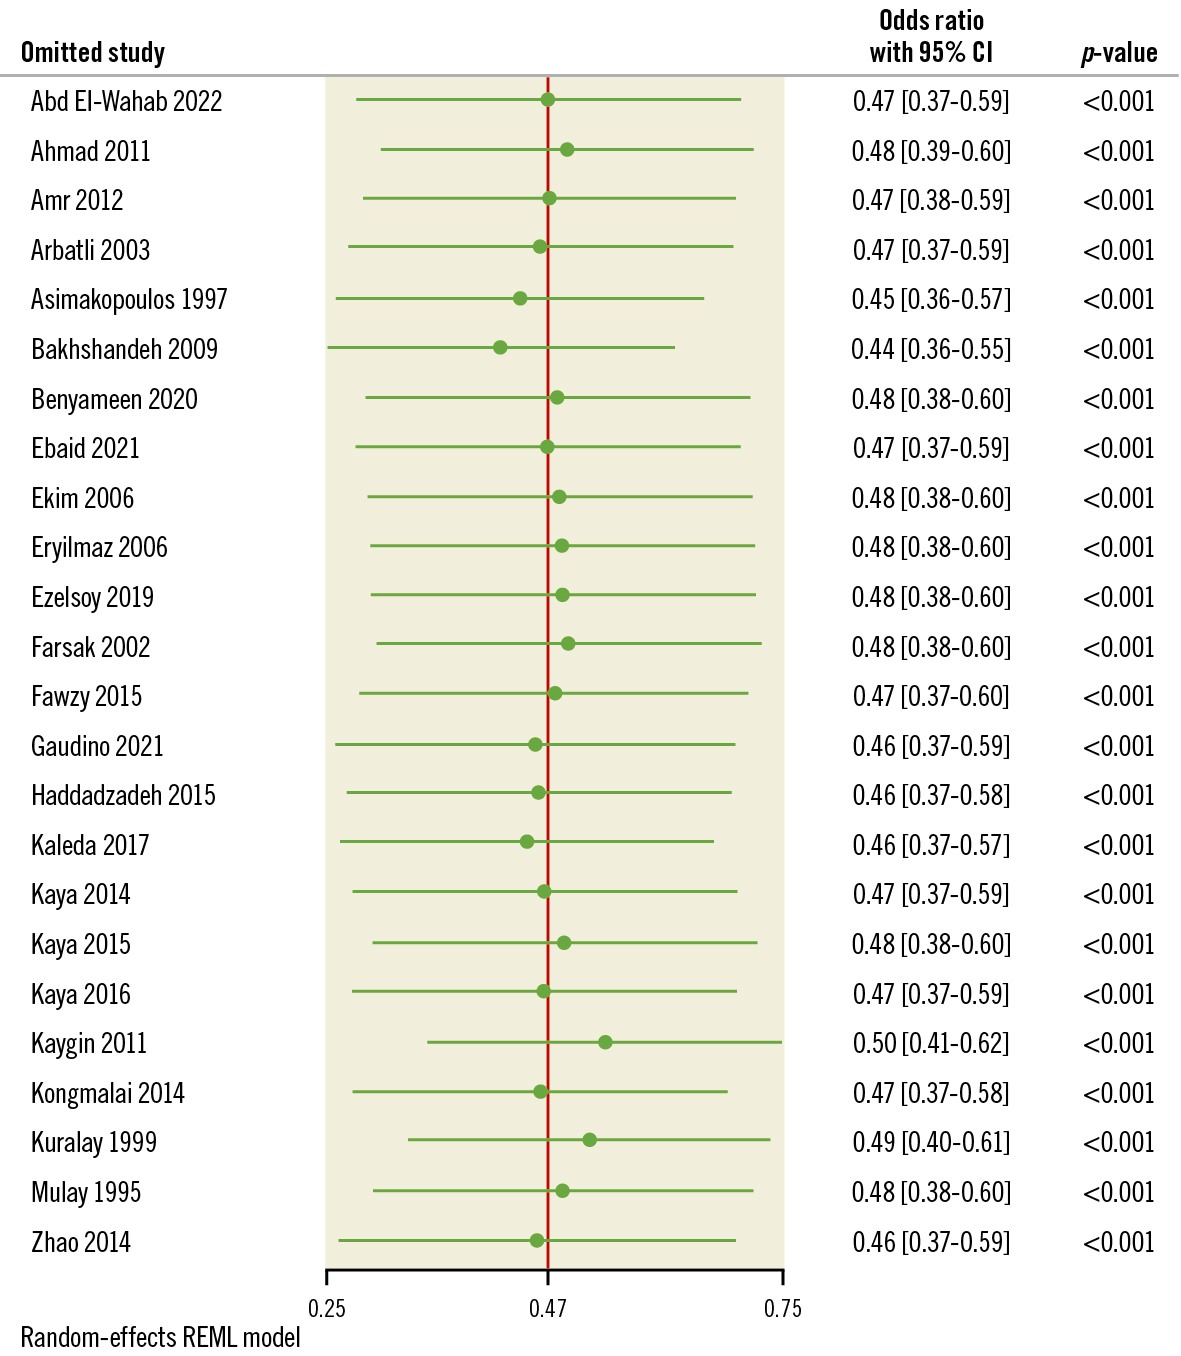
Figure 4. Leave-one-out analysis of AF. AF: atrial fibrillation; CI: confidence interval
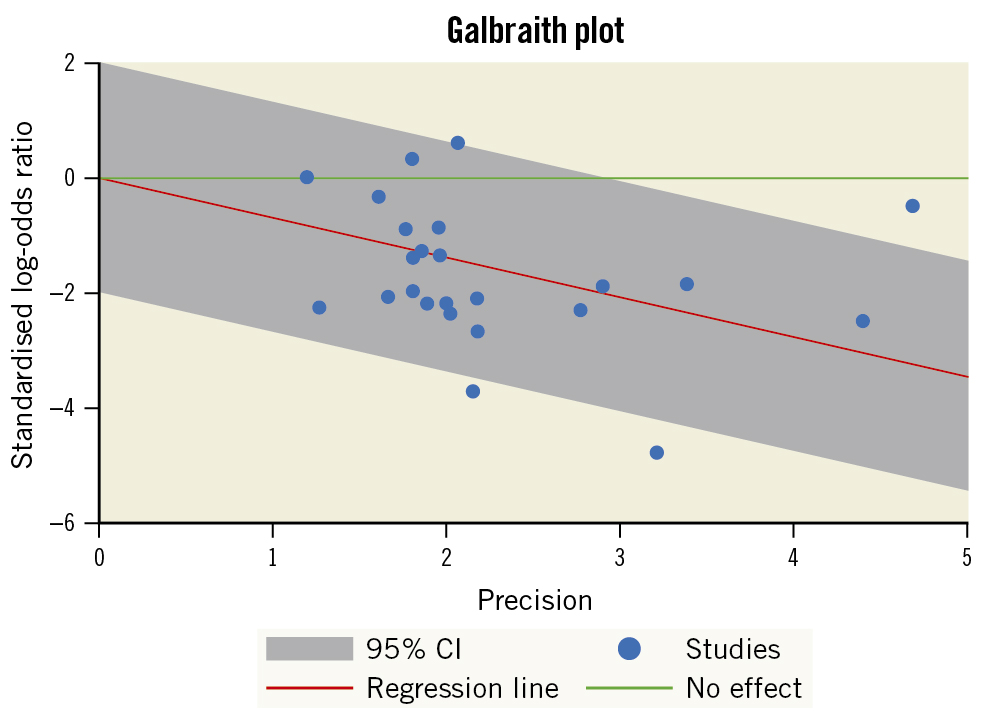
Figure 5. Galbraith plot indicating the heterogeneity across studies assessing POAF. CI: confidence interval; POAF: postoperative atrial fibrillation
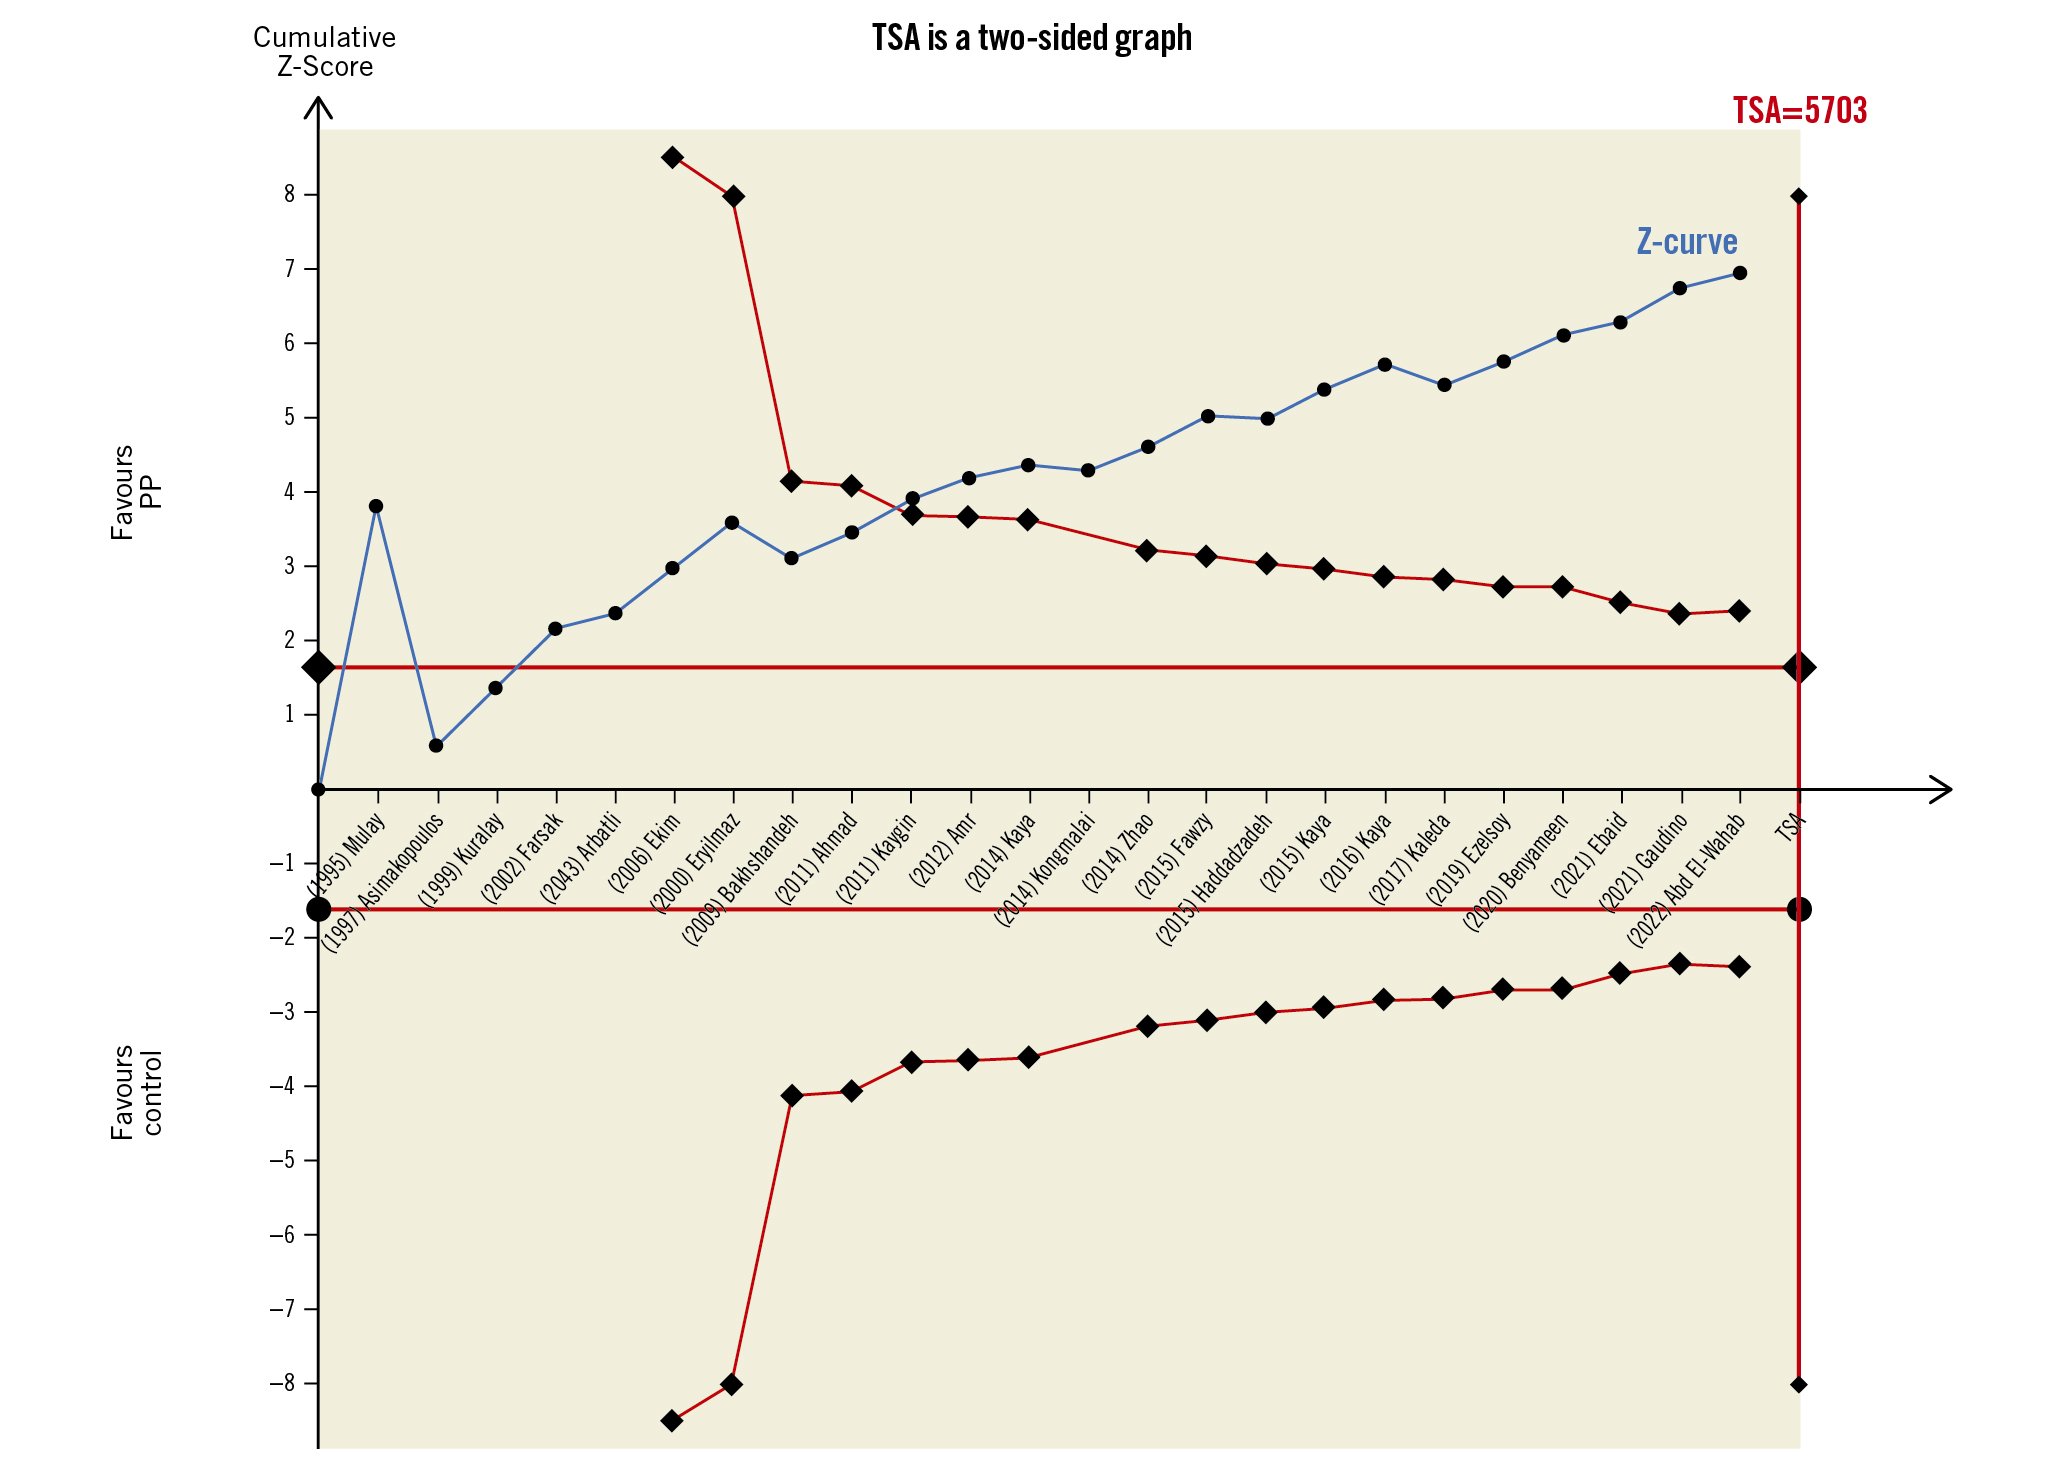
Figure 6. A trial sequential analysis (TSA) for 22 RCTs illustrating that the cumulative Z-curve crossed both the conventional boundary for benefit and the trial sequential monitoring boundary for benefit and entered the area of benefit, establishing sufficient and conclusive evidence and suggesting further trials are not needed. A diversity-adjusted required information size of 5,703 patients was calculated using an alpha error of 0.05, a beta error of 0.20 (power 80%), an anticipated RR reduction of 20% in AF, and a control event proportion of 23.8%, as calculated from the control group in this meta-analysis. AF: atrial fibrillation; PP: postoperative pericardiotomy; RCT: randomised controlled trial; RR: risk ratio
Secondary outcomes
Compared to the control group, the PP group had significantly (p<0.0001) reduced SVT (OR 0.66, 95% CI: 0.43-0.89), early pericardial effusion (OR 0.32, 95% CI: 0.22-0.46), late pericardial effusion (OR 0.15, 95% CI: 0.09-0.25), pericardiac tamponade (OR 0.18, 95% CI: 0.1-0.33), and hospital stay (MD −0.48, 95% CI: −0.84 to −0.13) (Supplementary Figure 5-Supplementary Figure 9). The pooled studies assessing SVT and late pericardial effusion were slightly heterogeneous (I2=14.55%; p=0.49 and I2=38.23%; p<0.16). Studies assessing early pericardial effusion and hospital stay were heterogeneous (I2=72.54%; p<0.0001 and I2=67.74%; p<0.0001). The leave-one-out sensitivity analysis for early pericardial effusion showed that no single study had a disproportional effect on the overall OR, which ranged from 0.30 (95% CI: 0.21-0.43), after excluding Cakalagaoglu et al, to 0.36 (95% CI: 0.25-0.5), after excluding Bakhshandeh et al, as shown in Supplementary Figure 10. In the leave-one-out sensitivity analysis for hospital stay, the MD ranged from −0.54 (95% CI: −0.90 to −0.18), with Bakhshandeh et al21 excluded, to −0.39 (95% CI: −0.72 to −0.07) with Benyameen et al22 excluded (Supplementary Figure 11).
Our analysis did not detect any significant differences between the PP and control groups regarding pulmonary complications (OR 1.14, 95% CI: 0.85-1.52), need for IABP (OR 1.12, 95% CI: 0.75-1.66), revision surgery for bleeding (OR 0.86, 95% CI: 0.56-1.34), mortality (OR 0.79, 95% CI: 0.43-1.45), or ICU stay (MD 0.02, 95% CI: −0.24 to 0.29) (Supplementary Figure 12-Supplementary Figure 16). The pooled studies assessing pulmonary complications, need for IABP, revision surgery for bleeding, and mortality were homogenous with the following values respectively: (I2=0%; p=0.84, I2=0%; p=0.98, I2=0%; p=0.99, and I2=0%; p=1). Regarding ICU stay, the studies assessing this outcome were heterogeneous (I2=86.7%; p=0.54). Heterogeneity was best removed by sensitivity analysis and the exclusion of Ezelsoy et al and Kongmalai et al1126 (I2=42.3%; p=0.11) (Supplementary Figure 17).
Pleural effusion was also shown to be significantly higher in the PP group (OR 1.34, 95% CI: 1.12-1.61; p<0.0001) as shown in Supplementary Figure 18. The pooled studies were homogenous (I2=0%; p=0.68).
Publication bias for studies assessing POAF
We used the funnel plot to detect a possible publication bias, and, by inspection, we found slight asymmetry indicating the possibility of publication bias, as shown in Figure 7A. We used the trim and fill method to find out which studies needed to improve stability; we found one study that needed to achieve stability, as shown in Figure 7B. Our finding may be explained by insufficient literature and clinical heterogeneity.
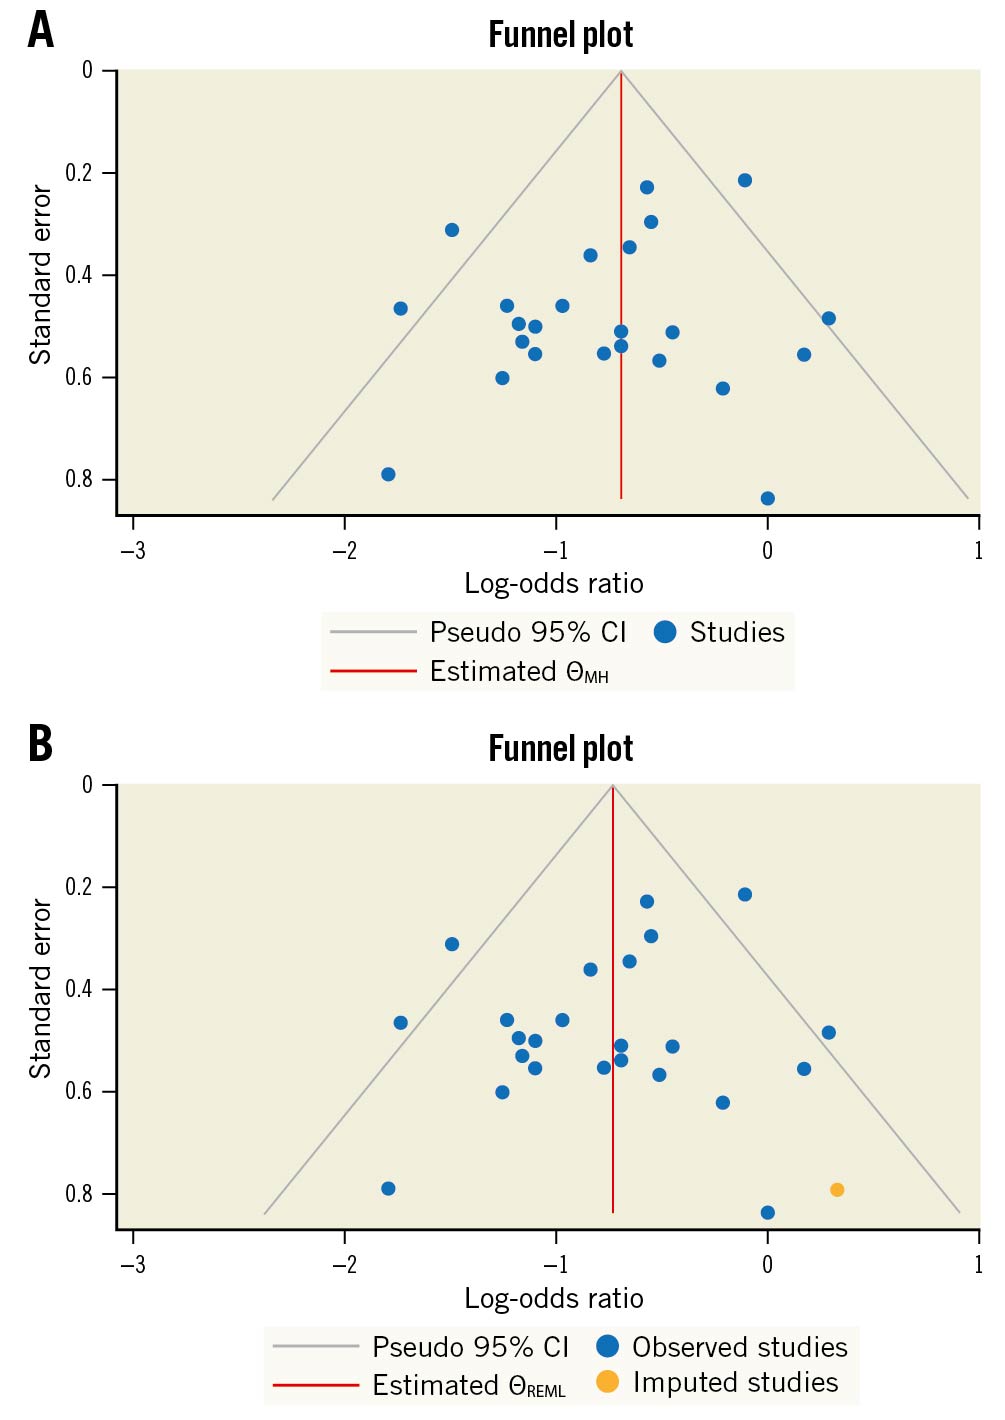
Figure 7. Funnel plots for publication bias. A) Funnel plot for possible publication bias regarding POAF. B) Funnel plot for possible publication bias using the trim and fill method regarding POAF. CI: confidence interval; ƟMH: Cochran–Mantel–Haenszel test; ƟREML: restricted maximum likelihood; POAF: postoperative atrial fibrillation
GRADE assessment
The GRADE rating results are shown in Supplementary Table 3. According to the GRADE system, the strength of evidence was high for atrial fibrillation, incidence of SVT, early pericardial effusion, late pericardial effusion, pericardial tamponade, and plural effusion; moderate for ICU and hospital stays; low for pulmonary complications, postoperative revision for bleeding and IABP usage; and very low for mortality.
Discussion
Our meta-analysis included 25 trials of 4,467 patients comparing PP with no PP (the control group). We found that the PP group was superior to the control group regarding the following outcomes: POAF, SVT, early and pericardial effusion, pericardiac tamponade, and hospital stay. However, there were no significant differences between the two groups for pulmonary complications, revision surgery for bleeding, mortality, or ICU stay. We also found that pleural effusion was higher in the PP group.
Atrial fibrillation is the most frequent postoperative arrhythmia, occurring in up to 20-30% of cases across the studies. Most cases of atrial fibrillation occur within the first few days after surgery and its causes are not clearly understood. Age, atrial dilatation, perioperative ischaemia, electrolyte imbalance, volume overload, right coronary artery involvement, thyroid problems, left ventricular aneurysm, extra valve operations, low cardiac output, kidney injury, respiratory complications, and pericardial effusion are some of the possible precipitating factors for AF40.
The placement of a chest drain underneath the sternum allows for easy drainage of the anterior area around the heart after CABG. However, the posterior space is a closed region behind the heart and cannot be drained similarly because of its proximity to the grafts and the heart itself. In this way, even a minimal amount of pericardial effusion accumulating in the posterior pericardium can cause localised tamponade of the left atrium and ventricle, which, in turn, can cause POAF. Numerous studies have shown that allowing the pericardial effusion to drain freely into the left pleural space reduces the prevalence of pericardial effusion and POAF, hence preventing arrhythmias and tamponade2325.
Our systematic review and meta-analysis of 22 studies assessing POAF found that PP helped prevent POAF in patients after CABG. Although some randomised controlled trials have revealed contradictory results172538, the present study’s findings are consistent with earlier meta-analyses4812. The present study used TSA for power analysis, ensuring adequate and convincing evidence. The evidence for POAF prevention was strong. These results suggest that PP may reduce the occurrence of AF following CABG. However, we cannot exclude the possibility of bias in the included studies, as the pooled studies in our analysis were heterogeneous. This could be explained by clinical heterogeneity, and different CABG approaches and pre- and postoperative medications should be considered. Although the incidence of POAF after PP was decreased, this effect seemed to be found only in the studies conducted in Egypt and Turkey, which opens the door for upcoming research studies assessing the effect of PP on POAF in Western and Asian countries.
Our findings suggest that PP can dramatically decrease pericardial effusion in patients after CABG, with both early and late pericardial effusion being much less common in the PP group compared to the control group. Similar results were observed by Xiong et al, whereas Cakalagaoglu et al and Ekim et al found no difference; this discrepancy may be due to the smaller sample sizes employed by these researchers132336.
The current meta-analysis revealed that PP effectively decreases postoperative pericardiac tamponade compared to the control. Consequently, the PP group had a greater increase in pleural effusion, suggesting that fluid can be readily evacuated into the left thoracic cavity via the PP process, which greatly lowered the risk of pericardial tamponade. On the other hand, the accumulation of pericardial fluid in the pleura triggered an inflammatory response in some patients, requiring chest tube reinsertion. The reinsertion, in most cases, took place after the removal of the initial pleural tube17192327. Notably, there was no discernible difference in the occurrence of pulmonary complications between the PP group and the control group. Therefore, the results of the current study suggest that PP is a viable option for chest drainage that can lessen the likelihood of cardiac tamponade without raising the probability of pulmonary complications. Our results were consistent with previous studies2027. Furthermore, we found that PP patients had a shorter average ICU stay after surgery than those in the control group. Preventing AF after CABG surgery with PP may be a safe and cost-effective way to lower patients’ medical bills and conserve hospital resources due to the inverse relationship between the length of time spent in the intensive care unit and overall hospitalisation costs27.
In addition, we found that PP did not reduce the need for intra-aortic balloon pump support, a second operation due to bleeding, or death in the postoperative period. In alignment with our results, the prior meta-analyses did not identify any distinctions between the PP and control groups regarding these outcomes. Our study included 25 studies, of which 22 studies, comprising 4,300 patients, compared POAF in PP and control groups. To detect the heterogeneity and outliers in our study, we applied the random-effects model, leave-one-out sensitivity analysis and the Galbraith plot. We also used TSA to prove that our evidence was sufficient and that no further trials would be needed.
Limitations
This meta-analysis has several limitations. First, although our findings align with those of previous systematic reviews, there was not adequate control for the impact of preoperative medications on the postoperative recurrence of AF in the trials included. Second, the included studies were moderately heterogeneous, which led to unreliable analytic results. This heterogeneity was due to discrepancies in patient characteristics and the definition of postoperative AF. We tried to resolve these issues by stratifying the studied population according to preoperative beta blocker intake, type of CABG surgery, and geographical area, as shown in Supplementary Figure 2-Supplementary Figure 4, respectively. Third, the quality of the included studies was variable, as shown in Figure 2, but we applied the GRADE system to enhance the certainty of evidence pooled from our studies. Other limitations we faced were heterogeneity in follow-up, outcome assessment, and definition of outcomes assessed across the trials and the varying numbers of surgical interventions performed.
We recommend further studies to resolve heterogeneity by stratifying patients according to their preoperative preparation and medication, and the type of CABG operation – on-pump or off-pump; Haddadzadeh et al showed that PP did not affect postoperative AF incidence in patients undergoing off-pump CABG10. Concurrently, Panesar et al, in their meta-analysis, declared that the off-pump technique is associated with a lower incidence of POAF41.
Conclusions
In conclusion, this systematic review and meta-analysis found that PP effectively reduced the risk of new-onset POAF, pericardial effusion, pericardial tamponade, bleeding problems, and length of hospital stay following CABG. We found no statistically significant differences between the PP and control groups regarding pulmonary complications, IABP use, mortality, or length of time spent in the intensive care unit. Given these results, it seems reasonable to conclude that PP is a straightforward surgical procedure with minimal risk that should be considered in future practice.
Impact on daily practice
Atrial fibrillation is the most frequent postoperative arrhythmia, occurring in up to 20-30% of cases across studies. Most cases of atrial fibrillation occur within the first few days after surgery. Numerous studies have shown that allowing the pericardial effusion to drain freely into the left pleural space reduces the prevalence of pericardial effusion and AF. Our systematic review and meta-analysis of 25 studies found that PP helped prevent AF in patients after cardiac surgery. We used TSA for power analysis, ensuring adequate and convincing data that the evidence for POAF prevention was strong. We also used the GRADE system to detect the power of each outcome, and we concluded that the evidence of POAF prevention was high.
Conflict of interest statement
The authors have no conflicts of interest to declare.
Supplementary data
To read the full content of this article, please download the PDF.
