Abstract
Aims: We report the application of patient-specific computational models to plan the treatment of complex aortic re-coarctation (rCoA) with a proximal aberrant right subclavian artery in a patient who had previously undergone bare metal stenting.
Methods and results: Clinically acquired images were used to set up patient-specific computational models for finite element (FE) and fluid dynamics (CFD) analyses. The 3D geometry was reconstructed from computed tomography and echocardiography images. Computer-generated deployment of a CP covered stent (NuMED, Hopkinton, NY, USA) at different diameters was tested using FE simulations. CFD analyses based on preoperative magnetic resonance flow measurements allowed assessment of rCoA pressure relief and right subclavian artery perfusion in the different scenarios. The simulations suggested an expansion diameter for the CP stent (8 zigs, length=28 mm) of between 16 and 18 mm to relieve the obstruction, cover the aneurysm and maintain satisfactory flow to the right subclavian artery. Following the modelling study, a 16 mm CP covered stent was successfully implanted.
Conclusions: Patient-specific models can be successfully used to plan re-stenting of complex rCoA, showing the benefits of integrating computational techniques into patient management.
Introduction
Collaboration between engineers and physicians has led to recent advances in the emerging field of patient-specific modelling, which involves development of computational models of human pathophysiology to provide data relevant to the individual patient1,2. Most of the recent work in patient-specific modelling represents feasibility and/or preliminary validation studies on the modelling framework, whereas the application of this technology for treatment planning is often still missing.
This study aims to report the prospective use of patient-specific modelling to optimise the intervention in an individual with complex re-coarctation of the aorta (rCoA). The computational framework was developed by translating available clinical data into computer models and was further validated by comparison with clinical outcomes after the procedure.
Methods
The patient is a 19-year-old male with native CoA and an aberrant right subclavian artery originating next to the narrowing of the descending aorta (Figure 1, Moving image 1). The CoA was first treated with the insertion of a bare metal stent (at eight years of age), successfully re-dilated six years later. However, at the age of 18 years, follow-up echocardiography and catheter examination showed recurrent obstruction (9 mmHg gradient) and the formation of a small aneurysm in the proximal portion of the stent. A computed tomography (CT) scan was performed to capture the anatomical relationship between the different structures and a magnetic resonance (MR) investigation to assess the haemodynamics. Two-dimensional (2D) phase contrast images for flow measurements were acquired in the following planes: ascending aorta (AA), right common carotid artery (RCCA), left common carotid artery (LCCA), left vertebral artery (LVA), left subclavian artery (LSA), aberrant right subclavian artery (ARSA) and descending aorta (DA) at the level of the diaphragm (Figure 1).
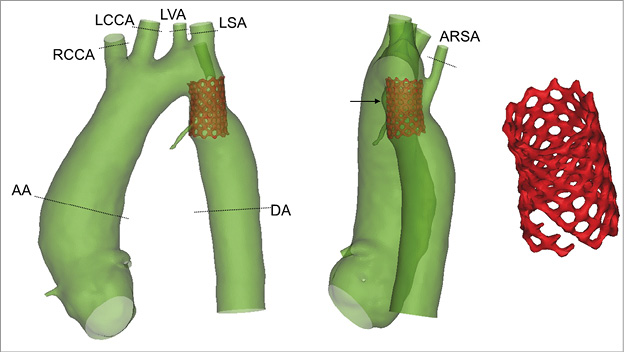
Figure 1. 3D anatomical reconstruction of the aortic anatomy with the aberrant right subclavian artery, the aneurysm (indicated by the arrow) and the previously implanted bare metal stent which presents fractures (right panel). The planes used for MR acquisition are highlighted.
CT images were further elaborated to create the in silico patient-specific 3D geometry (Figure 1, Moving image 1). Flows and velocities were extracted from the MR acquisitions. Catheterisation angiograms (Moving image 2) coupled with echocardiographic measurements were used to guide the reconstruction of the stenotic site. CW Doppler at the time of the MR showed a peak velocity of 3.6 m/s, which, considering the peak MR flow of 10.88 L/min, indicated an obstruction area of 0.5 cm2.
Structural and computational fluid dynamics (CFD) analyses were set up to simulate the insertion of a CP™ covered stent (NuMED, Hopkinton, NY, USA) and predict subsequent haemodynamic scenarios. First, a model of the stent was virtually expanded at different diameters in the patient-specific anatomy using finite element (FE) simulations to test stent anchoring, obstruction relief, aneurysm coverage and patency of the aberrant right subclavian artery (Figure 2). Second, the patient MR flow information before the procedure was used to set up and tune a 0D lumped parameter network (LPN), an electrical equivalent representation of the patient pre-implantation systemic circulation: the 3D aortic arch fluid dynamics were characterised using CFD simulations, and the LPN peripheral resistances and compliances were tuned to match the MR flows. Third, the 3D post-stenting geometries obtained from the FE analyses, hydraulically characterised, were plugged into the LPN, replacing the pre-implantation aortic arch equivalent to evaluate the patient-specific post-stenting fluid dynamics (Online Appendix).
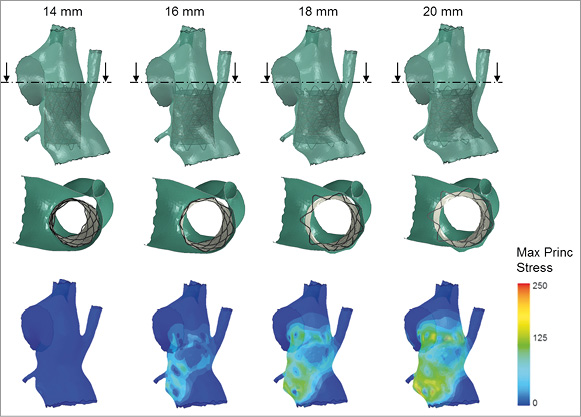
Figure 2. Results of the FE simulations replicating the expansion of the covered stent inside the CoA at four different diameters (14, 16, 18 and 20 mm). The second line shows a cross-section of the stented rCoA and the third line the stress distribution on the arterial wall due to the interaction with the stent. The stresses reflect amount of pressure exerted on the vessel wall by the contact with the different portions of the device. Safe anchoring and aneurysm coverage are achieved with all deployment diameters but 14 mm. The space between the covered stent and the arterial wall that allows for perfusion of the right subclavian artery diminishes with the increase in expansion diameter, thus potentially impinging on the flow towards this vessel.
Results
The 3D anatomical reconstruction from CT images allowed assessment of the patient morphological characteristics, aneurysm size (2.8 mm), position of the aberrant right subclavian artery origin, and bare metal stent diameter (14 mm). Fractures not previously identified were noticed in the distal portion of the bare metal stent (Figure 1).
The preoperative MR cardiac output was 5.25 L/min which was distributed according to the following proportions: RCCA=8.8%, LCCA=3.8%, LVA=1.7%, LSA=4.7%, ARSA=9.5% and DA=71.5%.
The configurations obtained after CP covered stent deployment at the four different sizes are shown in Figure 2 along with stress distributions. Full circumferential contact was not achieved when the device was expanded to 14 mm. At the other extreme, the 20 mm stent obstructed the origin of the aberrant right subclavian artery. Therefore, these two deployment sizes were disregarded as unsuitable for this case. The stents expanded at 16 and 18 mm showed safe anchoring to the arterial wall, good coverage of the aneurysm and no risk of obstruction of the aberrant right subclavian artery.
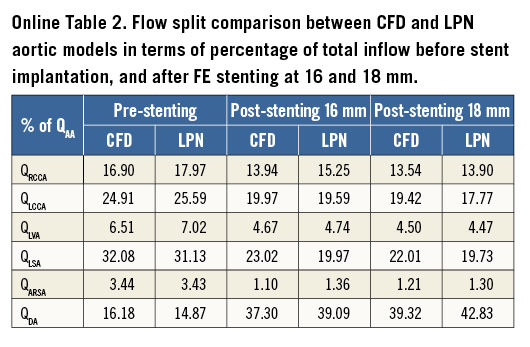
Pressure drops and flow data obtained from the CFD steady-state simulations were used for the 3D patient-specific anatomy hydraulic characterisation of both pre- and post-stenting anatomies. There was good agreement between the 3D CFD model and the LPN of the aorta before the operation and after virtual stenting, with maximum percentage difference in terms of flow split of 3.5% in the postoperative 18 mm model at DA.
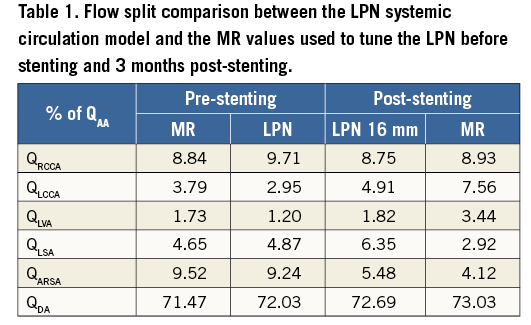
The pre-stenting full systemic circulation was modelled by extending the LPN with peripheral Windkessels, whose parameters were tuned by matching the MR fluid dynamics (Table 1). The pressure difference measured across the rCoA in the preoperative LPN was 8.27 mmHg.
When the 16 and 18 mm stent expansion anatomy equivalents were substituted in the extended LPN to simulate the post-procedural systemic circulation, there were negligible fluid-dynamic differences between the two configurations. The pressure gradient across the treated rCoA was reduced to 1.91 mmHg in the first case and to 1.81 mmHg in the second case.
Following the results of the FE and LPN simulations, a deployment of the covered CP stent between 16 and 18 mm diameter was suggested to the interventional cardiologist for the procedure.
INTERVENTION
The procedure was successfully carried out according to the planned strategy. Catheter measurements before stent implantation showed an increased gradient (15 mmHg) across the existing rCoA stent. The interventional cardiologists implanted the CP covered stent (8 zigs, length=28 mm) using an 18×45 mm balloon-in-balloon system to a final diameter of 16 mm, while simultaneously inflating an Opta Pro 7×20 mm balloon (Cordis, Johnson & Johnson, Warren, NJ, USA) in the aberrant right subclavian artery.
Analysis of the procedural biplane fluoroscopy images and 3D in situ stent reconstruction highlighted a maximum distance of 2.5 mm between the simulated (16 mm) and the in vivo geometry, and a diameter difference of 2.3% and 6.1% in the proximal and distal ring. Angiograms showed exclusion of the aneurysm and good perfusion of the aberrant right subclavian artery. Post-stenting mean pressure under general anaesthesia was 52 mmHg in the ascending aorta, and 51 mmHg in the descending aorta, indicating a reduced gradient across the stented rCoA.
The overall procedural results were predicted by the FE and fluid-dynamic analysis. The LPN findings which represented the immediate postoperative scenario were compared with the three-month follow-up MR flow data. The maximum difference in flow split was recorded in the LSA: 2.9% of the inflow from MR measurements vs. 6.3% from the LPN predictive model (Table 1).
Discussion
In this study, a patient-specific modelling methodology was developed to help clinicians select a successful strategy for the treatment of a case of complex rCoA with the presence of an aneurysm and origin of aberrant right subclavian artery at the level of the rCoA. With this work, we have shown the possibility and benefits of integrating computational modelling techniques into patients’ conventional clinical assessment to support the clinical care team and personalise treatment, validating the predictive nature of the model in terms of clinical outcome and post-procedural flow.
The modelling techniques adopted in this study provided supplementary information to the clinicians, thus improving their confidence in the procedure. The 3D reconstruction of the patient anatomy aided understanding of the 3D spatial relationships between the indwelling stent, the aberrant right subclavian artery, the aneurysm and the rest of the descending aorta. FE models allowed inexpensive testing of different scenarios within a virtual reality that realistically replicated the patient condition. The results of the virtual procedures could not only be visualised in 3D, but could also be quantified, thus enabling an extensive comparison between the different procedural options to confirm the feasibility of a stenting approach and its optimal sizing. FE analyses were used to identify the most favourable stent deployment diameter for this specific rCoA patient, to provide safe anchoring and aneurysm treatment. Fluid-dynamic simulations confirmed that favourable haemodynamic outcomes would have been achieved with the FE-indicated stent size, i.e., gradient reduction at the narrowing and patency of the aberrant right subclavian artery.
Importantly, in this patient-specific case, the computational models were all based on available clinical data acquired before the intervention. However, these were collected using different imaging modalities over one year. This might have been the source of the small discrepancies in the coupling of the anatomical model and the physiologically relevant boundary conditions.
Conclusions
In this study, a patient-specific modelling methodology was developed to help clinicians select a successful strategy for the treatment of a patient with recurrent CoA. This work showed the benefits of integrating prospective modelling techniques into the patient’s clinical assessment.
| Impact on daily practice Patient-specific computational modelling is becoming a powerful and recognised tool to help clinicians in planning complex interventions, even if routinely widespread use of this methodology is still dependent on further large-scale studies to enhance reliability and time performance. The work presented in this paper shows an example of how a validated modelling framework, which integrates different computational techniques, can be successfully used along with the conventional patient assessment to test different treatment scenarios and inform clinical decision making. |
Funding
This research is funded by the European Commission through the MeDDiCA ITN (www.meddica.eu, PITN-GA-2009-238113), Marie Curie actions under FP7, People Programme, the British Heart Foundation, the Royal Academy of Engineering/EPSRC, Heart Research UK and Rosetrees Trust.
This report is from independent research by the National Institute for Health Research Biomedical Research Centre Funding Scheme. The views expressed in this publication are those of the author(s) and not necessarily those of the NHS, the National Institute for Health Research or the Department of Health.
Conflict of interest statement
The authors have no conflicts of interest to declare.
Supplementary data
Moving image 1. 3D reconstruction of the preoperative rCoA anatomy from CT images.
Moving image 2. Pre-stenting angiographic images.
Appendix. Methods
FE ANALYSES
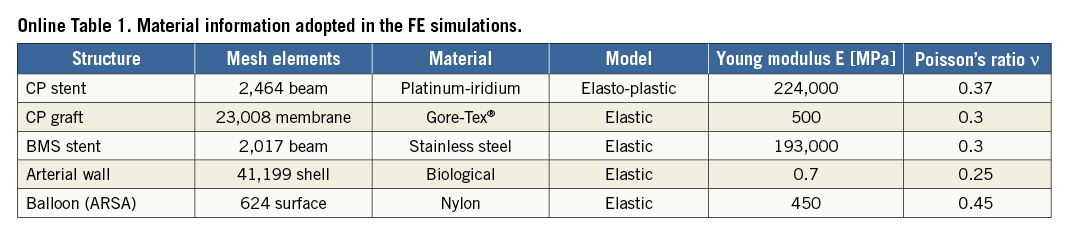
A computational model of a covered CP stent including five platinum-iridium rings and Gore-Tex® graft (crimped length=28 mm) was built and meshed for FE analysis (Online Table 1). The geometry of the bare metal stent already in situ was reconstructed from the CT images and an FE mesh of this stent was created with 0.33 mm strut thickness. An additional model was generated for an angioplasty balloon (diameter=3.5 mm, length=38.5 mm) to be inflated in the aberrant right subclavian artery to maintain its patency during the implantation of the covered CP stent according to the cardiologist’s plan for the procedure. Material parameters adopted for the different FE structures are reported in Online Table 1. Contact constraints were imposed between: the outer surface of the CP stent and graft, and the inner surface of the bare metal stent and of the arterial wall; the outer surface of the balloon, and the inner surface of the aberrant right subclavian artery and the outer surface of the CP stent and graft.
FE analyses were performed with Abaqus/Explicit (Simulia Corp., Johnston, RI, USA). The angioplasty balloon was inflated in the aberrant right subclavian artery (0.05 Pa pressure) and kept deployed throughout the implantation of the covered CP stent. The latter was positioned inside the bare metal stent model according to the cardiologist’s guidance. Pressure loads were applied to the internal surface of the stent/graft to achieve four different expansion diameters: 14, 16, 18, and 20 mm.
The following quantities were assessed: device configuration at the end of stent expansion relative to the origin of the aberrant right subclavian artery and to the aneurysm, and stress distribution on the arterial wall to evaluate whether an adequate contact was achieved between device and implantation site.
CFD PRE-INTERVENTION MODEL
The 3D preprocedural aortic arch anatomy was modified by adding cylindrical flow extensions to all outlets to guarantee fully developed flows at those sections. Tetrahedral element meshes were built using an adaptive mesh refinement to increase the accuracy of the solution in the regions of larger pressure variations. Following sensitivity analysis, the final mesh was made of 910,329 volumes.
CFD simulations were carried out using ANSYS Fluent software (ANSYS, Inc., Canonsburg, PA, USA). A second order upwind scheme was used for the solution of the Navier-Stokes momentum equations, with a standard spatial discretisation for the pressure, and an implicit least-square-cell-based discretisation for the gradient. A SIMPLE (Semi-Implicit Method for Pressure Linked Equations) pressure-velocity coupling algorithm was exploited. In all CFD simulations, the absolute convergence criterion was the residuals of mass and momentum conservation equations to be less than 10–4. Vessels were assumed to be rigid and a no-slip condition was imposed at the walls. For unsteady simulations, a time step of 10–4 s was applied, and five cardiac cycles were performed to ensure stability in the calculated solutions. The blood was modelled as a Newtonian fluid with a density ρ of 1,060 kg/m3 and a viscosity μ of 0.003 Pa·s.
In order to characterise the geometric resistances to the blood flow, a preliminary set of CFD steady simulations was carried out by varying the inlet velocity (0.05, 0.1, 0.2, 0.3, 0.5, 0.7, 0.8, 0.9 m/s), with a zero pressure condition at all outlets. The resulting pressure drops (ΔP) were divided by the flow rate streaming at every branch to characterise the hydraulic behaviour of the whole 3D geometry for different flow rates by linear or second order polynomial equations. Such equations were then used to implement an LPN representative of the preoperative 3D aortic arch anatomy of the patient (Online Figure 1). LPN equations were set up in the programming code C, and worked out with the compiler Bloodshed Dev C++ (Free Software Foundation, Inc., Boston, MA, USA). The ordinary differential equations in the LPN were solved with the explicit Euler time forward scheme, using a time step Δt of 10–4 s. To guarantee a stable solution, twenty cardiac cycles were simulated and the last chosen for post-processing the results.
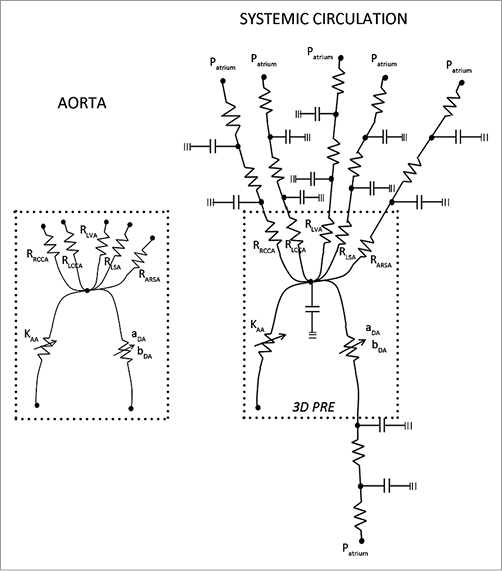
Online Figure 1. LPN equivalent representation of the patient 3D aortic arch and systemic circulation prior to the cover stenting procedure.
The equivalence between the 3D CFD and the LPN representation of the aortic arch and upper branches was verified by performing a time-variant simulation with equal boundary conditions in both models. The patient preoperative aortic flow, as measured from MR, was imposed at the inlet, while a zero pressure was imposed at all outlets. The results were then compared in terms of flow distribution (Online Table 2), flow waveforms at the outlets (Online Figure 2) and mean pressure.
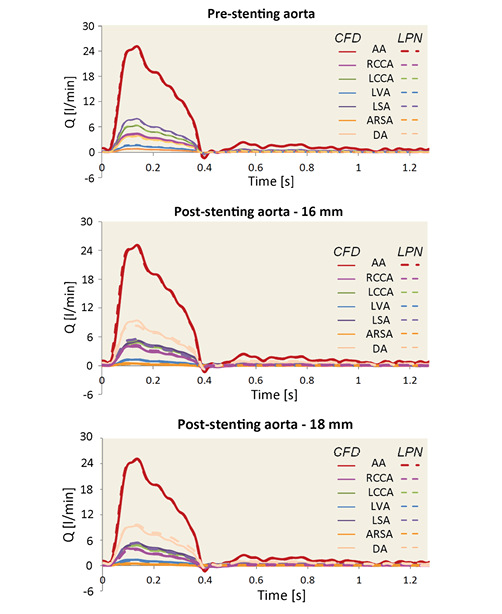
Online Figure 2. Flow comparison between the 3D CFD model (solid line) and the 0D LPN model (dotted line) of the preoperative and postoperative aorta with the stent expanded at 16 mm and 18 mm.
The LPN model was expanded to simulate the whole preoperative systemic circulation of the patient with the addition of two two-element (RC) Windkessel blocks per branch, representative of the arteriosus and venous systemic compartments (Online Figure 1). All branches were connected to the right atrium where a 5 mmHg constant pressure was assumed. The resistive and compliant parameters were tuned in order to achieve the same flow split and flow curves of the patient at the outlets when the patient inflow was imposed at the inlet of the LPN model.
CFD POST-INTERVENTION MODEL
The geometries resulting from the FE simulations were used to build a CFD 3D model of the postoperative lumen anatomies, including the arterial wall and the covered stent. The blood volume was meshed with over 910,000 tetrahedral elements with increased accuracy in the regions of higher pressure difference. A wall condition was assigned to the surface of the CP graft to avoid flow through it. The 3D postoperative morphologies were characterised hydraulically through a set of steady-state simulations as explained for the preprocedural model and an equivalent LPN was set up for each postoperative aorta.
Finally, to simulate the immediate post-stenting haemodynamics considering no remodelling of the peripheral circulation, the equations representing the preoperative aorta were replaced in the extended LPN of the systemic circulation with the new equations derived for the postoperative scenarios. Resulting fluid-dynamic differences between the covered stent expansion sizes were evaluated in terms of pressure gradient across the rCoA and percentage of the total flow going to the aberrant right subclavian artery and to the lower body.
Following computational analyses, the clinical intervention was performed, and peri- and post-procedural images were used to validate the computational predictions: in vivo stent position, deployed size and 3D geometry were derived from the biplane fluoroscopy images, pressure information from catheterisation data, and flows from a follow-up MR investigation three months after the intervention.
Limitations
With the objective of translating computational analyses to meet clinical needs, some modelling simplifications were adopted to reduce calculation time. In the FE analyses, a beam formulation was preferred to the conventional solid elements to model the stent structure, as the aim of the FE analyses was to predict the final configuration of the stented aorta. This could be achieved with beam elements even if this type of mesh does not provide detailed stress information on the stent itself. LPNs were preferred to multi-domain simulations to achieve fast simulation response. This approach did not allow visualisation of the local fluid dynamics, but still enabled quantification of those parameters of interest to answer the clinical question. The definition of the LPN through CFD, 3D model characterisation and peripheral parameter tuning was time-consuming but, once set up, presented the advantage of allowing very fast simulation of several different scenarios by regulating a limited number of parameters. The engineering analysis on this case from the time of CT acquisition to the delivery of the computational outcomes required five days of work by a dedicated researcher.
The modelling results were discussed during the multidisciplinary meeting together with the patient’s conventional clinical assessment, and contributed to the decision for this patient’s care. The study was also presented to the patient/parents before treatment and in the discharge letter, underlining how the modelling framework was considered useful by the clinicians: “We were also able to ask the engineers to perform computer modelling using finite element analysis, and they showed that there would be room to insert an 18 mm covered stent whilst protecting the origin of the right subclavian with a small balloon”.
The modelling outcomes were compared with the procedural and follow-up clinical data to evaluate the reliability of the developed computational framework in predicting stenting results. The FE expansion diameter differed by <7% compared to the real stent expansion as reconstructed from fluoroscopy images, largely depending on positioning differences. Fluid dynamic outcomes were in satisfactory agreement with the pressure values measured during catheterisation at the end of the procedure and with the flows acquired during follow-up MR.
Patient data were collected using the different imaging modalities over one year. This might be the source of the discrepancies in the coupling of anatomical model and physiologically relevant boundary conditions. The largest difference between computationally predicted and real flows was registered in the LSA (3.4%). However, the postoperative MR examination was performed three months after the intervention. In this period, the patient vascular resistances may have remodelled adapting to the new flow regime. Consequently, the flow distribution among the vessels could have changed accordingly. In terms of pressure, the gradient adopted in the implementation of the preoperative model was based on the last catheterisation available before the procedure, performed a year earlier than the CT and MR investigations.