Hiroyuki Kyono1, MD, Giulio Guagliumi2, MD, Vasile Sirbu2, MD, Noah Rosenthal1, MD, Satoko Tahara1, MD, PhD, Giuseppe Musumeci2, MD, Antonio Trivisonno2, MD, Hiram G. Bezerra1, MD, PhD, Marco A. Costa1*, MD, PhD, FACC, FSCAI
Abstract
Aims: We sought to evaluate the vascular response of stent struts deployed in bifurcation segments using optical coherence tomography (OCT).
Methods and results: This study is a sub-analysis of ODESSA, a prospective randomised trial designed to evaluate healing of overlapped drug-eluting stents (DES) vs. bare metal stents (BMS) (sirolimus SES: paclitaxel PES: zotarolimus ZES: Liberté BMS in a 2: 2: 2: 1 ratio) for de novo coronary artery stenosis. OCT was performed at 6-month follow-up. Bifurcation segments with side branch diameters larger than 1.5mm by angiography were analysed. The cross-sectional image at the bifurcation segment was divided into three regions: opposite to the ostium (OO), adjacent to the ostium (AO), or side-branch ostium (SO). Struts were classified in three categories: uncovered (U), covered (C), or proliferative (P). The incidence of each strut category was compared between regions and stent types. There were 12,656 struts in 61 bifurcation segments (PES: 16, SES: 14, ZES: 23, Liberté BMS: 8) from 46 patients obtained at six months. PES had the highest rate of U in SO region (PES 60.1, SES 17.0, ZES 13.2, BMS 12.3 (%), P<0.0001), whereas SES demonstrated the highest rate of U in OO (PES 3.8, SES 14.0, ZES 1.5, BMS 0.0 (%), P=0.0025).
Conclusions: This study demonstrates a variable pattern of strut coverage in the bifurcation among stent technologies, with a high percentage of PES floating struts remaining uncovered at 6-month follow-up.
Introduction
Drug-eluting stents (DES) significantly reduced target lesion revascularisation compared to bare-metal stents (BMS)1-5. However, percutaneous coronary intervention (PCI) of bifurcation remains associated with high restenosis and thrombosis rates in both BMS and DES6-11. While the distribution of de novo atherosclerosis development at coronary bifurcations has been well characterised12-14, little is known of the distribution of tissue growth after stenting.
Recently, the unique high resolution of optical coherence tomography (OCT) has enabled in vivo visualisation of coronary vessels at micron-scale levels to assess local vessel response and perform strut level evaluation to examine strut apposition and coverage15. ODESSA showed that the impact of DES on vascular healing was similar at overlapping and non-overlapping sites, but patterns of strut malapposition, coverage pattern and neointimal hyperplasia differed according to DES type (personal communication with Dr. G. Guagliumi: unpublished data presented at TCT 2008). The aims of this study were to compare tissue growth distributions at the site of coronary bifurcations between various DES and BMS, and evaluate tissue coverage on stent struts overlaying coronary bifurcations.
Methods
Study design, patients and procedures
The present study is a sub-analysis of the ODESSA trial. The ODESSA trial was designed as a single-centre, prospective, randomised, controlled, open-label trial with independent core lab imaging analyses. This subanalysis was not pre-specified in the study protocol. The core lab remained unaware of stent treatment assignments throughout the entire study. The study was conducted according to the principles of the Declaration of Helsinki. All patients gave written informed consent before procedure.
Eligible patients were older than 18-years old, presented with stable or unstable coronary syndromes. All had angiographic evidence of a long (>20 mm by visual estimate) de novo stenosis in a native coronary artery with 2.5-3.5 mm reference diameter requiring PCI with deployment of overlapping stents. Exclusion criteria included left main coronary artery disease, lesions in bypass grafts, ongoing or recent (<72 hours from symptom onset) myocardial infarction, previous stenting in the target vessel, left ventricular ejection fraction ≤ 30%, serum creatinine > 2.5 mg/dL, target vessel with a diameter ≥3.75 mm, extreme tortuosity, or an inability to comply with dual antiplatelet therapy and follow-up requirements.
Consecutive eligible patients were randomised in a 2:2:2:1 ratio to stent implantation with sirolimus-eluting stents (SES, Cypher, Cordis, Miami, FL, USA), paclitaxel-eluting stents (PES, Taxus Libertè, Boston Scientific, Natick, MA, USA), zotarolimus-eluting stents (ZES, Endeavor, Medtronic, Santa Rosa, CA, USA) or bare-metal stents (BMS, Libertè, Boston Scientific, Natick, MA, USA), respectively. Only a single type of stent was allowed in each patient.
Coronary angioplasty was performed according to standard PCI techniques using 6 Fr guide catheters. Direct stenting was allowed but not recommended; high pressure post-dilation was strongly encouraged, and use of glycoprotein IIb/IIIa inhibitors was left to the operator’s discretion. All patients were pretreated with aspirin 100 mg and clopidogrel 300 mg orally before PCI, followed by daily administration of 75 mg of clopidogrel for at least six months after discharge in addition to aspirin. During PCI, patients received unfractionated heparin to maintain an activated clotting time of 300 seconds or more. Cardiac enzymes were obtained before PCI and post-intervention, with measurements repeated every eight hours in the first 24 hours after the procedure. Patients had planned follow-up angiography and OCT imaging at 6±0.5 months.
The ODESSA trial represents a good model for evaluation of coverage of floating, intact stent struts crossing bifurcations as it did not require the treatment for side branches. The inclusion of long lesions provided a relatively high number of side branches jailed by stents.
Quantitative coronary angiography
Coronary angiograms at baseline, immediately after PCI and at follow-up were performed in at least two orthogonal views after 200 mcg intracoronary nitroglycerine. Digital coronary angiograms were analysed offline using a validated automated edge detection system (CAAS II, PIE Medical, Maastricht, The Netherlands) and previously reported methodology16. In brief, angiographic measurements were made in the same two projections at pre-, post- and follow-up images during diastole and using the contrast-filled guiding catheter for calibration. The entire stented segment plus 5-mm distal and proximal edges were selected for analysis. Reference vessel diameter (RVD), minimum luminal diameter (MLD), and lesion length were obtained.
Optical coherence tomography
OCT imaging was conducted at 6-month follow-up, and performed after 200 mcg intracoronary nitroglycerine injection. A time domain OCT system (M2CV OCT Imaging System, LightLab Imaging, Westford, MA, USA) and balloon occlusion technique were used as previously reported15.
Images were acquired with an automated pullback at a rate of 1.0 mm/sec, generating 15 frames per second. Multiple pullbacks were allowed in the event of suboptimal images. Images were digitally stored and submitted to the core lab for offline analysis.
Measurements of OCT cross-sectional images were performed using a dedicated automated contour-detection system (OCT system software B.0.1, LightLab). Strut-level qualitative OCT analysis was performed along the entire bifurcation segment in every frame.
Definition/anatomical measurement of bifurcation
Bifurcation segments that had a side branch (SB) larger than 1.5 mm in diameter on baseline angiography were selected for this study. Bifurcations jailed by overlapping stents were not included. Side branches treated with any type of intervention were excluded (Figure 1).
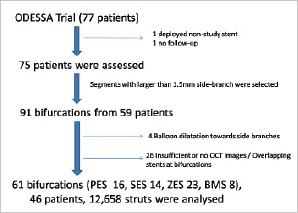
Figure 1. Flow chart of this study. PES: paclitaxel-eluting stent; SES: sirolimus-eluting stent; ZES: zotarolimus-eluting stent; BMS: bare-metal stent
The corresponding bifurcation segments on OCT images were selected for analysis. Bifurcation segments were confirmed with the guidance of longitudinal reconstruction of OCT. Longitudinally, the bifurcation segment was divided into proximal, mid and distal (Figure 2).

Figure 2. Typical optical coherence tomography longitudinal image (left panel) and its schema (right panel). Bifurcation segment is defined between the first and the last frame that the lumen contour is distorted by the side branch.
In order to evaluate axial tissue distribution, cross-sectional OCT images were divided in three regions: side branch ostium (SO), the 1/2 circumference of the vessel opposite to the ostium (OO), and the vessel wall adjacent to the ostium (AO) (Figure 3).
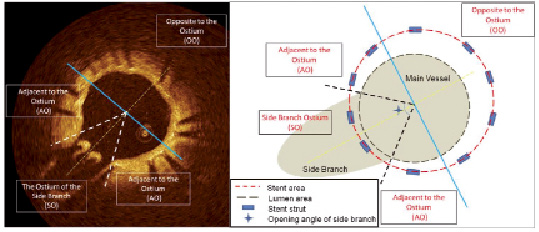
Figure 3. Typical example of OCT cross-sectional image (left panel) and its schema (right panel). To define each lesion, the additional line that divides the side branch into two equal parts and passes the centre of the main vessel (yellow dotted line) is drawn, then the perpendicular line that also passes the centre of the vessel (blue solid line) is used for dividing the vessel into the OO region and the others. Other additional lines that pass the centre of the main vessel and both edge of origin of the side branch (white dotted line in left panel, and black dotted line in right panel) are also used for define the AO and the SO region.
Length of the bifurcation segment in longitudinal images and the opening angle of side branch ostium in cross-sectional images were measured.
Cross-sectional lumen / stent area measurement
Lumen and stent areas at the proximal, mid and distal frames of the bifurcation segment were measured. Percent neointimal hyperplasia (%NIH) was calculated as ([stent area - lumen area] / stent area). Using a semi-automated algorithm, neointimal thickness (NIT) was calculated as the distance between lumen and stent area at every degree across the cross-sectional image circumference. NIT in AO and OO regions was compared for each stent type at each bifurcation segment (proximal, mid, distal).
Strut-level qualitative analysis
Struts were stratified according to their location. Struts located in the AO or OO regions were classified into two categories: uncovered (U) or covered (C). Struts located in the SO (i.e., floating) were classified into three categories: uncovered (U), covered only in the main vessel luminal surface (C), and proliferative (P) which required the strut to be fully encapsulated by tissue or tissue connecting adjacent struts (Figure 4). The percentage of U struts in the SO region was the primary endpoint of the study.
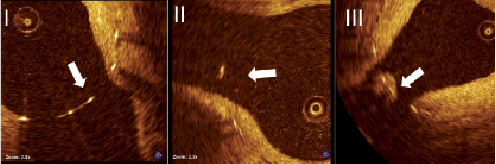
Figure 4. Representative image examples for strut coverage. I: uncovered (U); II: covered (C); III: proliferative (P).
The covering tissue on the floating struts in the SO region were also evaluated qualitatively and stratified based on surface smoothness and tissue texture. These characteristics were compared to the tissue covering struts located in the OO region as a reference (Figure 5):
Class I – smooth surface with a similar texture to the neointima located in OO
Class II – irregular surface with similar texture to neointima located in OO
Class III – smooth surface with different texture to neointima located in OO
Class IV – irregular surface with different texture to neointima located in OO
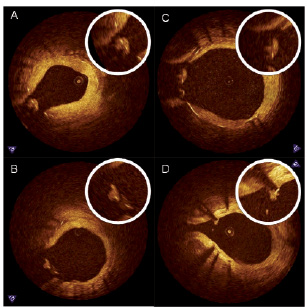
Figure 5. Representative image examples of qualitative assessment of neointima in the SO region. A: Class I, smooth surface with a similar texture to the neointima located in OO; B: Class II, irregular surface with similar texture to neointima located in OO; C: Class III, smooth surface with different texture to neointima located in OO; D: Class IV, irregular surface with different texture to neointima located in OO.
Statistical analysis
Continuous variables are expressed as mean ± standard deviation or median (5th-95th percentile) and categorical variables are reported as n (%). For per-patient and per-lesion analyses, continuous variables were compared with ANOVA and Student’s t-test, and categorical variables with chi-square test or Fisher’s exact test where appropriate. If the distributions were skewed, the nonparametric Mann-Whitney U-test was used. Given the hierarchical nature of the data (stent struts nested within section nested within bifurcation nested within patients), multilevel logistic regression with uncovered, covered, proliferative struts as the outcome variable was applied to address random and fixed effects at strut, frame, bifurcation and patient levels. At the struts level, location of the struts (AO, SO and OO) was considered. At the patient level, stent type (PES, SES, ZES and BMS) was considered.
All analyses were performed using Statistical Analysis Software (SAS) 9.1.3. (SAS Institute, Cary, NC, USA), with statistical significance set at the 0.05 level, and unadjusted P values reported throughout.
Results
There were 61 bifurcation segments (PES: 16, SES: 14, ZES: 23, Liberté BMS: 8) from 46 patients (PES: 13, SES: 12, ZES: 15, Liberté BMS: 6) with 12,656 struts (PES: 4,509, SES: 2,883, ZES: 3,937, Liberté BMS: 1,327) analysed from 6-month OCT follow-up studies.
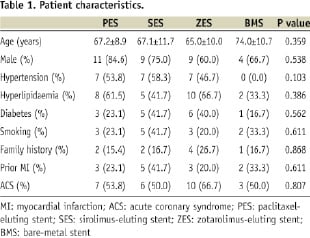
There were no significant differences in patient baseline characteristics between these four groups (Table 1).
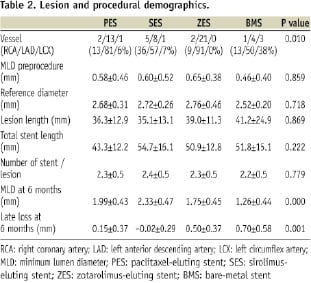
Lesion and procedural characteristics were also similar among these groups, except for target lesion location (Table 2).
Bifurcation segment length defined by 6-month OCT was longer in PES than any other stent type (PES 2.16±0.94, SES 1.65±0.53, ZES 1.32±0.46, BMS 1.33±0.70 (mm), P=0.001). The opening angle of the side branch ostia in OCT cross-sectional images showed no differences among the four stent types (PES 89.0±22.1, SES 85.8±17.2, ZES 72.1±22.0, BMS 89.3±24.8 (degrees), P=0.056).
OCT measurements
SES showed the largest lumen area and least %NIH among the four stent groups (Table 3). Longitudinally, percent NIH were similar between proximal and distal bifurcation segments in all stent groups except for the PES, which showed more %NIH and NIT in the distal compared with proximal segment (Tables 3, 4).
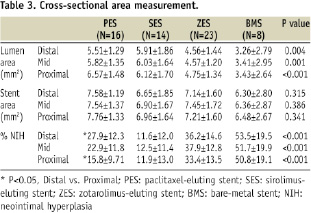
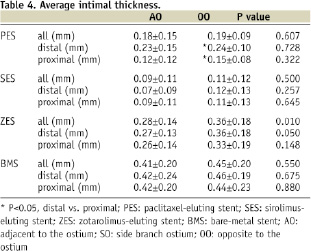
OCT analysis of the axial distribution of tissue growth showed similar NIT between OO and AO in the proximal and distal frames in all stents, except for the distal segment in ZES which showed higher NIT in AO than in OO region (Table 4).
Strut-level OCT analysis
There were no differences in total strut number per frame in each region between groups (Table 5). Both PES and SES showed higher overall rates of U per frame and in the AO region (Table 5).

Rates of uncovered floating struts were frequent in the side branch ostium even in the BMS group (12.3%). However, PES had > 3 times the rate of U struts in the SO compared with other stent types (Figure 6).
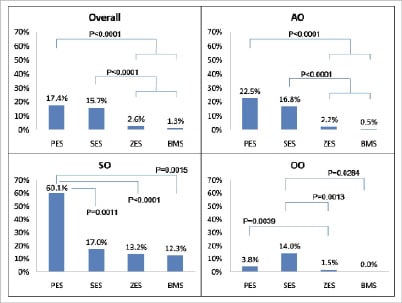
Figure 6. Rates of uncovered strut in each region. PES: paclitaxel-eluting stent; SES: sirolimus-eluting stent; ZES: zotarolimus-eluting stent; BMS: bare-metal stent.
Distribution patterns of uncovered struts were unique to each stent type. PES had exceedingly higher rates of uncovered struts in the SO compared with AO and OO regions. SES had a more evenly distribution of uncovered struts (Table 5), with similarly high rates of uncovered struts ranging from 14 to 17% among the three regions. Uncovered struts in the ZES and BMS were primarily observed in the SO regions, with very low frequencies observed in the AO and OO regions.
Qualitative assessments of the covering tissue on floating struts located in the SO region are shown in Figure 7. Both PES and SES had high rates of class IV tissue coverage, whereas class I was the dominant presentation in both ZES and BMS.
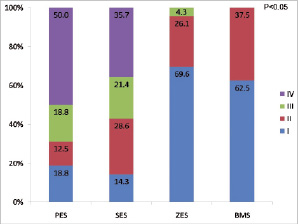
Figure 7. Optical coherence tomography qualitative assessments of the covering tissue on floating struts located in the SO region. I: class I; II: class II; III: class III; IV: class IV; PES: paclitaxel-eluting stent; SES: sirolimus-eluting stent; ZES: zotarolimus-eluting stent; BMS: bare-metal stent
Inter-observer variability showed high agreement for strut stratification by coverage (Kappa=0.767) and for evaluation of covering tissue on the floating strut (Kappa=0.908). Intra-observer variability also demonstrated high concordance for strut stratification by coverage (Kappa=0.885) and for evaluation of covering tissue on the floating strut (Kappa=0.906).
Discussion
The present study reports a detailed OCT analysis on distribution of tissue growth at coronary bifurcations six months after implantation of different DES and BMS platforms. OCT revealed a variable pattern of vascular response according to each stent platform, illustrated by the differences in the amount and characteristics of the tissue covering floating struts at the bifurcation.
Depending on drug potency and polymer biocompatibility, DES may suppress neointimal growth at the cost of a delayed healing process, with lower rates of endothelial stent coverage, more persistent fibrin deposits and an increased inflammatory response in non bifurcation segments of animal models17,18.
Pathological post mortem analyses from human coronary arteries suggest bifurcation stenting to be an important risk factor of stent thrombosis, but did not determine the degree and pattern of strut coverage in stents deployed at the bifurcation19,20.
Bifurcation PCI has become common clinical practice in spite of its higher risk of restenosis and stent thrombosis compared to other coronary stenting indications21. A number of factors have been proposed to explain the somewhat worse outcomes observed after bifurcation PCI22-28. The present study provides additional mechanistic insights into the vascular response to different types of stent struts jailing coronary side branches. OCT revealed that strut coverage varies between regions of the bifurcation in terms of both degree of coverage and characteristics, regardless of stent type (Table 5). There was a trend towards more pronounced NIT in the AO segments of ZES, without differences between proximal and distal segments. Conversely, PES had higher %NIH in the distal compared to proximal segments of the bifurcation, without differences between AO and OO regions. These findings may suggest that rheological factors influence the degree and pattern of strut coverage in coronary bifurcations in addition to drug and polymer properties. Furthermore, the study revealed different patterns of strut coverage between stents platforms, with the majority (60.1%) of PES floating struts at the bifurcation remaining uncovered at 6-month follow-up. The study also revealed that 12.3% of BMS floating struts are still uncovered after six months. Previous study showed that PES struts overlying side branches had a significantly higher frequency of poor endothelialisation scores than SES in pig model, which supports our data29.
While PES showed longer bifurcation segment lengths than other stent groups, an explanation for the above finding in PES bifurcations may be the result of reduced NIT and %NIH proximal compared to the distal segment of the bifurcation (Tables 3, 4). These findings may also represent malapposition in the proximal bifurcation segment as the vessel begins to diverge. Further studies with larger sample size, longer follow-up period and comparing post procedure and follow-up OCT images would be necessary to define the mechanisms associated with such findings and how it impacts on clinical outcomes.
Conventional OCT imaging does not allow accurate discrimination of tissue characteristics30, but it allows qualitative comparison of surface smoothness and tissue texture between regions in the same cross-sectional image as a surrogate to differentiate normal (Class I) from abnormal (Class IV) tissue appearance. PES showed the highest incidence of abnormally appearing tissue coverage onto floating struts at the origin of the side branch. In contrast, both ZES and BMS did not show any class IV tissue coverage of floating struts.
The reasons for the different patterns and quantity of tissue covering PES floating struts at the bifurcation are unclear, but it may be explained by the characteristics of the stent, drug and polymer properties and dosage. Approximately 90% of the drug remains within the polymer of PES which may result in persistent NIH suppression. Further, stent design and/or strut distribution may also influence the vascular healing process31-33. Independent of its precise mechanism, the abnormal tissue coverage of floating PES observed by OCT is intriguing, and may support the higher rates of side-branch occlusions and reduced side-branch flow observed in the PES versus BMS at 9-month follow-up in TAXUS V trial34. However, a cause-effect relationship between OCT findings and clinical outcomes cannot be determined in the present study, and a much larger prospective and longer follow-up study with both OCT and clinical outcome measures would be required to draw definitive conclusions.
Limitations
Sample size is relatively small, in spite of a large number of bifurcations and struts analysed, which precludes proper association between OCT findings and clinical outcomes. However, this study was designed to describe the patterns of vascular response after stenting and provides further insights into the mechanisms of PCI failure in coronary bifurcation.
In this study, we investigated the fate of the stent struts overlying non-treated bifurcations. Thus, it remains unclear OCT detected strut-level vascular response in treated bifurcations.
Histological characterisation of different tissue classes cannot be determined, as OCT characterisation of tissue onto struts is not validated in humans. However, the use of a reference tissue (OO region) may help depict tissue appearance heterogeneity within the same cross-section and standardise comparisons between groups.
Funding sources
Supported by Ospedali Riuniti di Bergamo, Bergamo, Italy, University Hospitals of Cleveland and Case Western Reserve University, Cleveland, USA, with grant support from Medtronic Vascular, Santa Clara, USA, Boston Scientific Corporation, Natick, USA. None of the sponsors were involved in data analysis, manuscript drafting or approval.