Abstract
Background: Successful restoration of epicardial coronary artery patency by primary percutaneous coronary intervention (PPCI) for ST-elevation myocardial infarction (STEMI) does not always lead to adequate reperfusion at the microvascular level.
Aims: This study sought to investigate the association between lipid-rich coronary plaque identified by near-infrared spectroscopy combined with intravascular ultrasound (NIRS-IVUS) and microvascular obstruction (MVO) detected by cardiac magnetic resonance imaging (MRI) after PPCI for STEMI.
Methods: We investigated 120 patients with STEMI undergoing PPCI. NIRS-IVUS was used to measure the maximum lipid core burden index in 4 mm (maxLCBI4 mm) in the infarct-related lesions before PPCI. Delayed contrast-enhanced cardiac MRI was performed to evaluate MVO one week after PPCI.
Results: MVO was identified in 40 (33%) patients. MaxLCBI4 mm in the infarct-related lesion was significantly larger in the MVO group compared with the no-MVO group (median [interquartile range]: 745 [522-853] vs 515 [349-698], p<0.001). A multivariable logistic regression model showed that maxLCBI4 mm was an independent predictor of MVO (odds ratio: 24.7 [95% confidence interval: 2.5-248.0], p=0.006). Receiver operating characteristic curve analysis demonstrated that maxLCBI4 mm >600 was the optimal cut-off value to predict MVO (Youden index=0.44 and area under the curve=0.71) with a sensitivity of 75% and a specificity of 69%.
Conclusions: Lipid content measured by NIRS in the infarct-related lesions was associated with the occurrence of MVO after PPCI in STEMI.
Introduction
Primary percutaneous coronary intervention (PPCI) salvages myocardium in patients with acute myocardial infarction (AMI). However, successful restoration of epicardial coronary artery patency does not always lead to adequate reperfusion at the microvascular level as a result of microvascular obstruction (MVO)1, which can be diagnosed by cardiac magnetic resonance imaging (MRI). On late gadolinium enhancement MRI, MVO areas are seen as central foci of low signal or hypoenhancement within an avidly enhancing site of MI. Because of the excellent correlation with histopathology2, MRI has become a reference method for the assessment of MVO. Previous studies have shown that MVO is associated with adverse ventricular remodelling and a worse prognosis3. Therefore, the prediction and prevention of MVO are clinically important.
In addition to ischaemic and reperfusion injuries, mechanical obstruction of the microcirculation due to distal embolisation of atherosclerotic plaque material during PPCI is a significant pathogenesis of MVO1. Certain plaque phenotypes are susceptible to distal microembolism and MVO. Specifically, ruptured plaques might be fragile and easily broken during PPCI, predisposing to MVO4. Near-infrared spectroscopy combined with intravascular ultrasound (NIRS-IVUS) is a dual-modality intravascular imaging technique that enables identification of the lipid composition of coronary atherosclerotic plaques. NIRS-IVUS has been rigorously validated against autopsy specimens and is now established as a method to identify lipid-rich plaques accurately in patients undergoing coronary catheterisation5.
The purpose of the present study was to investigate the association between lipid-rich plaque identified by NIRS-IVUS and MVO detected by cardiac MRI after PPCI for ST-elevation myocardial infarction (STEMI).
Methods
STUDY POPULATION
This was a single-centre observational study at Wakayama Medical University, Wakayama, Japan. Between December 2019 and June 2020, we included patients with STEMI within six hours of symptom onset who needed PPCI. STEMI was defined by ischaemic discomfort presenting with new ST-segment elevation on the electrocardiogram and elevated troponin levels on the basis of the fourth universal definition of MI6. We excluded patients with cardiogenic shock, previous MI, previous coronary bypass surgery, chronic kidney disease defined as estimated glomerular filtration rate <30 ml/min/1.73 m2, and metallic implants. This study was approved by the Wakayama Medical University Ethics Committee. All patients provided informed consent for participation in the present study prior to catheterisation.
NIRS-IVUS
NIRS-IVUS (TVC Imaging System MC10 with 50 MHz Dualpro catheter; Infraredx, Burlington, MA, USA) was routinely used during PPCI in the study period. NIRS-IVUS was performed within the infarct-related vessel after establishment of Thrombolysis In Myocardial Infarction (TIMI) flow grade 37 using balloon angioplasty with a small balloon (≤2.0 mm in diameter) and/or aspiration thrombectomy with a 5.1 Fr aspiration catheter. If TIMI flow grade 3 was not achieved, balloon angioplasty and/or aspiration thrombectomy were repeated. The NIRS-IVUS catheter was advanced distally to the infarct-related lesion over a 0.014-inch conventional angioplasty guidewire. The NIRS-IVUS imaging core was retracted to the coronary ostia at a rate of 2.0 mm/s using an automatic pullback device. The TVC Imaging System provided simultaneous colour-coded NIRS spectral data co-registered with IVUS images in a single pullback. The NIRS-IVUS images were stored digitally for subsequent analysis.
NIRS-IVUS analysis was performed using an off-line review system with semi-automated contour-detection software (CAAS Intra Vascular; Pie Medical Imaging, Maastricht, the Netherlands) by an experienced investigator (K. Terada) who was blinded to angiography and cardiac MRI findings. Plaque rupture was defined by a cavity in the vessel wall with disruption of the intima8. Attenuation was defined by a signal reduction behind hypoechoic plaque without calcium8. The attenuation angle was measured on a cross-section at 1 mm longitudinal intervals. Attenuation length was measured on a longitudinal view. Attenuation index (API, mm˚) was defined as the mean attenuation angle multiplied by its length and subsequently normalised to account for any differences in imaged segment lengths between subjects (Supplementary Appendix 1),9. Calcification was defined by a bright echo with acoustic shadowing8. External elastic membrane (EEM), lumen, and plaque and media (P&M, defined as EEM-lumen) areas and plaque burden (defined as P&M area/EEM area x 100) were measured on a cross-section at 1 mm longitudinal intervals. Remodelling index was calculated as EEM area at the minimum lumen area site divided by the average of the proximal and distal reference EEM areas8. Positive remodelling was defined by a remodelling index >1.05. NIRS data were automatically displayed on a chemogram demonstrating the distribution of lipid within the coronary artery in a longitudinal view as well as a cross-sectional view combined with IVUS images. The chemogram showed the probability of lipid every one pixel by using 128 colour tones that transition from red (indicating low probability) to yellow (indicating high probability). In the longitudinal chemogram, lipid content was quantified as the lipid core burden index (LCBI), defined as the fraction of valid pixels indicating lipid at the probability >0.6 within the scanned region multiplied by 1,000. The maximum LCBI in 4 mm (maxLCBI4 mm) was defined as the maximum value of the LCBI for any 4 mm region in the infarct-related lesion10. The lesion-LCBI was defined as the total LCBI throughout the infarct-related lesion10.
PPCI AND ANGIOGRAPHY
Before coronary catheterisation, patients received oral aspirin 200 mg (loading dose) and prasugrel 20 mg (loading dose). On the day after the PPCI, aspirin 100 mg (maintenance dose) and prasugrel 3.75 mg (maintenance dose) were administered once daily. Thrombolysis was not performed for any patient. Glycoprotein IIb/IIIa inhibitors were not used because they were not approved in Japan. During coronary catheterisation, patients received intravenous heparin (a bolus of 100 IU/kg and additional doses aimed at achieving an activated clotting time of 250-300 s).
PPCI was performed in a standard manner using a second-generation drug-eluting stent (XIENCE; Abbott Vascular, Santa Clara, CA, USA).
Angiograms before and immediately after PPCI were analysed using QAngio XA version 7.1 (Medis, Leiden, the Netherlands) by an experienced investigator (H. Emori) blinded to NIRS-IVUS and MRI findings. Quantitative coronary angiography (QCA) included the reference lumen diameter, minimum lumen diameter, and percent diameter stenosis. TIMI flow grade, Rentrop’s collateral flow grade, no-reflow (defined as TIMI flow grade 0, 1 or 2), distal embolisation (defined as a distal filling defect with an abrupt cut-off in the infarct-related artery) and myocardial brush grade were evaluated according to established definitions7.
>MRI
Cardiac MRI was performed as part of daily clinical practice at one week after PPCI to assess MVO, left ventricular function, and infarct size. All patients were examined at rest in the supine position with a whole-body 1.5-T MRI scanner (Intera Achieva; Philips Medical Systems, Best, the Netherlands) equipped with a five-element cardiac phased-array coil for signal reception. All images were obtained with electrocardiographic gating in contiguous short-axis slices and representative long-axis slices of the left ventricle during repeated breath-holds. Contrast-enhanced MRI was performed 10 min after intravenous injection of 0.1 mmol/kg gadolinium diethylenetriamine pentaacetic acid. We optimised the inversion time (200 to 300 ms) to nullify healthy myocardium.
MRI analysis was performed using an offline workstation (View Forum; Philips, Berlin, Germany) by two independent observers (M. Takahata and Y. Ino) who were blinded to angiography and NIRS-IVUS findings. Left ventricular ejection fraction (LVEF), end-diastolic volume, and end-systolic volume were calculated from cine MRI. Infarct size was defined as an area of hyperenhancement on delayed enhanced images and calculated by automatic summation of all slice volumes of delayed enhanced regions and expressed as a percentage of left ventricular volume11. Transmural extent of infarction was graded as 1 (1-25% of wall thickness), 2 (26-50%), 3 (51-75%) or 4 (76-100%)12. MVO was identified on delayed enhanced images as a late hypoenhancement signal within the myocardial wall surrounded by a hyperenhanced region and was included in the calculation of total infarct size13. MVO size was calculated by summation of all slice volumes of manually defined MVO regions and expressed as a percentage of left ventricular volume13. The MVO adjudication was made by the consensus of the two observers. The interobserver and intraobserver kappa coefficients for MVO were 0.904 and 0.945, respectively. A representative case with MVO is shown in Figure 1.
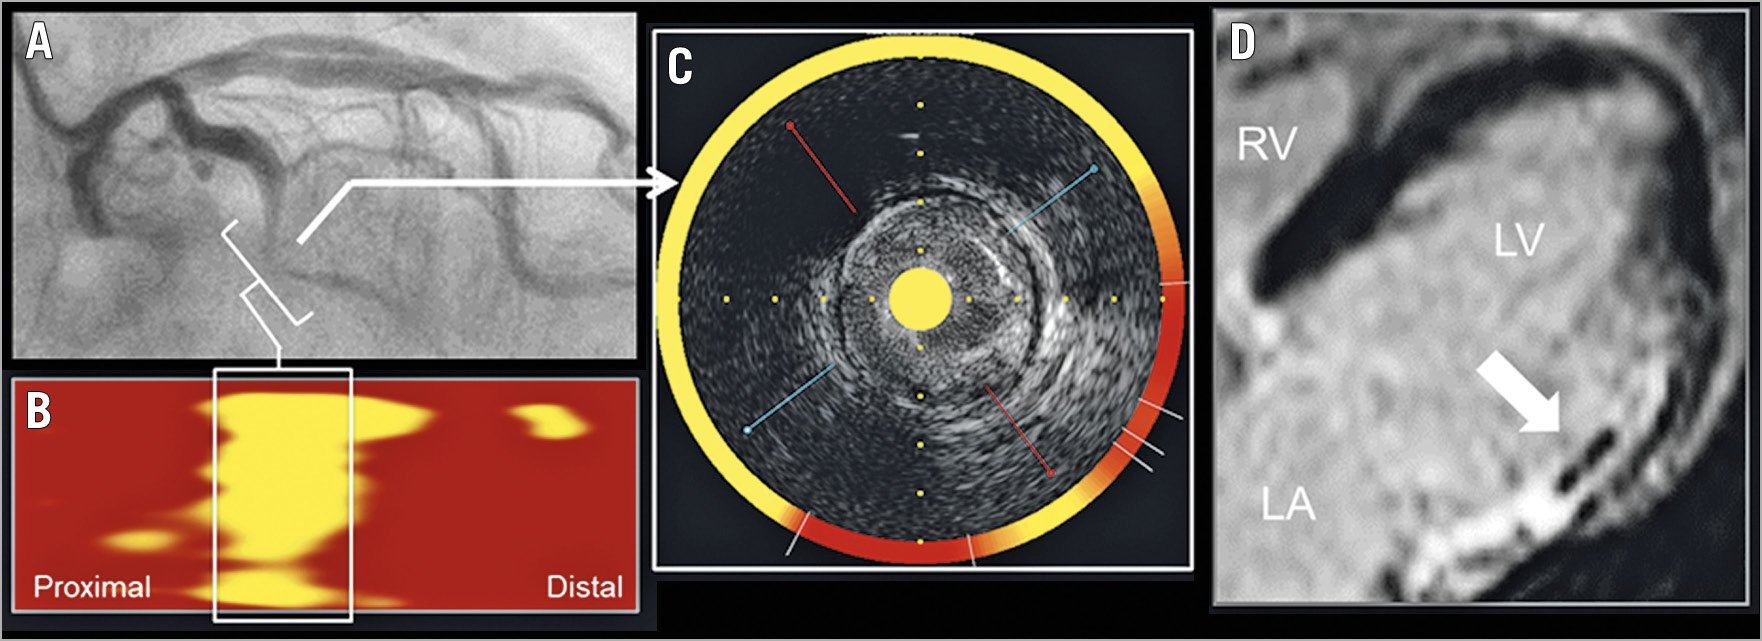
Figure 1. Representative case with MVO. Angiography before PPCI in STEMI demonstrated a subtotal occlusion in the mid left circumflex coronary artery (A, brackets). NIRS chemogram showed a large lipid-rich plaque with maxLCBI4 mm of 881 in the infarct-related lesion (B, box; and C, arrow). Contrast-enhanced MRI at one week after PPCI demonstrated MVO in the lateral left ventricular wall (D, arrow). LCBI: lipid core burden index; MVO: microvascular obstruction; NIRS: near-infrared spectroscopy; PPCI: primary percutaneous coronary intervention; STEMI: ST-elevation myocardial infarction
STATISTICAL ANALYSIS
Statistical analysis was performed using JMP 13.0 (SAS Institute, Cary, NC, USA). Categorical variables are presented as frequency and percentages, with comparison with chi-square statistics or Fisher’s exact test (if the expected cell value was <5). Continuous variables are presented as median and interquartile range (IQR) and compared using the Mann-Whitney U test. A multivariable logistic regression model was used to determine predictors of MVO. The model included pre-infarction angina, Killip class ≥2, plaque rupture, and maxLCBI4 mm before PPCI. Results are reported as odds ratios (ORs) with 95% confidence intervals (CIs). Receiver operating characteristic curve analysis was performed to determine the optimal cut-off value of maxLCBI4 mm, maximum attenuation angle, and attenuation length for predicting MVO. The maximum Youden index was used as a criterion for selecting the optimal cut-off value. The area under the curve (AUC), accuracy, and sensitivity were also calculated in the ROC curve analysis. A p-value <0.05 was considered statistically significant.
Results
PATIENT CHARACTERISTICS
During the study period, we performed PPCI in 173 patients with STEMI. Of these, 30 patients were excluded due to cardiogenic shock (n=9), previous MI (n=2), previous coronary bypass surgery (n=3), chronic kidney disease (n=11), and metallic implants (n=5). In addition, 23 patients were excluded due to no stent use for PPCI (n=11), technical failure to deliver NIRS-IVUS catheter (n=5) and poor MRI image quality due to inadequate breath holding or other involuntary physiological motion (n=7). Thus, 120 patients constituted the final study population. MVO was identified in 40 (33%) patients by cardiac MRI.
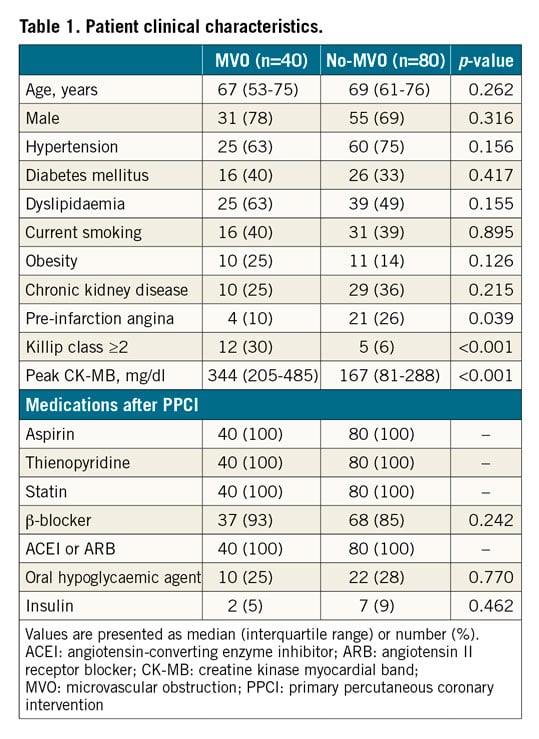
Patients’ clinical characteristics are shown in Table 1. Age, gender, coronary risk factors and medications after PPCI were not different between the MVO group and the no-MVO group. The frequency of pre-infarction angina was significantly lower (10% vs 26%, p=0.039), and the frequency of Killip class ≥2 (30% vs 6%, p<0.001) was significantly higher in the MVO group compared with the no-MVO group. Peak serum creatine kinase myocardial band level after PPCI was significantly higher in the MVO group compared with the no-MVO group (344 mg/dl [IQR: 205-485 mg/dl] vs 167 mg/dl [IQR: 81-288 mg/dl], p<0.001).
ANGIOGRAPHY AND PROCEDURE
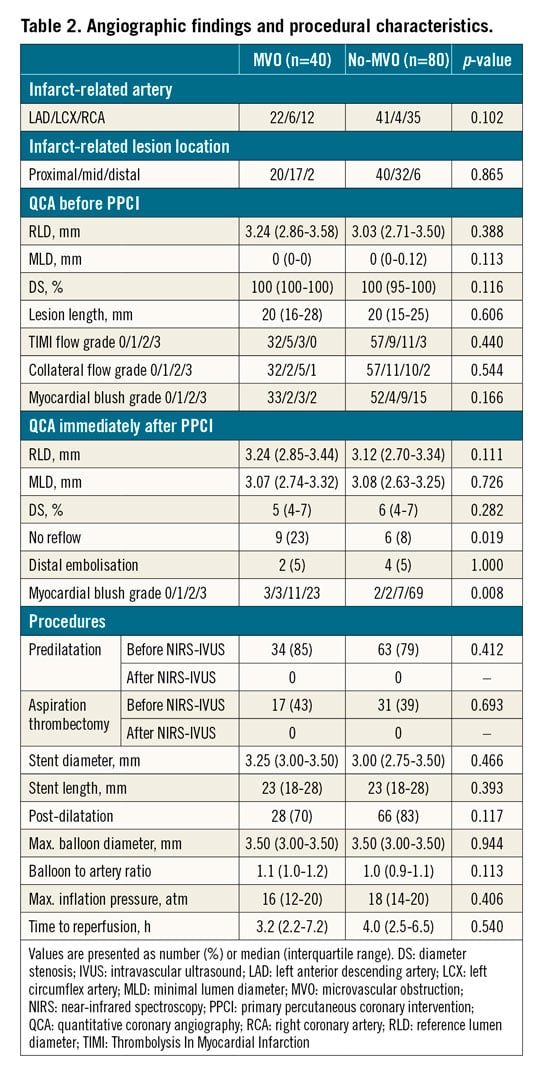
Angiographic findings and procedural characteristics are shown in Table 2. Angiographic findings before PPCI and procedural characteristics were not different between the two groups. Residual percent diameter stenosis immediately after PPCI was similar between the two groups. The frequency of no reflow was significantly higher in the MVO group compared with the no-MVO group (23% vs 8%, p=0.019). The frequency of distal embolisation was similar, but the myocardial blush grade immediately after PPCI was different between the two groups (p=0.008).
NIRS-IVUS
NIRS-IVUS findings are shown in Table 3. The frequency of plaque rupture was significantly higher in the MVO group compared with the no-MVO group (65% vs 38%, p=0.004). Although the frequency of attenuation was not different between the two groups, the maximum attenuation angle (194˚ [IQR: 104-282˚] vs 108˚ [IQR: 54-185˚], p=0.002), attenuation length (6.9 mm [IQR: 4.0-11.2 mm] vs 4.6 mm [IQR: 2.2-8.9 mm], p=0.013) and API (900 mm˚ [IQR: 104-1,566 mm˚] vs 133 mm˚ [IQR: 2-822 mm˚], p=0.003) were significantly larger in the MVO group compared with the no-MVO group. The frequency of calcification was similar in the two groups.
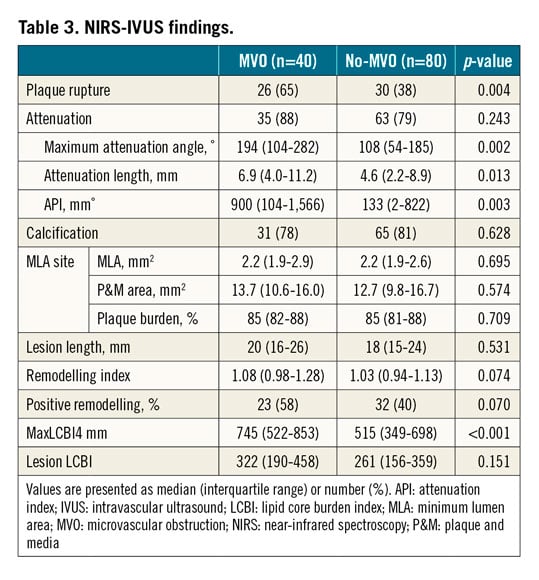
At the minimum lumen area site, lumen area, P&M area, and plaque burden were not different between the two groups. Lesion length was similar between the two groups. Remodelling index (1.08 [IQR: 0.98-1.28] vs 1.03 [IQR: 0.94-1.13], p=0.074) and the frequency of positive remodelling (58% vs 40%, p=0.070) were numerically greater in the MVO group compared with the no-MVO group, but the differences did not reach statistical significance. MaxLCBI4 mm (745 [IQR: 522-853] vs 515 [IQR: 349-698], p<0.001) was significantly larger in the MVO group compared with the no-MVO group (Central illustration). Lesion LCBI (322 [IQR: 190-458] vs 261 [IQR: 156-359], p=0.151) was not different between the two groups.
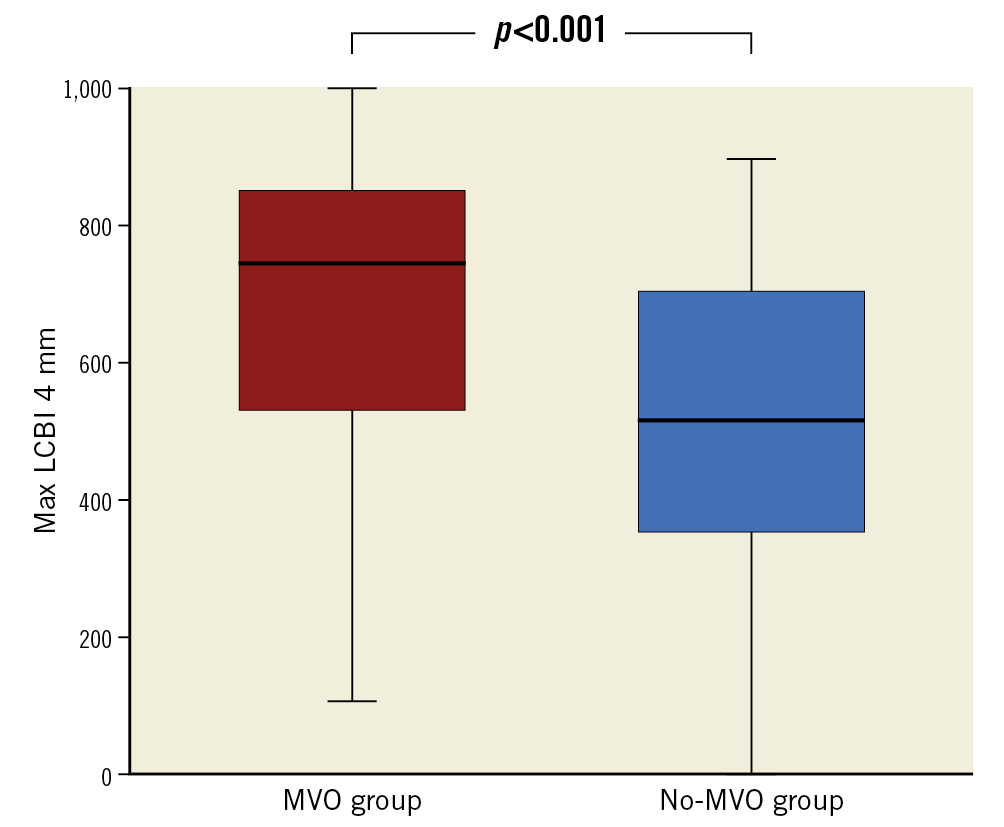
Central illustration. Comparison of maxLCBI4 mm between the MVO group and the no-MVO group. MaxLCBI4 mm in the infarct-related lesions before PPCI was significantly larger in the MVO group compared with the no-MVO group. LCBI: lipid core burden index; MVO: microvascular obstruction; PPCI: primary percutaneous coronary intervention
MaxLCBI4 mm was positively correlated with API (R=0.493, p<0.001) (Supplementary Figure 1). MaxLCBI4 mm (R=0.378, p<0.001) and API (R=0.295, p=0.001) was positively correlated with MVO size (Supplementary Figure 2, Supplementary Figure 3).
MRI
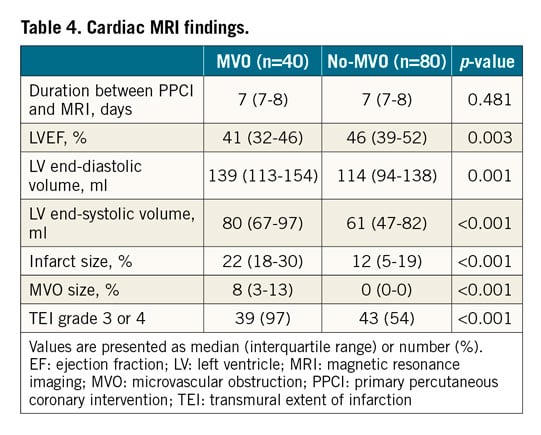
Cardiac MRI findings are shown in Table 4. Duration between PPCI and MRI was similar between the two groups. LVEF was significantly lower in the MVO group compared with the no-MVO group (41% [IQR: 32-46%] vs 46% [IQR: 39-52%], p=0.003). LV end-diastolic volume (139 ml [IQR: 113-154 ml] vs 114 ml [IQR: 94-138 ml], p=0.001), LV end-systolic volume (80 ml [IQR: 67-97 ml] vs 61 ml [IQR: 47-82 ml], p<0.001), and infarct size (22% [18-30%] vs 12% [5-19%], p<0.001) were significantly larger in the MVO group compared with the no-MVO group. The frequency of the transmural extent of infarction grade 3 or 4 was significantly higher in the MVO group compared with the no-MVO group (97% vs 54%, p<0.001).
MULTIVARIABLE LOGISTIC REGRESSION MODEL FOR MVO
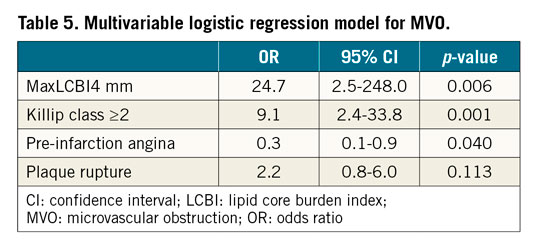
MaxLCBI4 mm (OR: 24.7 [95% CI: 2.5-248.0], p=0.006), Killip class ≥2 (OR: 9.1 [95% CI: 2.4-33.8], p=0.001) and pre-infarction angina (OR: 0.3 [95% CI: 0.1-0.9], p=0.040) were independent predictors of MVO (Table 5). Plaque rupture was not correlated with MVO in this model (OR: 2.2 [95% CI: 0.8-6.0], p=0.113) (Table 5).
OPTIMAL CUT-OFF VALUES
ROC analysis is shown in Figure 2. MaxLCBI4 mm >600 was the optimal cut-off value to predict MVO with a sensitivity of 75% and a specificity of 69%. Maximum attenuation angle >182˚ predicted MVO with a sensitivity of 60% and a specificity of 73%. Attenuation length >3.0 mm predicted MVO with a sensitivity of 85% and a specificity of 45%. API >347 mm˚ predicted MVO with a sensitivity of 68% and a specificity of 65%. The AUC was numerically largest in maxLCBI4 mm >600, followed by maximum attenuation angle >182˚, API >347 mm˚ and attenuation length >3.0 mm (0.71, 0.67, 0.67, and 0.64, respectively).
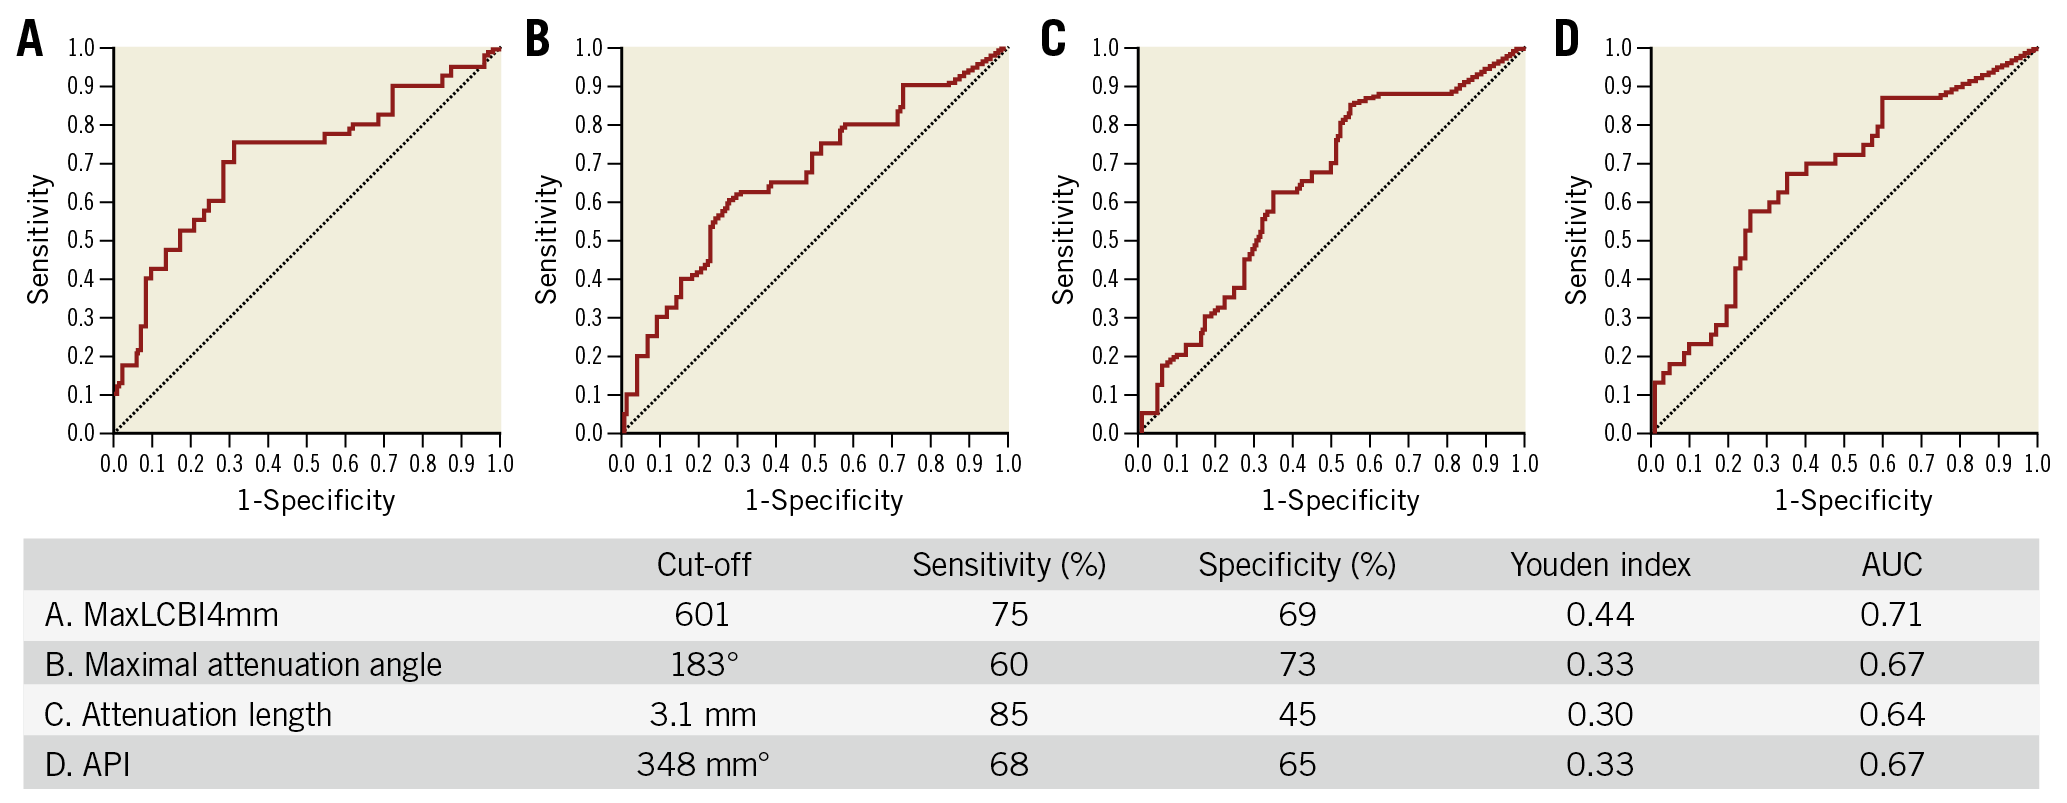
Figure 2. Receiver operating characteristic curve analysis for predicting MVO. A) MaxLCBI4 mm. B) Maximum attenuation angle. C) Attenuation length. D) API. API: attenuation index; AUC: area under the curve; LCBI: lipid core burden index; MVO: microvascular obstruction
Discussion
The major findings in the present study are as follows. 1) MaxLCBI4 mm measured by NIRS in the infarct-related lesion was independently associated with the occurrence of MVO after PPCI in STEMI. 2) MaxLCBI4 mm >600 was the optimal cut-off value to predict MVO. These results indicate that NIRS might offer a significant opportunity to predict MVO after PPCI in STEMI.
PREDICTORS OF MVO
Certain intravascular imaging characteristics of infarct-related lesions have been reported to be associated with MVO after PPCI. Greyscale IVUS-derived attenuated plaque (defined by maximum attenuation angle of >180˚ and attenuation length of >5 mm) showed an increased risk of MVO14. Optical coherence tomography-derived thin-cap fibroatheroma (defined by both maximum lipid arc of >90˚ and minimum fibrous cap thickness of <70 μm) and plaque rupture were highly predictive of MVO4,15. Although these greyscale IVUS and optical coherence tomography findings are determined by subjective operator interpretation and quantitative manual measurement in core laboratory analysis, LCBI in NIRS is automatically and quickly measured during PPCI in the catheterisation laboratory. Therefore, the maxLCBI4 mm >600 in NIRS is a simple and objective method for predicting MVO in the clinical setting.
LIPID-RICH PLAQUE IN NIRS
The value of LCBI measured by NIRS is associated with complications of PCI16. Several NIRS observations showed that PCI for high LCBI plaques resulted in slow/no-flow phenomenon17. In addition, a previous NIRS study demonstrated that PCI for plaques with maxLCBI4 mm ≥500 showed a 50% risk of periprocedural MI (95% CI: 28-62), compared with only a 4.2% risk (95% CI: 0.8-11) for plaques with a lower maxLCBI4 mm18, though a NIRS registry showed no significant association between lipid-rich plaque and periprocedural events19. The present study extends the findings of these prior investigations in two important ways. First, whereas the prior studies associated NIRS findings with elevated cardiac enzymes after PCI, the present study is the first to demonstrate an association between NIRS findings in the infarct-related lesions and MVO by MRI. Second, the prior studies were characterised by a paucity of patients with STEMI. Hence, the present study is the first to associate NIRS findings in STEMI at the time of PPCI with the occurrence of MVO demonstrated by MRI one week later. Taken collectively with the findings of prior studies, these results consistently suggest that the identification of lipid-rich plaques by NIRS is useful in the risk stratification for PCI complications presumably due to distal micro-embolisation during the procedure.
CLINICAL IMPLICATION
Several MRI studies have investigated the late clinical outcomes of AMI patients with MVO. A meta-analysis of the MRI studies showed that MVO was associated with lower LVEF and adverse LV remodelling3. In addition, MVO was demonstrated to have a strong relationship with cardiac death, recurrent MI, and congestive heart failure/heart failure hospitalisation3. The present study showed that maxLCBI4 mm measured by NIRS in the infarct-related lesions was an independent predictor of MVO. Our result suggests that NIRS has a potential ability to predict late clinical prognosis of patients with AMI.
Limitations
There are several limitations that should be acknowledged. First, some MVOs may have developed before PPCI. However, MRI before PPCI is impractical in patients with STEMI. Second, the manipulation of the guidewire and imaging catheter and predilatation before imaging may have caused distal embolism and MVO and reduced the maxLCBI4 mm. However, the impact of those manipulations on MVO development is considered to be very limited. Third, there was a large overlap in maxLCBI4 mm between the MVO group and the no-MVO group. If the maxLCBI4 mm is within the overlap range, the combination of maxLCBI4 mm and other predictors (i.e., pre-infarction angina, Killip class ≥2, and plaque rupture) should be considered for accurate prediction of MVO. Fourth, NIRS-IVUS was not performed after PPCI. Therefore, the association between the change in maxLCBI4 mm due to PPCI and MVO could not be evaluated. Fifth, the present study has no long-term clinical prognostic data. Finally, it is not yet known how NIRS findings identified prior to PCI might be used to prevent MVO. In a prior randomised study, the use of a distal embolic protection device during PCI of lesions with a maxLCBI4 mm >600 did not reduce the occurrence of periprocedural MI20. This trial included only a single patient with STEMI and did not investigate the occurrence of MVO; further research is needed to develop methods to prevent MVO in STEMI patients using NIRS-IVUS guidance.
Conclusions
Lipid content measured by NIRS in the infarct-related lesions was associated with the occurrence of MVO after PPCI in STEMI.
|
Impact on daily practice NIRS might be useful in the risk stratification of STEMI patients undergoing PPCI, because MVO is associated with lower LVEF, adverse LV remodelling, and poor clinical prognosis. |
Conflict of interest statement
R.D. Madder has received speaker honoraria and research support from Infraredx and serves on the advisory board of SpectraWAVE. The other authors have no conflicts of interest to declare.
Supplementary data
To read the full content of this article, please download the PDF.