A 70 year-old diabetic female with a history of hyperlipidaemia treated with statin therapy underwent coronary angioplasty of her right coronary artery (RCA, Figure 1).
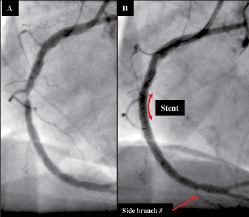
Figure 1. RCA (A) pre- and (B) post-stenting.
Post-procedure the RCA was assessed using, for the first time, a combination intravascular ultrasound (IVUS) and near infrared spectroscopy (NIRS) catheter, which indicated that the proximal end of the stent was located in an area of lipid core plaque (Figure 2 and Video 1); a potential risk factor for stent thrombosis.1
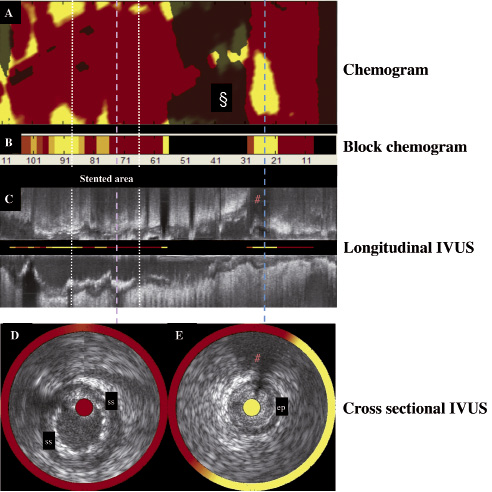
Figure 2. The combined IVUS images and NIRS chemical information obtained from a single pullback through the RCA using the combination catheter. (A) The chemogram obtained from the NIRS is a map of the measured probability of lipid core plaque (LCP) from each scanned arterial segment. Yellow represents regions with the highest probability for the presence of LCP, whilst red regions represent those the lowest. The chemogram displays pullback position (x-axis) against circumferential position (y-axis) of the measurement in degrees. The § denotes a blacked-out region near a side branch where the NIRS system was unable to obtain a reliable signal. (B) The block chemogram provides a summary of all measurements (approximately 160) made for each 2 mm length of the chemogram. Increasing probability of LCP is indicated by a four colour display (from red indicating low likelihood of LCP to dark orange to light orange to yellow). (C) The longitudinal IVUS pullback, with NIRS block chemogram values in the centre. The lilac and blue lines mark the corresponding positions on the IVUS, and the chemogram (Figure 2A) during pullback, illustrating the ability of the system to co-localize plaque structure and composition. The proximal end of the stent is located in an area with a strong signal for lipid. The # indicates the side branch, identified in Figures 1B and 2E. (D) Transverse IVUS image obtained within the stented area demonstrates well opposed clearly identifiable stent struts (ss). The corresponding location on the longitudinal IVUS, and chemogram is denoted by the iliac line. The red colours on both the chemogram, which is displayed as a circular band surrounding the IVUS image, and the block chemogram, which is shown in the centre of the IVUS image indicate that there is a low probability of lipid in this area of the stent. (E) Transverse IVUS image obtained distal to the stent at the location indicated by the blue line on Figures 2A and 2C. The IVUS image demonstrates the presence of echolucent plaque between 1 and 7 o’clock. The chemogram displays a high probability of lipid in this plaque with a circumferential distribution (yellow ring surrounding the IVUS image).
Prospective studies are needed to assess the risk of ending a stent in a fibroatheroma, and to investigate the use of NIRS-IVUS to determine the optimal landing zone for a stent. In this manner, the co-localization of lipid core with structure may provide useful information that will enhance the safety of stenting and, with prospective studies, increase the ability to correctly identify plaque at risk of rupture.
Reference
Online data supplement
Video 1. IVUS images with the corresponding NIRS chemograms (circular band around IVUS) and block chemograms (centre of IVUS image) obtained during pullback through the implanted stent.
Supplementary data
To read the full content of this article, please download the PDF.
Moving image 1.