Abstract
Aims: A recurrent finding of trials on renal sympathetic denervation is a certain percentage of non-responders. The aim of this study was to examine the influence of arterial stiffness to predict response.
Methods and results: Eighty-eight patients were included in the study. Arterial stiffness was measured by invasive pulse wave velocity. Antihypertensive medication had to be unchanged during follow-up. Ambulatory blood pressure measurement (ABPM) was used to record blood pressure before and six months after denervation. Fifty-eight patients without changes in medication were included in the final analysis. Responders (n=37; blood pressure reduction –12.8±6.4 mmHg) had a significantly lower pulse wave velocity (14.4±4.4 m/s versus 17.7±4.5 m/s; p=0.009) compared to non-responders (n=21; blood pressure reduction +3.0±4.5 mmHg; p<0.001 for comparison with responders). In multivariate analysis, invasive pulse wave velocity was the only significant predictor of blood pressure reduction after denervation (odds ratio 1.15, 95% confidence interval [CI] 1.014-1.327; p=0.03). Patients with increased stiffness were older (p=0.001), had a higher prevalence of diabetes (p=0.008), more often had isolated systolic hypertension (p=0.007), and had a higher invasive pulse pressure (p<0.001).
Conclusions: Patients with lower pulse wave velocity showed a significantly better response to denervation. These findings emphasise that pulse wave velocity might be used as a selection criterion for renal denervation.
Introduction
Over recent years, percutaneous renal sympathetic denervation (RSD) has been developed as an interventional treatment option for patients with treatment-resistant hypertension. Resistant hypertension is associated with a 50% higher risk of the occurrence of cardiovascular events1. Mechanistically, modulation of efferent and afferent renal sympathetic nerve fibres is believed to improve renal regulatory functions and blood flow as well as to attenuate the central sympathetic activity2,3.
Initial enthusiasm over the effectiveness of the therapy4-8 has been offset by the negative results of the largest randomised study to date (SYMPLICITY HTN-3 trial) and the observation of a certain percentage of patients in whom RSD was not followed by a reduction in blood pressure (BP) (“non-responders”) in nearly all trials9,10.
As the genesis of arterial hypertension is multifactorial, a uniform treatment response to RSD in all patients cannot be expected11. Given the invasiveness with potential side effects and the cost of the therapy, it is highly desirable to identify patients who will benefit from RSD prior to the intervention. So far, analyses of markers predicting treatment response have focused mainly on such factors as patients’ medical history, technical aspects of the procedure and the quantification of sympathetic activity10,12-14.
Another factor influencing the presence and time course of arterial hypertension is arterial stiffness (AS). Reduction in vessel distensibility is based on a progressive remodelling of the vascular wall and predisposes to an increased risk for cardiovascular mortality and morbidity15,16. The role of stiffness in the pathogenesis of hypertension is controversial as data point to the fact that increased AS is not solely a consequence of but a main contributor to the development of arterial hypertension17. Pulse wave velocity (PWV) has been shown to be the most reliable parameter for quantification of AS15.
Only few data exist on the role of vascular factors in patients treated with RSD, and the value of PWV to predict the response to RSD is unclear18-21.
The aim of the present study was therefore to determine the clinical characteristics of patients with increased AS undergoing RSD and to examine the role of invasive (i) PWV as a surrogate for AS in predicting the outcome of RSD.
Methods
STUDY POPULATION AND BLOOD PRESSURE MEDICATION
Consecutive patients who underwent RSD at the University of Leipzig – Heart Center between January 2012 and February 2014 underwent concomitant invasive measurement of PWV. RSD was performed on the grounds of resistant hypertension defined as mean daytime systolic BP ≥135 mmHg or diastolic BP ≥90 mmHg in 24-hr ambulatory blood pressure measurement (ABPM) despite the intake of at least three antihypertensive agents, including one diuretic22. Antihypertensive medication had to be unchanged during the four weeks before RSD and had to remain constant until completion of the six-month follow-up. Patients with changes in antihypertensive medication during the follow-up period (dosage and/or class) were excluded from the analysis. Patients with a renal anatomy unsuitable for denervation, severe renal artery stenosis, or an estimated glomerular filtration rate (eGFR) <45 ml/min per 1.73 m² (Modification of Diet in Renal Disease equation) were excluded. The study was performed according to the 1975 Declaration of Helsinki and “good clinical practice” guidelines and was approved by the local ethics committee. All patients provided written informed consent.
AMBULATORY BLOOD PRESSURE MEASUREMENT
ABPM was performed using a validated oscillometric device (Spacelabs model 90207; Spacelabs Healthcare GmbH, Feucht, Germany). BP recordings were performed every 15 minutes during the day (7.00 am-10.00 pm) and every 30 minutes during the night (10.00 pm-7.00 am) according to the latest European Society of Cardiology (ESC) guidelines22. The software CardioNavigator Version 2.4.13 (Del Mar Reynolds Medical, Hertford, UK) was used to analyse the BP recordings.
RENAL DENERVATION
RSD was performed with the Symplicity Flex™ catheter (Medtronic, Minneapolis, MN, USA) according to a standardised protocol, which has been used in large-scale clinical trials and has been described previously4. In brief, four to six complete ablation runs of two minutes were delivered to each renal artery. The ablation points were placed circumferentially to the renal artery wall. All patients received intravenous remifentanil to control pain. All procedures were performed by three experienced interventional cardiologists (>20 supervised procedures).
MEASUREMENT OF ARTERIAL STIFFNESS
AS was estimated by invasive measurements of PWV as previously described15. A 6 Fr sheath was placed in the right femoral artery and a 4 Fr pigtail catheter (Cordis, Johnson & Johnson, Warren, NJ, USA) in the ascending aorta. The foot-to-foot method was used to determine invasive PWV (iPWV). The time difference between the foot of the pressure waves (located by the intersection of the manually constructed tangent to the maximum systolic upstroke and a horizontal line through the minimum of the waveform) in the ascending aorta and the femoral artery was measured (Figure 1). The pulse waves were recorded at 200 mm per second. The distance between the point of measurement within the ascending aorta and the point of measurement at the femoral sheath was derived from the length of the pigtail catheter from the tip to the femoral sheath. After marking the pigtail catheter at the point where it leaves the sheath, the pigtail catheter was cut at this point and the distance from the centre hole at the tip towards the proximal cut end was measured. Invasive PWV was calculated according to the following equation: v=pigtail-length/(foot-to-foot distance [m]/recording speed [m/sec]).
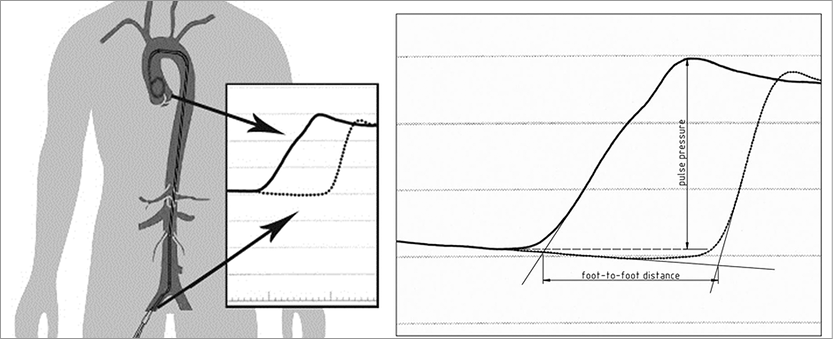
Figure 1. Method of measuring invasive pulse wave velocity. The waveforms in the ascending aorta and femoral artery and the foot-to-foot measurement of PWV and pulse pressure in the ascending aorta.
Invasive pulse pressure was measured from the foot of the pressure wave in the ascending aorta to the top of the wave. Both methods are illustrated in Figure 1. The average of three measurements was used to calculate invasive PWV and pulse pressure. One investigator (T. Okon), who was blinded to the results of BP recordings, performed all analyses. All distances were re-measured by a second investigator blinded to other patient study results. Reproducibility of PWV measurements was tested by the use of Bland-Altman limits of agreement. The reproducibility coefficient was calculated as 1.96 times the SD of the differences, as proposed by Bland and Altman23.
In the early phase of the RSD programme at the University of Leipzig – Heart Center, a subset of patients underwent re-catheterisation after six months for exclusion of renal artery stenosis. In these patients, iPWV was determined again.
Definitions
ABPM was repeated six months after RSD. Response to RSD was defined as a reduction of ≥5 mmHg in systolic daytime 24-hr blood pressure (ABPM). Any patient who did not fulfil this criterion was considered a non-responder.
Isolated systolic hypertension was defined as a daytime systolic BP >140 mmHg and a diastolic BP <90 mmHg in 24-hr ABPM.
STATISTICAL ANALYSIS
Continuous data are expressed as mean±standard deviation, and categorical data are expressed as number of patients and percentage. Categorical variables were compared using Fisher’s exact test and the independent samples t-test was used for continuous variables. Data were tested for normal distribution by the D’Agostino-Pearson omnibus normality test.
Baseline clinical characteristics were compared between responders and non-responders. PWV and pulse pressure according to the response to RSD are illustrated with box-and-whisker plots. Univariate and multivariate binary logistic regression analysis was performed to determine predictive factors of non-response. All variables with a probability value (p-value) <0.05 in univariate analysis were included in multivariate analysis. To analyse PWV as a predictor for response, a receiver operating characteristic curve (ROC curve) was plotted. The ROC curve was quantified by the area under the curve (AUC). In addition, the patient population was divided into two groups according to the median iPWV. A two-tailed p-value <0.05 was defined as statistically significant. All analyses were performed with SPSS, Version 20.0 (IBM Corp., Armonk, NY, USA).
Results
A total of 88 patients with resistant hypertension underwent RSD. Changes in antihypertensive medication during follow-up occurred in 30 patients, resulting in a final study population of 58 patients. All 58 patients underwent at least four complete ablation points at each side, circumferentially placed in the renal artery. There were no adverse events during the intervention or the follow-up period. All patients completed six-month ABPM. A total of 37 patients (63.8%) were classified as responders to RSD, 21 patients (36.2%) as non-responders.
BASELINE CLINICAL CHARACTERISTICS
Baseline characteristics, stratified by responders and non-responders according to the response to RSD, are displayed in Table 1. Patient populations did not differ significantly regarding cardiovascular risk factors, baseline BP values or antihypertensive medication. However, duration of hypertension was significantly longer in non-responders compared to responders (14.4±9.6 versus 22.4±15.7 years; p=0.043). There were no differences in the number of ablation points between the two patient cohorts (right artery: 5.2 points in responders vs. 5.4 in non-responders; p=0.598; left artery: 5.4 vs. 5.5; p=0.760). The changes of BP are demonstrated in Table 2.
PULSE WAVE VELOCITY AND PULSE PRESSURE IN RESPONDERS AND NON-RESPONDERS
Non-responders showed significantly higher iPWV as compared to responders (17.7±4.7 m/s versus 14.4±4.4 m/s; p=0.009) (Figure 2A). Accordingly, invasive pulse pressure was numerically increased in non-responders without reaching statistical significance (103.8±24.4 mmHg versus 90.1±27.6 mmHg; p=0.064) (Figure 2B).
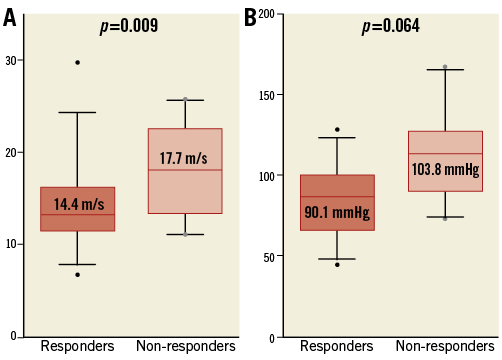
Figure 2. Parameters of arterial stiffness with reference to responders and non-responders. A) The invasive pulse wave velocity and (B) invasive pulse pressure, according to responders and non-responders to RSD in two box-and-whisker plots.
REPRODUCIBILITY OF PULSE WAVE VELOCITY MEASUREMENTS
Overall, there was a good agreement of interobserver measurements. Bland-Altman limits of agreement were narrow with a reproducibility coefficient (given in percent of the average value) of 4.2% and limits of agreement of –0.72 and 0.6 m/s. There was no significant bias (p=0.243). The Bland-Altman plot is shown in Figure 3.
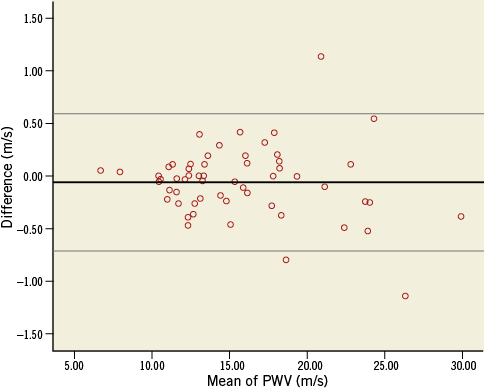
Figure 3. Bland-Altman plot for interobserver variability. Bland-Altman plot for the difference between two measurements of two different investigators. The thicker black line shows the mean difference, the thin lines demonstrate the 95% limits (–0.72; 0.6 m/s).
PREDICTIVE VALUE OF PULSE WAVE VELOCITY FOR RESPONSE TO RENAL SYMPATHETIC DENERVATION
Univariate binary logistic regression analysis identified duration of hypertension and iPWV as predictors for being a non-responder (Table 3). However, in multivariate analysis, iPWV remained the only significant predictive factor (Table 3). The value of iPWV as a predictor of response to RSD was further evaluated by generating an ROC curve (Figure 4). It yielded an AUC of 0.79 (95% CI: 0.658-0.882; p<0.0001). Using a cut-off of 13.7 m/s resulted in a sensitivity of 71% and a specificity of 83% with a positive predictive value of 85.7% for response.
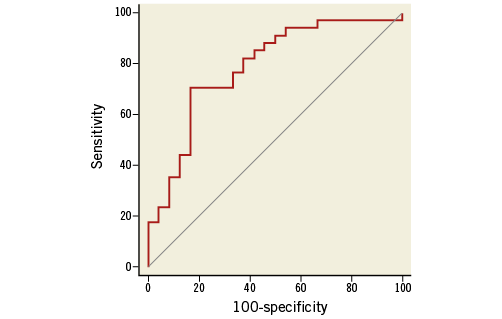
Figure 4. Receiver operating curve of invasive pulse wave velocity for the prediction of response to RSD. The ROC curve of sensitivity and 100-specificity of the PWV as a predictor of response to RSD (AUC=0.786 [95% CI: 0.658-0.882]; p<0.0001).
PULSE WAVE VELOCITY BEFORE AND AFTER RSD
A subset of 23 patients (of whom six were non-responders) underwent repeat catheterisation at six months. This patient population was part of a previously published study6. Renal angiographies excluded renal artery stenosis or dissection in all patients. There was no significant change of iPWV before and six months after RSD (14.3±4.7 m/s vs. 14.2±3.6 m/s; p=0.8471) in these patients. The change in PWV did not differ between responders (0.3 m/s) vs. non-responders (0.13 m/s; p=0.961).
CHARACTERISTICS OF PATIENTS WITH ARTERIAL STIFFNESS
The characteristics of patients with AS, defined as PWV >median of 14.4 m/s, are shown in Table 4. Compared to patients with a PWV
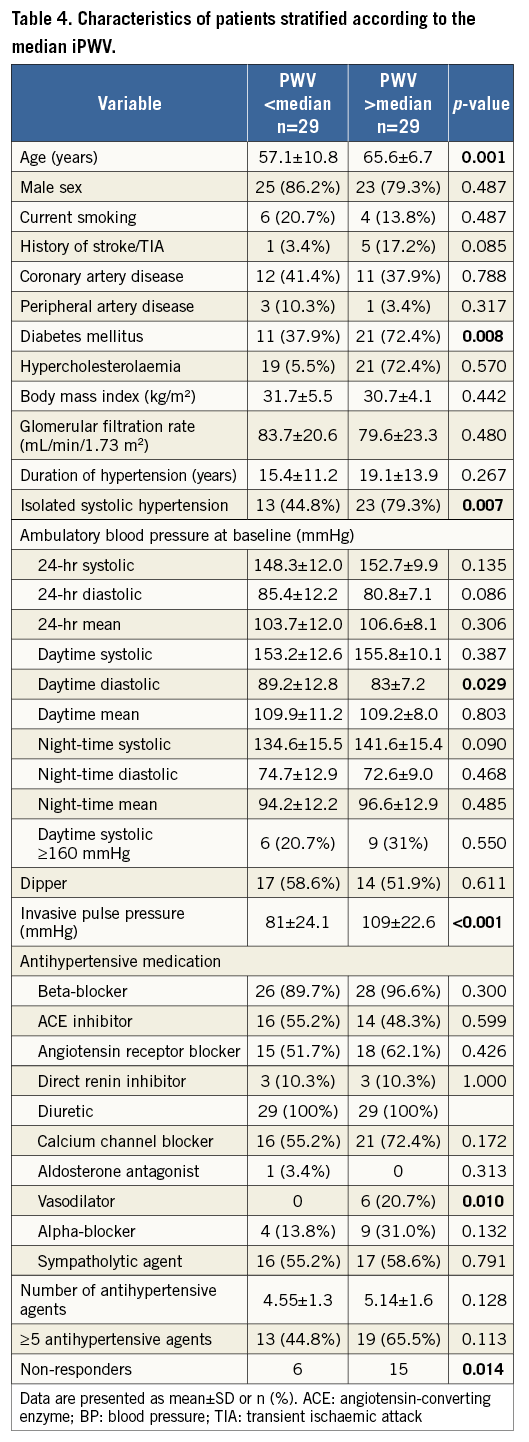
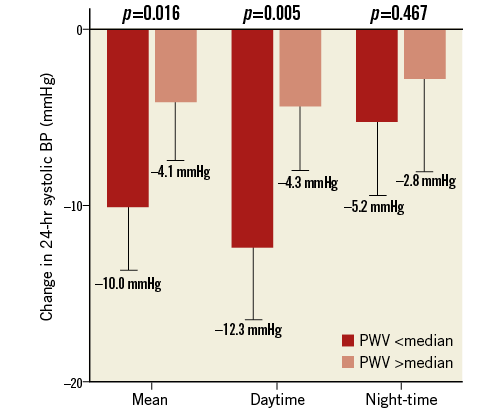
Figure 5. Change of 24-hr ambulatory blood pressure measurements. The mean, daytime, and night-time changes of 24-hr systolic BP from baseline to six months based on division of patients with iPWV >/ Discussion The present study provides a detailed analysis of factors associated with increased AS and assessed the predictive value of AS for response to RSD. The core findings of the study can be summarised as follows: 1) patients not responding to RSD demonstrated significantly increased iPWV; 2) a high iPWV was identified as the only significant predictor of non-responders in multivariate regression analysis; 3) patients with AS (defined as PWV >median) are characterised by a higher prevalence of diabetes mellitus, advanced age and more frequently had isolated systolic hypertension and an increased pulse pressure, and 4) iPWV as an estimate of AS remained unchanged six months after RSD. ARTERIAL STIFFNESS Measuring iPWV is the gold standard to quantify AS15. Many studies have identified AS as a predictor of cardiovascular morbidity and mortality15. Sustained hypertension as well as smoking or diabetes mellitus and ageing itself lead to irreversible vascular remodelling followed by vascular stiffening15,16. The characterisation of increased stiffness in our study (higher age, diabetes mellitus and isolated systolic hypertension) is in keeping with previous studies24-26. Interestingly, although patients with higher PWV were significantly older (Table 4), duration of hypertension and not merely age was found to be a significant independent predictor for response to renal denervation (Table 2). Therefore, we suggest that the influence of long-lasting hypertension is the major contributor to development of AS in our patient cohort. As pointed out by others, AS resembles a measure of the cumulative and time-dependent pathological alterations of the vascular bed15,16. As such, it is believed to be more robust and stable than most other measures of cardiovascular health. Although there is some cross-link between sympathetic activation and stiffness (decreased vasoconstriction with attenuated sympathetic drive), this interaction holds to be true only in the early stage of the disease. At a later stage, AS is mainly driven by irreversible pathological remodelling of the vasculature16. Unfortunately, a significant proportion of patients considered for RSD are probably beyond this point of no return. This is supported by our observation of unchanged iPWV six months after RSD. In summary, uncontrolled hypertension facilitates the development of irreversible stiffening, which in turn contributes to a sustained high BP. These mechanisms should be unaffected by alterations in sympathetic drive, meaning that the effectiveness of RSD in these patients is markedly limited. Following the discussion above, assessment for AS emerges as a promising predictor for outcome following RSD. PREDICTORS FOR NON-RESPONSE TO RSD There are few studies dealing with identification of predictors. In HTN-3, a baseline BP >180 mmHg was a marker for response13. In contrast, we found no significant difference of baseline ABPM levels between responders and non-responders. The findings in HTN-3 may be explained by the phenomenon of regression to the mean rather than pointing towards any mechanistic causality. Also, biomarkers or the increased carotid baroreflex sensitivity were suggested as possible predictors for procedural success18,19. However, their applicability is most likely limited by relevant intra-individual fluctuations, interactions with antihypertensive drugs and availability of resources to measure. Likewise, the observation by Ewen et al, showing that RSD is not as effective in patients with isolated systolic hypertension as in patients with combined hypertension, points towards an important role of AS27. To some degree, isolated hypertension is an estimate of AS and was also significantly more often present in patients with increased iPWV in our study. Finally, a recently published trial by Ott et al demonstrated that an increased central pulse pressure predicts the outcome of RSD20. Authors argued that pulse pressure is a reasonable estimate of AS, supporting our hypothesis of AS as a pivotal predictor. Importantly, we have shown that iPWV was superior to invasive pulse pressure and presence of isolated systolic BP in multivariate regression analyses for prediction of outcome after RSD. This is well explained by the fact that iPWV has been proven to be the gold standard for estimation of AS, and also because PWV serves as a direct marker for stiffness and seems less dependent on vascular dimensions and flow as compared to pulse pressure15. This might also explain why Ott and co-workers were not able to demonstrate a significantly better BP lowering effect on ABPM in patients with a non-invasively derived lower central pulse pressure compared to patients with a higher central pulse pressure20. We therefore argue that, at present, iPWV seems to be superior to other measures of AS and thereby the parameter of choice when assessing the impact of AS on the effect of RSD. The use of ABPM rather than office blood pressure measurements seems less common. However, given the numerous, widely accepted limitations of office measurements alongside the finding that the use of office blood pressure may overestimate the presence of isolated systolic hypertension28, we chose to rely on APBM as a marker for outcome, and also for the diagnosis of isolated systolic hypertension. Changes in antihypertensive medication are a potential confounder when assessing for real responders. To avoid this confounder, we excluded patients with changes in antihypertensive medication during follow-up. Further, we relied exclusively on ABPM to exclude white-coat hypertension and to limit the effect of regression to the mean, as recommended in the expert consensus statement on RSD29. CLINICAL IMPLICATIONS A reliable predictor for the response to RSD is urgently required. Our results show that iPWV as an estimate of AS predicts the response to RSD. In turn, we suggest assessing for iPWV pre-procedure in upcoming trials on RSD, which could have a tremendous impact on interpretation of results and should facilitate any comparisons between trials using different methods and RSD technologies. Due to its invasiveness, it is less suitable as a screening marker in pre-procedural patient selection. Head-to-head studies comparing iPWV and non-invasive estimates derived from magnetic resonance imaging30 or oscillometric methods31 form the basis for the possible use of AS as a criterion of patient selection for RSD in the near future. Limitations The main limitations are clearly the small sample size and the monocentric design of the trial. To develop a reliable predictor or cut-off value, a multicentre, global design is needed. Also, a mathematical construction to evaluate the foot of the waves might have been more accurate than a manual construction. However, interobserver analysis showed good reproducibility of the measurements. Larger trials with more patients are required to confirm our results. Drug adherence was subjectively assessed by patients’ diaries. However, we did not perform any urine analyses. Therefore, we cannot exclude that some alterations in medication intake might have been missed. Nevertheless, since patients with obvious changes in medication were excluded, we feel comfortable that the data have probably not been confounded to a relevant degree. As another cause of non-responding, ablation could have been insufficient in some patients due to incomplete circumferential ablation13 or limited penetration depth32. As long as clinically applicable markers of technical success are missing, variations in procedural effectiveness in individual patients have to be considered in every trial assessing predictors of outcome following renal denervation. A further limitation is the heterogeneity of patients and the possible influence of other characteristics which are already associated with poor response, e.g., the use of vasodilators. Conclusion Our results add to the increasing evidence of increased AS as a predictor for less favourable outcome following RSD and promote iPWV as a suitable way to measure AS. These findings hold the promise that PWV might be used as a selection criterion for RSD, thereby improving outcome following RSD. Impact on daily practice A frequent observation in renal denervation trials is a certain percentage of patients in whom denervation is not followed by relevant blood pressure reduction. Our results demonstrate that invasive pulse wave velocity, the best validated marker for AS, is able to predict outcome after renal denervation. Using a cut-off of 13.7 m/s resulted in a sensitivity of 71% and a specificity of 83% with a positive predictive value of 85.7%. These findings emphasise that PWV might be used as a selection criterion for RSD to identify eligible patients who will benefit the most, should improve the blood pressure lowering effects of RSD, and has the potential to save patients from a potentially unnecessary intervention. Funding Funding was provided by the Heart Center, University of Leipzig. Conflict of interest statement P. Lurz has received speaker’s fees from Medtronic. The other authors have no conflicts of interest to declare.