Abstract
Aims: Fractional flow reserve (FFR) estimated from coronary computed tomography angiography (CT-FFR) offers non-invasive detection of lesion-specific ischaemia. We aimed to develop and validate a fast CT-FFR algorithm utilising the Lattice Boltzmann method for blood flow simulation (LBM CT-FFR).
Methods and results: Sixty-four patients with clinically indicated CTA and invasive FFR measurement from three institutions were retrospectively analysed. CT-FFR was performed using an onsite tool interfacing with a commercial Lattice Boltzmann fluid dynamics cloud-based platform. Diagnostic accuracy of LBM CT-FFR ≤0.8 and percent diameter stenosis >50% by CTA to detect invasive FFR ≤0.8 were compared using area under the receiver operating characteristic curve (AUC). Sixty patients successfully underwent LBM CT-FFR analysis; 29 of 73 lesions in 69 vessels had invasive FFR ≤0.8. Total time to perform LBM CT-FFR was 40±10 min. Compared to invasive FFR, LBM CT-FFR had good correlation (r=0.64), small bias (0.009) and good limits of agreement (–0.223 to 0.206). The AUC of LBM CT-FFR (AUC=0.894, 95% confidence interval [CI]: 0.792-0.996) was significantly higher than CTA (AUC=0.685, 95% CI: 0.576-0.794) to detect FFR ≤0.8 (p=0.0021). Per-lesion specificity, sensitivity, and accuracy of LBM CT-FFR were 97.7%, 79.3%, and 90.4%, respectively.
Conclusions: LBM CT-FFR has very good diagnostic accuracy to detect lesion-specific ischaemia (FFR ≤0.8) and can be performed in less than one hour.
Abbreviations
AUC: area under the curve
CAD: coronary artery disease
CFD: computational fluid dynamics
CI: confidence interval
CT: computed tomography
CTA: computed tomography angiography
CTP: computed tomography perfusion
DS: diameter stenosis
FFR: fractional flow reserve
GPU: graphics processing unit
ICA: invasive coronary angiography
LBM: Lattice Boltzmann method
PET: positron emission tomography
ROC: receiver operating characteristic
ROI: region of interest
SCCT: Society of Cardiovascular Computed Tomography
SPECT: single-photon emission computed tomography
3D: three-dimensional
Introduction
Coronary computed tomography angiography (CTA) is used to exclude anatomically obstructive coronary artery disease (CAD) in low- to intermediate-risk symptomatic patients1. Numerous studies have demonstrated high correlation of anatomic lesion severity identified by CTA and invasive coronary angiography (ICA), and a high negative predictive value to exclude obstructive CAD in patients with both stable2 and acute chest pain3. However, CTA has limited specificity to predict the haemodynamic significance of CAD. Approximately half of obstructive lesions (≥50% lumen diameter stenosis) determined by CTA do not cause ischaemia4. Traditionally, further functional testing is required to determine the haemodynamic significance of obstructive CAD5. This includes exercise treadmill testing, single-photon emission computed tomography (SPECT)6, positron emission tomography (PET)7, stress magnetic resonance imaging, stress echocardiography and, more recently, CT perfusion (CTP)8.
The reference standard to identify lesion-specific ischaemia is invasive fractional flow reserve (FFR) performed at ICA9. FFR is superior to anatomical measures of CAD for guiding revascularisation9-14. FFRCT (HeartFlow Inc., Redwood City, CA, USA) estimates FFR from a standard coronary CTA exam with excellent accuracy to demonstrate lesion-specific ischaemia as defined by invasive FFR ≤0.815-17. In stable symptomatic patients with suspected CAD and no prior myocardial infarction or coronary revascularisation, FFRCT can serve as a gate-keeper to ICA with cost savings and improved quality of life compared to the current standard of care18.
Other techniques to estimate invasive FFR from CTA have been developed19-21, in part to improve FFRCT computation times and render them compatible with clinical workflow. To date, this has involved simplifying the time-intensive computational fluid dynamics (CFD) computations underlying FFR estimation from CTA data. CFD is used to solve the Navier-Stokes equations of blood flow in the three-dimensional (3D) coronary lumen extracted from CTA under simulated hyperaemic conditions. 3D CFD yields the pressure drop across a coronary lesion, from which FFR can be calculated22. Simplifications to date involve reduction of the 3D computational problem to a (primarily or fully) single-dimensional19,20,23 or two-dimensional21 anatomic model to decrease computation time.
The Lattice Boltzmann method (LBM) is an alternative computational technique to discretise the 3D blood flow equations24-26. It can be used similarly to traditional CFD to solve the 3D blood flow in a coronary artery27 and has been used to derive the pressures required for FFR estimation28. Its main advantage in comparison to traditional CFD techniques is that it allows extremely efficient distribution of the CFD computations amongst multiple computer processors29.
We report the validation of a CT-FFR algorithm utilising the LBM CFD technique (LBM CT-FFR) in a multinational patient cohort collected retrospectively from three independent institutions in Asia, Europe and the United States of America. The technique is fully automated and reconstructs blood flows via a commercial fluid dynamics LBM solver that offers high computational accuracy and automated parallelisation of the computation30-32.
Methods
STUDY POPULATION
The institutional review board of each participating institution approved this retrospective study and waived the requirement for written informed consent. The study included 64 patients with neither prior stent implantation nor coronary artery bypass graft referred for coronary CTA and who subsequently underwent ICA with FFR measurement in ≥1 vessel based on the standard-of-care patient management algorithm at each institution. Twenty-one consecutive patients were included from one institution in Japan, twenty consecutive patients were included from a second institution in Italy, and twenty-three consecutive patients were included from a third institution in the USA.
CT ANGIOGRAPHY
Coronary CTA was performed in all institutions in accordance with the recommendations of the Society of Cardiovascular Computed Tomography (SCCT)33. Patients were imaged with a variety of scanners with a minimum of 64-detector row CT, including Aquilion™ 64 and Aquilion ONE™ (Toshiba Medical Systems Corporation, Otawara, Japan), Discovery™ 64 (General Electric Healthcare, Chicago, IL, USA) and SOMATOM Definition (Siemens Healthcare, Erlangen, Germany). Patients with heart rate >65 beats/min received oral or intravenous beta-blockade, and all patients received 0.4 mg sublingual nitroglycerine before imaging.
Iodinated contrast medium was injected with a power injector into an antecubital vein at flow rates of 4.5-6 ml/sec. The type of contrast medium was specific to each institution and included Omnipaque 300 and 350 (Daiichi Sankyo Inc., Tokyo, Japan), Iopromide 370 (Bayer AG, Leverkusen, Germany), and Iomeprol-400 and Isovue-370 (Bracco Diagnostics, Milan, Italy). At all institutions, CT acquisition (either retrospectively or prospectively gated) was timed by bolus tracking in the descending aorta. All studies used ECG-based current modulation and images were acquired with 0.35-0.45 sec gantry rotation time and 100-120 kVp tube potential. Images were reconstructed at 0.5-0.625 mm slice thickness with 0.25-0.4 mm spacing.
CTA scans were interpreted at the institution at which they were acquired. CAD severity was categorised as ≤50%, 51-75%, and >75%, using an 18-segment model according to SCCT guidelines34 in images at the cardiac phase deemed to be least affected by motion. Lesions with ≤50% diameter stenosis (DS) were considered non-obstructive, and those with >50% DS were considered obstructive35.
INVASIVE CORONARY ANGIOGRAPHY
Invasive coronary angiography was performed according to local standard clinical practice at each institution via a femoral or radial approach. Invasive FFR was performed at the discretion of individual operators when clinically appropriate and according to local practice. The pressure wire (Verrata® pressure guide wire [Philips Volcano, Philips Healthcare, Amsterdam, the Netherlands] or PressureWire™ Aeris™ guidewire [St. Jude Medical, St. Paul, MN, USA]) was calibrated and equalised with the aortic pressure before being placed distal to the stenosis and in the distal third of the coronary artery being interrogated. Hyperaemia was induced by intravenous administration of either adenosine or papaverine hydrochloride. FFR was calculated by dividing the mean coronary pressure measured with the pressure sensor placed distal to the stenosis by the mean aortic pressure measured through the guide catheter at steady-state hyperaemia.
CT-FFR ALGORITHM
A stand-alone automated CT-FFR algorithm was developed to estimate FFR from CTA. The algorithm calculated the blood flow velocities and pressures using an LBM CFD model that includes the 3D anatomy of the coronary arteries extracted from the CT angiogram and that considers both the physical characteristics of blood and a physiologic model of the coronary circulation.
Three-dimensional models of the left and right coronary trees were generated from coronary CTA images using proprietary, purpose-developed software (EXA Corporation, Burlington, MA, USA) to segment coronary arteries using methods that rely on contrast enhancement36 and surrounding plaque characteristics37. Specifically, the algorithm requires manual identification of the coronary ostia. Based on those seed points, voxels are automatically segmented to belong to the coronary lumen via region growing that automatically adjusts for the local contrast opacification36. The algorithm allows additional seed points to be added by the operator, e.g., to guide the algorithm to segment additional relevant branches or distal segments if those were not automatically segmented. Following voxel segmentation, vessel centrelines and cross-sectional regions of interest (ROIs) enclosing the lumen were automatically calculated. Distal segments with a cross-section diameter <1 mm were automatically trimmed, with manual override if desired. Finally, cross-sectional ROIs were adjusted by manual editing, if desired.
Blood flow simulations were performed using a Lattice Boltzmann fluid dynamics method, modelling blood as a Newtonian fluid. The LBM solves the equations governing fluid dynamics by means of a kinetic formulation, treating blood as a group of pseudo-particles that evolve explicitly in time over a Cartesian grid. This is in contrast to traditional CFD, which decomposes the lumen into small finite volumes and iteratively balances the integral equations of velocity, pressure, energy and other relevant properties for conservation across the collection of finite volumes. The commercial PowerFLOW® platform (EXA Corporation) was used for the LBM solver. This platform has built-in partitioning of the blood flow computational grid for parallel computing, and enables a speed-up of the computation that is proportional to the number of computer processing units available. The processing units (“cores”) can be ordinary computer processors or specialised hardware such as graphics processing units (GPUs), installed either locally or remotely, e.g., in a “cloud” computing environment. In this work, we performed the calculation on 388 cores of a web-based cloud computing facility hosted by IBM (ExaCLOUD).
A physiologic model was used to estimate each patient’s hyperaemic blood flow conditions incorporating blood flow rates established by the Prediction of Progression of Coronary Artery Disease and Clinical Outcome Using Vascular Profiling of Shear Stress and Wall Morphology (PREDICTION) trial38. Flow distribution in each coronary artery branch was based on Murray’s law39.
Mean pressure distal to the interrogated lesion was obtained from the LBM blood flow simulation in the vessel location matching the invasive FFR measurement based on interpretation of the ICA images recording pressure wire position. Matching was blinded to the invasive FFR measurement. LBM CT-FFR values were then calculated by dividing the mean pressure distal to the coronary lesion by the mean aortic pressure.
STATISTICAL ANALYSIS
Statistical analyses were performed in Stata v9.2 (StataCorp, College Station, TX, USA). LBM CT-FFR values for each lesion interrogated by invasive FFR were first correlated to the invasive FFR measurements using the Pearson correlation coefficient and Bland-Altman analysis to assess the bias and limits of agreement between LBM CT-FFR and invasive FFR measurements. The receiver operating characteristic (ROC) area under the curve (AUC) was then used to assess the diagnostic accuracy of LBM CT-FFR and CTA (≤50% diameter stenosis cut-off) to detect lesion-specific ischaemia as defined by an invasive FFR measurement ≤0.8. All models accounted for data clustering for multiple arteries examined in the same patient. The ROC AUCs were compared using the DeLong method40; a p-value of <0.05 was considered to be statistically significant. Point estimates of diagnostic accuracy, sensitivity, and specificity to detect an invasive FFR ≤0.8 were finally calculated for LBM CT-FFR ≤0.8 and CTA >50% diameter stenosis.
For 18 randomly selected patients, LBM CT-FFR was additionally performed by a second operator to assess method reproducibility. Agreement of the continuous LBM CT-FFR measurements between the two readers was first assessed using Pearson correlation and Bland-Altman limits of agreement, as well as the intraclass correlation coefficient using a two-way random effects model. Second, agreement of the categorical determination of lesion haemodynamic significance (determined by LBM CT-FFR ≤0.8) between operators was assessed using the Cohen kappa statistic.
Results
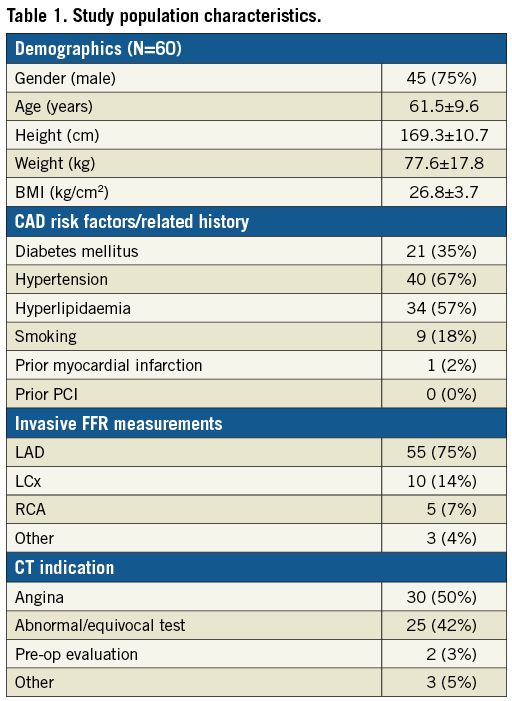
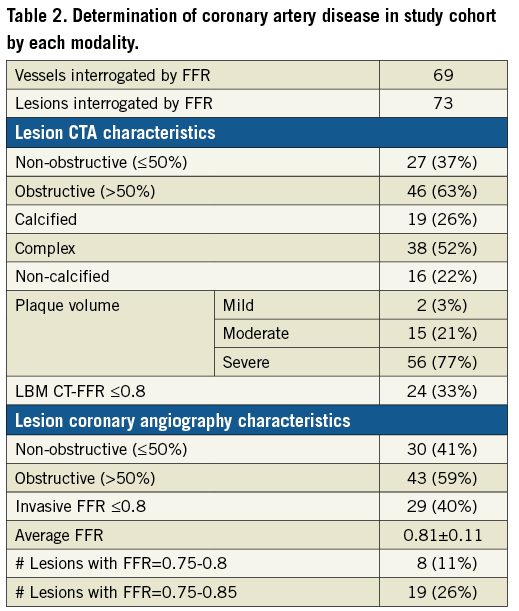
Of the 64 patients, four were excluded due to inability to perform LBM CT-FFR due to failure of the segmentation method secondary to inadequate CTA image quality. Patient characteristics for the remaining 60 patients are provided in Table 1. Invasive FFR measurements were performed in 73 lesions in 69 vessels at a median time of 23 days (interquartile range: 6 to 58 days) after CTA (Table 2). Twenty-nine lesions (40%) had a haemodynamically significant invasive FFR measurement ≤0.8 (Table 2).
The average total time required to perform the LBM CT-FFR calculation, starting from initiating loading of the image data set and including segmentation, was 40±10 min. There was strong correlation between the LBM CT-FFR values and invasive FFR measurements (Pearson’s r=0.6) and Bland-Altman analysis revealed a small bias of -0.009 and limits of agreement of -0.223 to 0.206 (Figure 1). Two example cases are shown in Figure 2 and Figure 3.
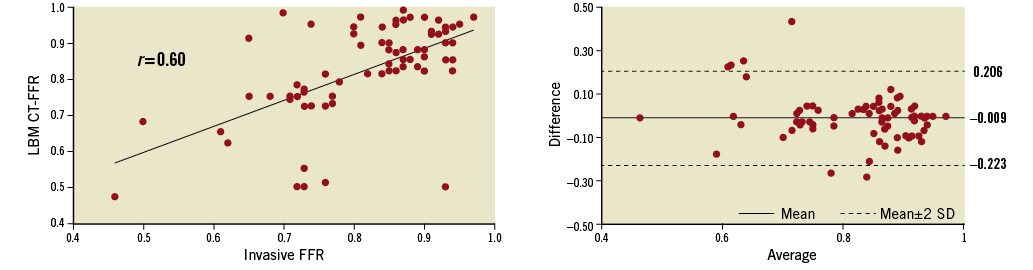
Figure 1. Pearson correlation and Bland-Altman plots of LBM CT-FFR and invasive FFR measurements.
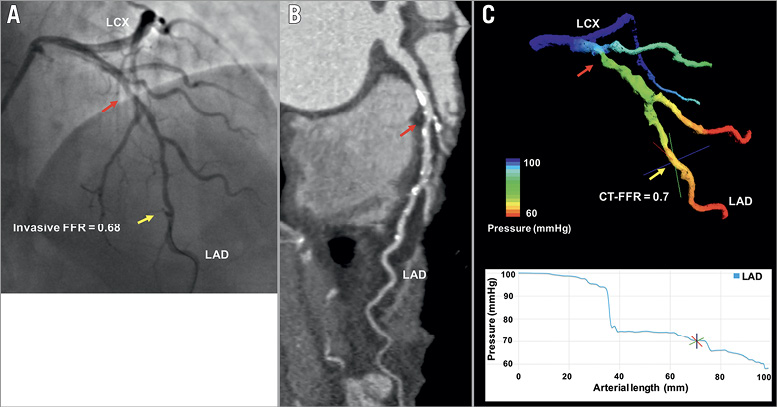
Figure 2. Representative example of LBM CT-FFR estimation in a haemodynamically significant lesion. ICA (A) and CTA (B) of haemodynamically significant mid-LAD lesion with LBM CT-FFR simulation result (C). Red arrow marks the lesion; yellow arrow marks the location of FFR and LBM CT-FFR measurement.
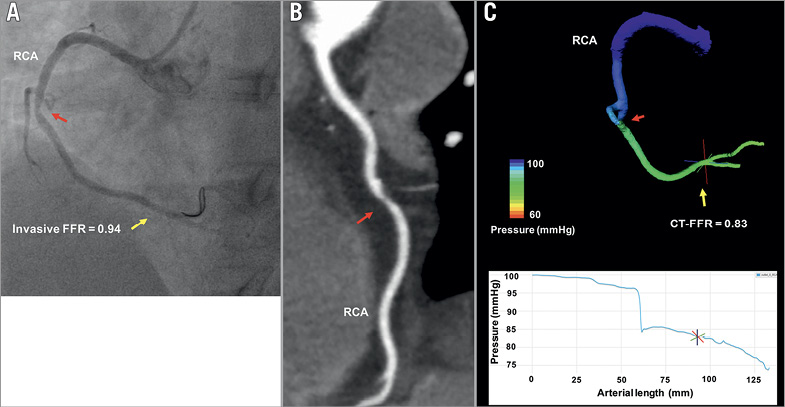
Figure 3. Representative example of LBM CT-FFR estimation in a haemodynamically non-significant lesion. ICA (A) and CTA (B) of non-haemodynamically significant mid-RCA lesion with LBM CT-FFR simulation result (C). Red arrow marks the lesion; yellow arrow marks the location of FFR and LBM CT-FFR measurement.
The AUC of LBM CT-FFR to detect FFR ≤0.8 was 0.894 (95% confidence interval [CI]: 0.792-0.996) (Figure 4). With respect to invasive FFR ≤0.8, LBM CT-FFR analysis identified 23 true positives and 43 true negatives, while there was one false positive and six false negatives. The sensitivity, specificity, and diagnostic accuracy of LBM CT-FFR ≤0.8 to detect FFR ≤0.8 were 79.3% (95% CI: 66.9-82.6%), 97.7% (95% CI: 89.5-99.9%) and 90.4% (95% CI: 80.5-93.0%), respectively. The AUC of CTA to detect FFR ≤0.8 was 0.685 (95% CI: 0.577-0.794), with a sensitivity, specificity and accuracy of CTA >50% diameter stenosis of 82.8% (95% CI: 67.6-93.0%), 50% (95% CI: 40.0-56.8%), and 63% (95% CI: 50.9-71.2), respectively. The ROC AUC of LBM CT-FFR was significantly higher than that of CTA percent diameter stenosis (p=0.0021) (Figure 4).
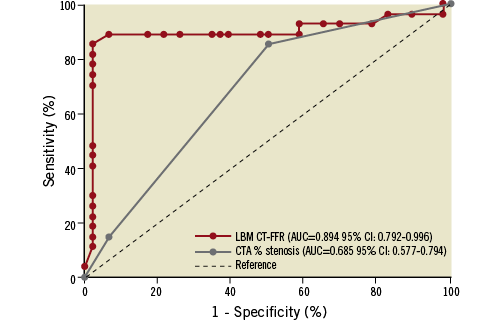
Figure 4. Receiver operating characteristic curves of LBM CT-FFR and CTA to detect invasive FFR ≤0.8.
In the 18 patients assessed by two different operators, 22 lesions were analysed of which five had invasive FFR ≤0.8. LBM CT-FFR values were well correlated between operators (Pearson’s r=0.9), had a low bias of 0.003, and limits of agreement were -0.088 to 0.094. The intraclass correlation coefficient was 0.848 (95% CI: 0.730-0.966) and the Cohen kappa for CT-FFR assessment of haemodynamic significance was κ=1.00, with both operators’ CT-FFR analysis correctly identifying all five haemodynamically significant lesions, with no false positives or false negatives.
Discussion
The primary conclusion of this study is that a fast LBM-based CT-FFR algorithm has better diagnostic accuracy to detect an invasive FFR ≤0.8 than anatomic lesion severity evaluation by CTA. In our patient cohort, LBM CT-FFR test characteristics were similar to those of previously reported CT-FFR techniques15-17,19,21,23. This includes the correlation between LBM CT-FFR measurements and invasive FFR measurements (r=0.6), limits of agreement with invasive FFR (–0.223 to 0.206), and overall diagnostic accuracy (90.4%) and ROC AUC (0.89) to detect lesions with invasive FFR ≤0.8.
The LBM CT-FFR technique ensures 3D accuracy of the hyperaemic blood flow simulation throughout the coronary tree by using a fast commercial, validated LBM solver. This is in contrast to other approaches that employ traditional CFD solvers or that employ “reduced-order” models of the coronary circulation to decrease the computational burden19-21,23.
Some CT-FFR techniques reported to date19,21 have only been applied to images acquired on a particular vendor’s hardware, potentially due to vendor-specific CTA image requirements. In contrast, our CT-FFR approach is most similar to the initial FFRCT technology in that it can be applied to coronary CTA images independent of the CT scanner used to acquire them16,22. This option is likely to be useful for institutions with multi-vendor CT platforms. Additionally, LBM CT-FFR enables users to scale the computational resource, and thus reduce turn-around time. The computational resource can be located either on- or off-site depending on the desired investment for computing hardware, potentially enabling the cardiovascular imager to centralise the computation needed to perform CT-FFR interpretation based on each practice’s individual requirements. The latter option affords the opportunity to share the CT-FFR resource not only between individual practice sites, but also between independent practices. Specifically, because of the intrinsic structure of LBM, the CFD accuracy requirement for accurate CT-FFR estimation can be met while the computation is accomplished with a turn-around time that scales down linearly with the number of processors.
The technique was developed to perform blood flow and FFR calculations in a substantially unsupervised fashion, including subdivision (parallelisation) of the computation on all available computer cores to achieve a systematic reduction of the “time-to-solution” with an increasing number of computing resources as necessary for routine clinical workflow. In this study, the segmentation and computation time were roughly 20 minutes each. Further refinements are likely to reduce the segmentation time substantially. Finally, workflow is simplified by using an on-site “front end” for the clinician to perform all image processing and interpretation steps, such as segmentation, and, when the fluid dynamics problem is solved (either “on-” or “off-site”), to manipulate (pan, rotate, zoom) the LBM CT-FFR results on-site similar to other 3D visualisation tools independent of where the computational resource used to perform the simulation is located. The user can quickly view the pressure drop along the length of each artery and report the CT-FFR estimate in a particular location (Figure 2, Figure 3).
Limitations
We acknowledge several study limitations, particularly the retrospective nature and the relatively small cohort. Test characteristics of LBM CT-FFR reported here are preliminary and will probably change as larger studies are performed and as the method evolves towards better balancing of sensitivity versus specificity, similar to the development of other CT-derived FFR technologies. Importantly, accuracy of the anatomical coronary lumen model may depend on the CTA image quality and degree of calcification. The majority of patients in our cohort did not have a calcium scoring study and thus our results may not be generalisable to patients with a high Agatston score. Although there were differences in CTA and FFR protocols among the three centres, they support the use of LBM CT-FFR among various practices and suggest that our findings are generalisable. Selection bias arises from the fact that the study population included only patients for whom an invasive FFR measurement was clinically indicated based on management algorithms specific to each institution, with inherent practice variations among the sites. Further studies are needed to confirm our results across various populations referred for coronary CTA. This study excluded 6% of the patients on the basis of CTA image quality. This rate can potentially be reduced with further improvements to the automated segmentation algorithm. Our findings are nonetheless generalisable, as more than 60% of the CTA examinations included in our study were performed on 64-detector row CT equipment, which is prone to misalignment artefact that can adversely affect CT-FFR accuracy when compared to single heartbeat imaging15.
Conclusions
Lattice Boltzmann-based CT-FFR has very good diagnostic accuracy to detect a significant invasive FFR ≤0.8. The fast LBM CT-FFR algorithm can be performed in clinically applicable times of <60 min. The technique is highly automated and can be used as an on-site or cloud-based service. All test characteristics of this new CT-FFR algorithm are consistent with previously reported techniques. The method is easy to use, CT vendor-independent, and has the inherent ability to scale the processing time needed to perform CT-FFR calculation to the needs of individual cardiovascular imagers.
| Impact on daily practice A newly developed and validated Lattice Boltzmann-based CT-FFR algorithm, that is CT vendor-independent, can be utilised either on-site or as a cloud-based service providing fast and accurate CT-FFR calculations. |
Acknowledgements
The authors acknowledge the contributions of Drs Hiroyuki Daida, Stefania Fortini, and Giuli Jamagidze, and Mr Brian Fix to this work.
Funding
National Institutes of Health, NIBIB grant number K01-EB015868.
Conflict of interest statement
S. Melchionna is an employee of EXA Corporation. The other authors have no conflicts of interest to declare.