Abstract
Aims: In the minimalist transcatheter aortic valve implantation (TAVI) era, the usage of transoesophageal echocardiography has become restricted. Conversely, aortography has gained clinical ground in quantifying prosthetic valve regurgitation (PVR) during the procedure. In a mock circulation system, we sought to compare the contrast volume required and the accuracy of aortographic videodensitometric PVR assessment using a synchronised diastolic and standard (non-synchronised) injection aortography.
Methods and results: Synchronised diastolic injection triggered by the signal stemming from the mock circulation was compared with standard non-synchronised injection. A transcatheter heart valve was implanted and was deformed step by step by advancing a screw perpendicularly to the cage of the valve in order to create increasing PVR. Quantitative measurement of PVR was derived from time-density curves of both a reference area (aortic root) and a region of interest (left ventricle) developed by a videodensitometric software. The volume of contrast required for the synchronised diastolic injection was significantly less than in the non-synchronised injection (8.1 [7.9-8.5] ml vs. 19.4 [19.2-19.9] ml, p<0.001). The correlation between the two methods was substantial (Spearman’s coefficient rho ranging from 0.991 to 0.968). Intra-observer intra-class correlation coefficient for both methods of injection was 0.999 (95% CI: 0.996-1.000) for the synchronised diastolic and 0.999 (95% CI: 0.996-1.000) for the non-synchronised injection group. The mean difference in the rating was 0.17% and limits of agreement were ±1.64% for both groups.
Conclusions: A short synchronised diastolic injection enables contrast volume reduction during aortography without compromising the accuracy of the quantitative assessment of PVR using videodensitometry.
Abbreviations
AKI: acute kidney injury
AUC: area under the curve
CI: confidence interval
CTA: computed tomography angiography
ICC: intra-class correlation coefficient
IQR: interquartile range
LOA: limits of agreement
LV: left ventricle
MRI: magnetic resonance imaging
PVR: prosthetic valve regurgitation
RAUC: relative area under the curve
RF: regurgitation fraction
ROI: region of interest
SD: standard deviation
TAVI: transcatheter aortic valve implantation
TDC: time-density curve
TEE: transoesophageal echocardiography
THV: transcatheter heart valve
Introduction
Since prosthetic valve regurgitation (PVR) after transcatheter aortic valve implantation (TAVI) is related to mortality1-3, accurate assessment of PVR is required to determine procedural success. Quantification of PVR, which can be transvalvular but is most often paravalvular, is challenging due to the multiple, multi-level, and eccentric nature of paravalvular leaks4. Transoesophageal echocardiography (TEE) and aortography are the standard methods for assessing PVR during the procedure. TAVI under sedation is increasingly being adopted in clinical practice (i.e., minimalist approach), limiting the use of TEE for procedural guidance and leaving aortography as the only screening technique to determine the severity of PVR during the procedure. One of the main limitations of aortography in TAVI patients, who usually have some degree of kidney dysfunction, is the large amount of contrast medium injected per acquisition, which contributes to the risk of periprocedural acute kidney injury (AKI)5,6, portending poor outcome after TAVI6. In clinical practice, aortography is performed with contrast injection which typically lasts for 1-2 seconds, covering a few cardiac cycles. Given the fact that PVR is a diastolic event, a short diastolic injection could avoid the wash-out of contrast by the stroke volume pushed into the aorta during systole (when the aortic valve is open) and, consequently, reduce the contrast volume required per acquisition.
We have previously reported a quantitative method for the assessment of aortography using videodensitometry which yields a surrogate marker of the severity of PVR (the relative area under the curve [RAUC]). It has been shown that an RAUC >17% correlates with increased mortality and with impaired cardiac reverse remodelling, as determined by echocardiography after TAVI, with an excellent reproducibility7-9. In addition to the clinical endpoints, RAUC is well correlated with the magnetic resonance imaging (MRI)-derived regurgitation fraction.
In this study, aortography using either a single synchronised diastolic contrast injection (synchronised injection) or a standard injection (non-synchronised injection) was performed in a mock circulation system. We compared the contrast volume and the parameters of severity of PVR assessed by videodensitometry in both settings.
Methods
THE EXPERIMENT SETTINGS
The mock circulatory system consists of three components corresponding to the aortic root, the aortic valve, and the left ventricle (LV) (Figure 1). The “aortic root” portion consists of an elastic silicone tube to mimic the elasticity of the human aorta. The LV portion is made of a rigid polycarbonate tube including a servomotor-operated piston pump10,11. The piston pump generates a pulsatile flow with a cardiac output of 5.0 (L/min) at a rate of 75 cycles/min producing an ISO 5840-compliant flow curve (35% systole and 65% diastole per cycle). The water in the mock circulation was heated to 37.0°C (i.e., body temperature), in order to keep the contrast medium solubility at physiological levels.
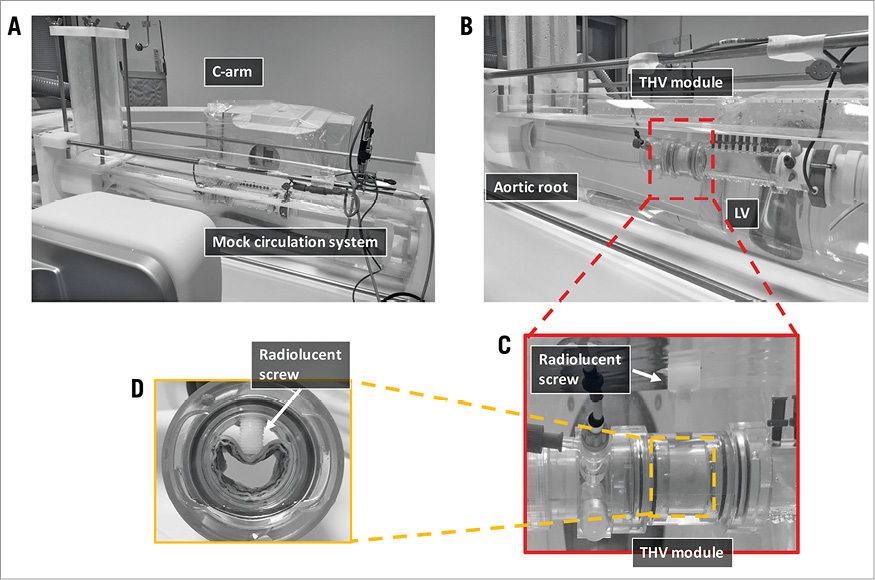
Figure 1. The setting of the experiment. Panel A shows the mock circulation system in the cathlab. Three components of the mock circulation are shown in panel B: the aortic root, the THV module, and the LV. In the THV module (C), a radiolucent screw was set to deform the THV from outside to create an artificial PVR. The screw was gradually advanced to create different degrees of PVR. Panel D shows the maximum deformation of the THV valve corresponding to an RF of 65%.
The transcatheter heart valve (THV) module portion consists of a 25 mm diameter plastic tube, in which a 26 mm SAPIEN XT (Edwards Lifesciences, Irvine, CA, USA) THV was deployed. The frame of the THV was deformed by a radiolucent screw advanced step by step perpendicularly to the cage of the valve in order to create a paravalvular leakage (Figure 1). A flow probe (Transonic 28PAU, with TS410 flowmeter; Transonic, Ithaca, NY, USA) was used for the measurement of the flow rate. The forward flow volume and the backward flow volume were calculated for each heartbeat. The backward flow volume consisted of the regurgitation flow volume and the closing volume needed to close the valve leaflets12,13. The regurgitation fraction (RF) was calculated as the ratio of the regurgitant volume to the forward flow volume %. To represent the entire spectrum of PVR severity, two experiments were conducted at each of the following grades of PVR: RF, 10%, 15%, 25%, 40%, 55%, and 65%.
SYNCHRONISED DIASTOLIC INJECTION VS. NON-SYNCHRONISED INJECTION
An ACIST CVi® contrast delivery system (ACIST Medical Systems, Eden Prairie, MN, USA) was used for contrast injection. For the synchronised diastolic injection, the injector was triggered 490 msec before the start of diastole by a “servomotor” signal from the mock LV pump. The time interval (490 msec) was required to activate the injector and open the patient isolation valve of the injection system in order to induce a short efficient injection of the contrast medium (Figure 2). The set injection rate and volume for the synchronised diastolic injection protocol were 22.5 ml/sec and 12 ml, respectively. For the non-synchronised injection, a manual trigger was applied at a random time point in the cardiac cycle to start injection at a rate of 22.5 ml/sec and a volume of 20 ml. A pressure limit for both injection techniques was set at 700 psi.
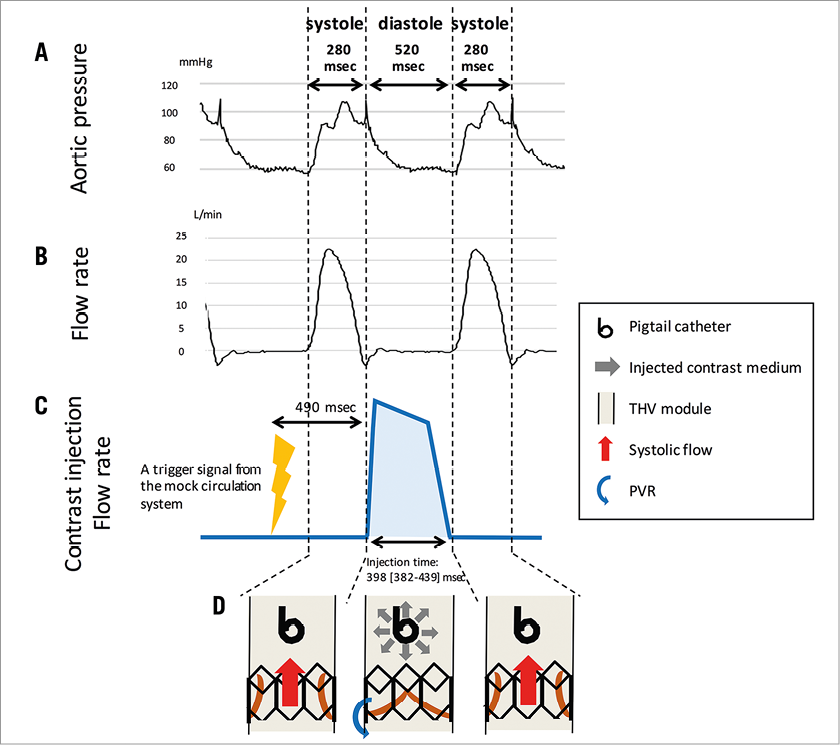
Figure 2. The synchronised diastolic injection. The mock circulation system generated a pulsatile flow at a rate of 75 cycles/min (producing 35% systole and 65% diastole per cycle). Panels A and B show the actual pressure and flow rate curves in the mock circulation system. The cartoon of the flow rate of the synchronised contrast medium injection is displayed in panel C. The dotted line indicates the limit between systole (280 msec) and diastole (520 msec). A signal to trigger contrast injection was sent to the injector pump 490 msec before the start of diastole. The pump started to inject the contrast medium 490 msec after the trigger signal had been received. The cartoon in panel D gives the overall concept of a synchronised diastolic injection, showing the relationship of the timing of contrast injection, opened/closed prosthesis valve leaflets and PVR. Contrast medium was injected during the diastolic phase (prosthesis valve leaflets closed) to coincide with the backflow from the aorta into the LV (the PVR).
ANGIOGRAPHIC IMAGE ACQUISITION AND ANALYSIS
The experiment was performed at Catharina Hospital, Eindhoven, the Netherlands. The mock circulation system was set in the cathlab with a C-arm angulation of LAO 90/CRA 0 (Figure 1). A 6 Fr pigtail catheter was used to inject the contrast medium and positioned 20 mm above the upper level of the stent cage of the valve (with the distance being confirmed by a quantitative angiographic software). A dedicated videodensitometry software (CAAS A-valve 2.0.2; Pie Medical Imaging, Maastricht, the Netherlands)7-9,14 was used to quantify PVR. After drawing the contour of the “aortic root”, the “THV module” and the “LV” portions, the software generates two time-density curves (TDCs) corresponding to the contrast density in the reference region (the aortic root) and the region of interest (ROI; the LV). The area under these curves was automatically calculated for both the reference region and the ROI. The RAUC was automatically calculated as the ratio of the areas under the curve (AUCROI/AUCreference)7-9,14 (Figure 3, Moving image 1).
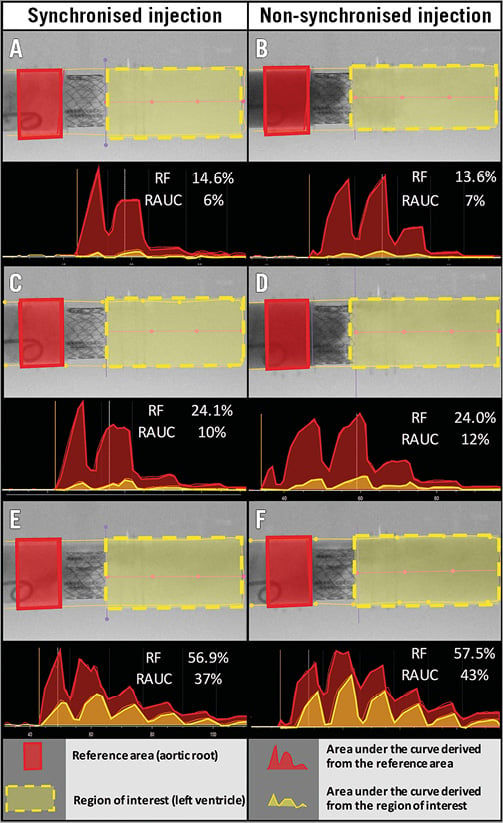
Figure 3. Representative videodensitometric regurgitation assessment. Panels A, C and E represent the assessment based on a synchronised injection, while panels B, D, and F represent the assessment by a non-synchronised injection. The aortic root serves as the reference area (red rectangle). The LV served as the region of interest (yellow dotted rectangle). The time density curves (TDCs) for both the reference area and the region of interest were generated and the AUCs were calculated for both TDCs. The relative AUC (RAUC) was calculated automatically as the ratio of AUC (AUCROI/AUCreference).
STATISTICAL ANALYSIS
When continuous variables were normally distributed, we summarised data as mean ± standard deviation (SD). If they were not normally distributed, median and interquartile range [IQR] were used. Spearman correlation was used to assess the relationship between the RAUC and the RF. The Mann-Whitney U test was performed to compare the numerical variables between the synchronised diastolic injection group and the non-synchronised injection group. The significance of the difference between correlation coefficients was tested using Fisher’s z-transformation. To test intra-observer reproducibility, we calculated the intra-class correlation coefficient (ICC) presented with its 95% confidence interval (CI). The Bland-Altman method was used to display the difference between paired observations and the 95% limits of agreement (95% LOA) were estimated as ±1.96×SD of the difference. All analyses were performed with SPSS, Version 23 (IBM Corp., Armonk, NY, USA).
Results
Twenty-four experiments (12 experiments with a synchronised diastolic injection and 12 experiments with non-synchronised injection) were performed at different degrees of RF. The RF ranged from 11.3% to 63.4% in the synchronised diastolic injection group of observations (median [IQR]: 33.0 [14.6-57.1] %) and from 11.8% to 65.3% in the non-synchronised injection group of observations (median [IQR]: 32.7 [13.6-57.9] %) (Table 1).
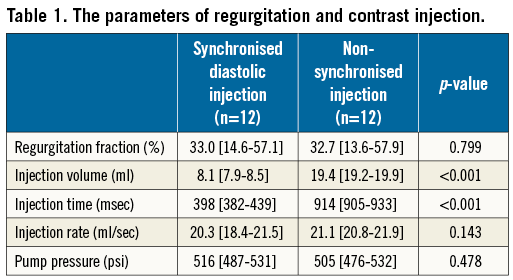
INJECTION PARAMETERS
The actual contrast injection rate and pump pressure were not different between the synchronised diastolic injection and the non-synchronised injection groups (20.3 [18.4-21.5] vs. 21.1 [20.8-21.9] ml/sec; p=0.143, and 516 [487-531] vs. 505 [476-532] psi; p=0.478). The actual contrast injection volume in the synchronised diastolic injection group was significantly less than in the non-synchronised injection group (8.1 [7.9-8.5] ml vs. 19.4 [19.2-19.9] ml, p<0.001) (Table 1). The actual injection time in the synchronised diastolic injection group was 398 [382-439] msec which was confined to the diastolic phase (520 msec) (Figure 2). The actual injection time in the non-synchronised injection group was 914 [905-933] msec.
VIDEODENSITOMETRIC ASSESSMENT (THE RAUC) OF THE PVR SEVERITY vs. RF
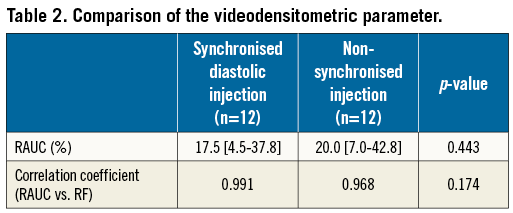
The RAUC was not different between the groups (17.5 [4.5-37.8] % in the synchronised diastolic vs. 20.0 [7.0-42.8] % in the non-synchronised injection, p=0.443). The correlation was substantial between the RAUC and RF in the synchronised diastolic injection group (r=0.991, p<0.001, y= (–6.585) + 0.767x), and in the non-synchronised injection group (r=0.968, p<0.001, y=(–5.682) +0.813x). The correlation coefficient between the RAUC and RF was not significantly different between the two groups (Fisher’s z-transformation p=0.174) (Figure 4, Table 2).
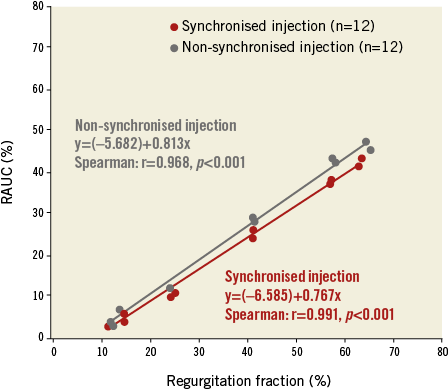
Figure 4. Correlation between the RAUC and RF in both injection techniques. Scatter plots with the best fit line showing the relation between the regurgitation fraction (RF; on the horizontal axis) and the RAUC (on the vertical axis). The red dots and line correspond to the synchronised diastolic injection group while the blue dots and line correspond to the non-synchronised injection group.
REPRODUCIBILITY OF THE ANALYSIS
The intra-observer ICC was 0.999 (95% CI: 0.996-1.000) for the synchronised diastolic injection group and 0.999 (95% CI: 0.996-1.000) for the non-synchronised injection group. The intra-observer mean difference of the RAUC was 0.17% and the limits of agreement were ±1.64% for both the synchronised diastolic injection group and the non-synchronised injection group (Figure 5).
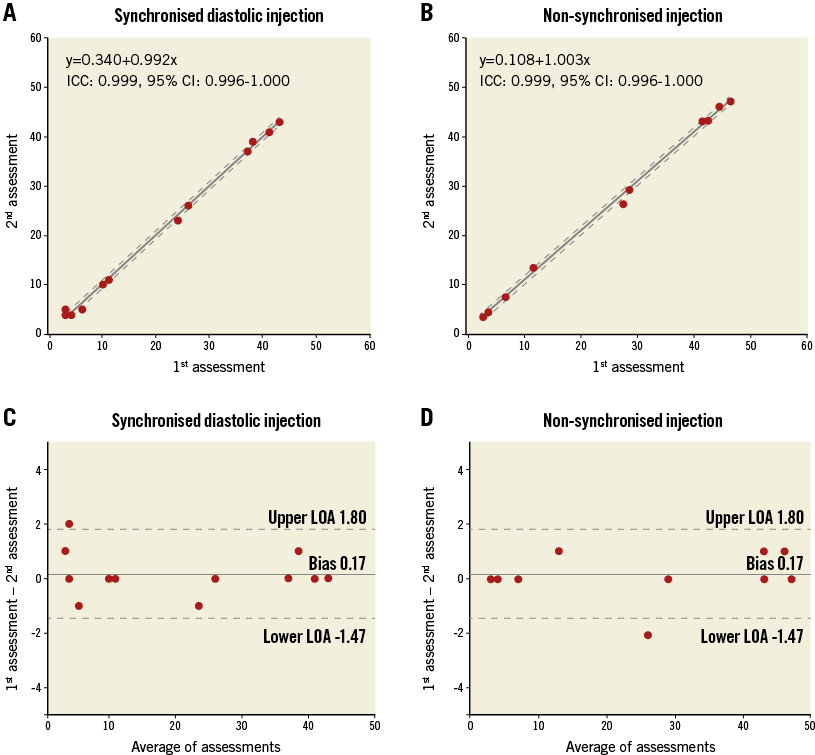
Figure 5. Reproducibility of the RAUC assessment. Scatter plot and the best fit line with 95% confidence interval (dotted line) displaying the results of the 1st assessment (x axis) and the 2nd assessment (y axis). Panels A and B correspond to the synchronised diastolic injection and the non-synchronised injection techniques. Bland-Altman plots displaying the differences of RAUC between the 1st and 2nd assessments are shown in panels C and D for the synchronised diastolic injection and the non-synchronised injection techniques.
Discussion
The main finding of this study is that aortographic assessment of PVR can be performed using a small amount of contrast medium injected in diastole while keeping a substantial correlation with the RF.
In routine clinical practice, aortography requires a large amount of contrast (15-30 ml/injection) injected over 1-2 seconds (corresponding to a few cardiac cycles). Since contrast media are universally classified as nephrotoxic agents15, a small amount of contrast would be favourable for TAVI patients. Reducing the contrast volume has been the objective of many studies that addressed not only procedural but also planning procedures (i.e., preprocedural computed tomography angiography [CTA])16-19. The use of preprocedural CTA to plan the fluoroscopic projections for TAVI was shown to reduce the amount of contrast agent administered during the procedure19. There is also growing evidence suggesting the feasibility of contrast volume reduction during preprocedural CTA using high-pitch spiral injection mode, body mass index-adjusted contrast volume, and the third-generation dual-source CT systems16-18.
In the setting of TAVI, periprocedural AKI develops in 12% to 57% of cases and portends a significantly increased early and late mortality20,21. The mechanisms of AKI following TAVI are multifactorial, and the role of the volume of contrast media is controversial15. However, there is evidence that a larger contrast volume (and a higher ratio of contrast volume to glomerular filtration rate and/or body mass index) is associated with increased risk of AKI following TAVI20,22.
In this study, we sought to reduce the contrast medium volume for aortography by injecting the contrast medium during a single diastolic phase to coincide with the backflow from the aorta into the LV (the PVR). Contrast injection during systole is less efficient, as the majority of the injected contrast medium is washed distally from the aortic root by the stroke volume pushed from the LV. To perform the diastolic contrast medium injection, we used the signal from the mock LV pump as a trigger to facilitate synchronisation between injection and the cardiac cycle. At the same injection rate and the same pump pressure, the volume of the contrast medium injected within the diastolic phase was significantly smaller compared to the non-synchronised injection protocol. The quantitative assessment using this injection technique correlated well with the RF, and the correlation coefficient was not different compared to the non-synchronised injection protocol that required more than twofold more contrast.
One of the concerns about the small amount of contrast injection is the quality of the image (the density of opacification). These results suggest that the quality of images is good enough to quantify the severity of PVR without jeopardising the accuracy or the reproducibility of the quantitative assessment. However, it has to be taken into account that there is a difference in radiotransparency between the in vivo and in vitro settings; whether the synchronised diastolic injection using such a small amount of contrast medium will be as accurate and precise in humans has yet to be investigated in clinical studies.
TAVI under sedation is increasingly adopted in clinical practice (minimalist TAVI approach)23. In the minimalist TAVI setting, the usage of TEE is limited while aortography remains the main screening tool to determine the severity of PVR during the procedure. However, the grading of PVR severity based on visual assessment (Sellers’ grading) is subjective and qualitative, resulting in a low inter-observer agreement14. Quantitative assessment of PVR by videodensitometry yields a surrogate marker of the severity of PVR (RAUC), in which RAUC >17% after TAVI was previously shown to correlate with increased mortality and with impaired cardiac reverse remodelling with excellent reproducibility7-9. Therefore, videodensitometric assessment of PVR after TAVI could overcome the limitations of the Sellers’ method. Moreover, the combination of a quantitative videodensitometric PVR assessment with a synchronised injection method has the potential to combine an accurate PVR assessment with a reduced amount of contrast medium. In the minimalist TAVI era, this could help to reduce the risk of AKI without jeopardising the accuracy of assessment of PVR.
Clinical application of videodensitometry requires standardised protocols of image acquisition and contrast injection. Prediction of optimal fluoroscopic projection (using CT-based algorithms) can improve the yield of the technology by avoiding the overlap of radiodense objects (e.g., descending aorta) on the ROIs24. Electrocardiographic triggering (similar to triggering intra-aortic balloon pumps) can be set up in contrast injectors to enable synchronised diastolic injection. Finally, enabling real-time videodensitometric analysis is currently under development.
Limitations
This study bears a number of limitations. The heart rate during all experiments was set at 75 beats/minute. Although this mimics physiological haemodynamics, significantly higher heart rates can be encountered during the procedure. Whether a shorter or irregular diastolic time would allow an efficient synchronised injection needs to be investigated in future studies. Additionally, the study did not involve comparison of the two injection protocols using visual (Sellers’) aortographic grading. In the present study, we found that the novel synchronised injection protocol yields an accuracy that is as good as the standard non-synchronised injection protocol using videodensitometry. Whether this finding can be extrapolated to the visual (Sellers’) method still needs to be investigated in future studies. Finally, obtaining a sterile transcatheter heart valve was not affordable and a clinically discarded device was used in the experiment. Before creating the artificial paravalvular leakage, a mild transvalvular regurgitation was present which precluded the investigation of very small RF values. Whether the synchronised injection method would be as accurate in very small PVR ranges cannot be determined based on the current data.
Conclusions
A synchronised diastolic injection enables contrast volume reduction for aortography without compromising the accuracy of the quantitative assessment of PVR.
| Impact on daily practice In the minimalist transcatheter aortic valve implantation (TAVI) era, aortography gains even more clinical ground in quantifying prosthetic valve regurgitation (PVR) during the procedure. The current study suggests that synchronised diastolic injection has the potential to reduce the amount of contrast medium used during angiographic assessment of aortic regurgitation after TAVI. |
Funding
This experiment was supported by Pie Medical Imaging.
Conflict of interest statement
J-P. Aben is employed by Pie Medical Imaging. M. van Sloun and T. Suchecki are employed by ACIST Medical Systems. The other authors have no conflicts of interest to declare.
Supplementary data
Moving image 1. Examples of videodensitometric assessment. The left panel shows the results of the videodensitometric assessment of a small volume of regurgitation, while the right panel displays the videodensitometric assessment of a large volume of regurgitation. The RAUC is displayed (upper right) as well as the TDCs of both the reference area (the red curve) and the region of interest (the yellow curve) in the lower panel. The colour map in the middle right displays the distribution of the regurgitation flow.
Supplementary data
To read the full content of this article, please download the PDF.
Moving image 1. Examples of videodensitometric assessment.The left panel shows the results of the videodensitometric assessment of a small volume of regurgitation, while the right panel displays the videodensitometric assessment of a large volume of regurgitation. The RAUC is displayed (upper right) as well as the TDCs of both the reference area (the red curve) and the region of interest (the yellow curve) in the lower panel. The colour map in the middle right displays the distribution of the regurgitation flow.