Abstract
Aims: We describe a new semi-automated method that measures aortic regurgitation (AR) on contrast aortography with the objectives of reducing the inter-observer variability and standardising image acquisition.
Methods and results: Aortograms from three participating centres were reviewed to generate the following quality criteria: entire left ventricle and aortic root in view, descending aorta or TOE probe not over-projected, breath hold, no table motion, and adequate contrast opacification of the aortic root. AR was visually graded (Sellers) and was quantified by measuring the area under time-contrast density curves in the aortic root (reference) and the left ventricle. Quality criteria were met in 44 retrospectively identified aortograms and in 22 (69%) of 32 prospectively collected aortograms. The visual AR grade (Sellers) was highly correlated with time-density measurements including relative area under the curve (RAUC) and qRA index (r=0.81 and 0.83, respectively, p<0.001). Inter-observer reproducibility of visual grading was moderate (kappa 0.47-0.60, p<0.001). Inter-observer measurement of RAUC and qRA index were highly correlated (r=0.98, p<0.001) and showed a high level of agreement.
Conclusions: Quantification of aortic regurgitation by measurement of time-density changes on contrast aortography may improve the reproducibility of AR assessment in the catheter laboratory. Steps for standardised aortography acquisition are proposed.
Introduction
Aortic regurgitation (AR) is common after transcatheter aortic valve implantation (TAVI), affecting 58% to 70% of patients1. AR is associated with increased rates of death proportionate to the degree of AR1. The prevalence of AR after TAVI varies substantially among different studies. This may reflect real differences between patients and procedure-related factors such as patient annulus size and degree of calcification, prosthesis type, method of sizing (e.g., transthoracic/transoesophageal echocardiography [TTE/TOE] vs. multislice computed tomography [MSCT]), implantation depth in addition to the limited sizes of prostheses available1-6. However, differences in the way AR is assessed may also contribute. The assessment of AR after TAVI is more difficult than for native valve AR7, because it is mostly paravalvular, calcification and metal may attenuate ultrasound signals, and multiple regurgitant jets are frequent and may follow irregular trajectories7,8. This means that conventional methods used for quantification of native valve regurgitation including pressure half time, vena contracta location and jet width can frequently not be reliably determined. Although specific methods for quantification of periprosthetic AR have been proposed by expert consensus, these approaches have yet to be validated and may not overcome all of the limitations imposed on echocardiography in TAVI patients7-9.
Conceptually, contrast aortography (CA) may have some advantages over echocardiography for AR quantification after TAVI. Contrast in the left ventricle represents the cumulative effect of all regurgitant jets irrespective of number, location or direction. CA is performed after TAVI in most cases in the catheter laboratory where significant AR may be alleviated by device post-dilatation, repositioning or implanting a second valve. Yet, the current method of grading AR on contrast aortography proposed by Sellers in 1964 is semi-quantitative and is subject to differences in interpretation10. In contrast to all other imaging modalities where standard protocols define image acquisition and measurement requirements, inform quality assessment and allow reproducibility of measurement, the acquisition parameters for CA have not been standardised.
Earlier studies have demonstrated the feasibility of quantification of contrast time-density changes to improve reproducibility of evaluation of microvascular perfusion11. We developed a tool that measures the degree of AR by contrast densitometry (CAAS A-valve quantitative regurgitation analysis; Pie Medical Imaging, Maastricht, The Netherlands). The aim of this study is to describe the tool, to learn the optimal acquisition parameters and to provide pilot data of the inter-individual reproducibility when compared to the method of Sellers.
Methods
PATIENTS AND IMAGE ACQUISITION QUALITY CRITERIA
Three participating centres contributed aortograms which were evaluated for adequacy of image quality. There are no criteria for standardisation of aortograms and we initially deduced criteria based on the Sellers approach (no dynamic contrast adjustment, LV fully in view, no over-projection of diaphragms). A review of mostly retrospective images indicated that these criteria were frequently not met and highlighted the need for additional criteria (no table motion, no TOE probe in view, breath hold). Quality requirements were modified accordingly and feedback was given to each site for improving routine clinical acquisition. Further image review and criteria modification ultimately resulted in specific stepwise acquisition guidelines. A total of 285 aortograms from 161 patients were obtained and reviewed during this learning process. The following criteria were used in the final analysis: acquisition mode with dynamic contrast adjustment turned off, such as the LV mode on the Siemens AXIOM Artis (Siemens AG, Forchheim, Germany) system, entire left ventricle and aortic root in view, descending aorta not over-projected on the aortic root or LV, no over-projection of dense objects such as TOE probes in the regions of interest, acquisition during breath hold, no table motion, and adequate contrast opacification of the aortic root (the aortic root had to be completely filled with contrast so that it was entirely visible from the floor of the sinuses to the ST junction). The steps taken to learn the final image standardisation and quality criteria are shown in Figure 1.
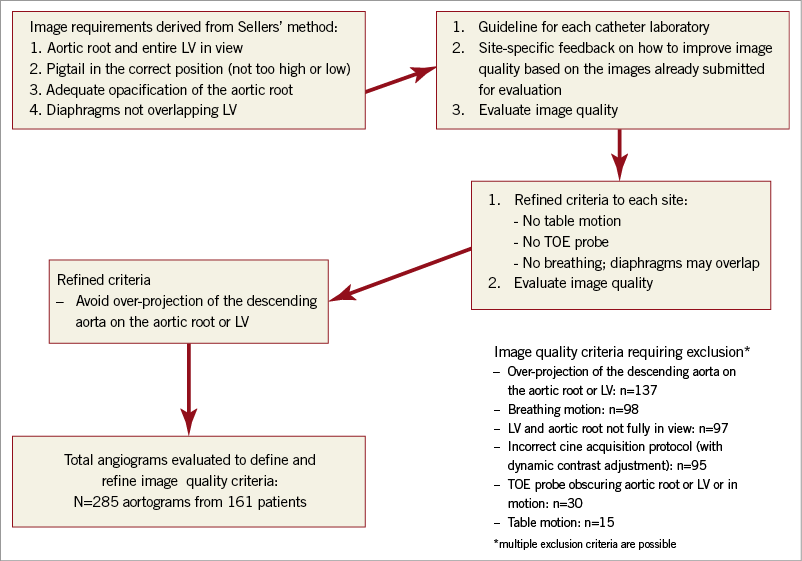
Figure 1. The steps taken to learn the final image standardisation and quality criteria.
Forty-four retrospectively identified aortograms which met the final image acquisition criteria were used to evaluate reproducibility of AR grading by visual score and densitometry and to develop a provisional guideline for the interpretation of quantitative regurgitation analysis (qRA) measurements. Following the implementation of the image acquisition criteria, an additional 32 aortograms were prospectively collected from 30 patients to evaluate success rates for achieving adequate image quality and the reproducibility of the provisional guidelines for interpretation of qRA measurements.
This was an observational study, performed according to the privacy policy of the Erasmus MC and the Erasmus MC regulations for the appropriate use of data in patient-oriented research, which are based on international regulations, including the Declaration of Helsinki. A waiver from the hospital ethical committee was obtained for written informed consent as, according to Dutch law, written consent is not required if patients are not subject to acts other than as part of their regular treatment. At other sites written informed consent was obtained.
Grading of AR according to Sellers
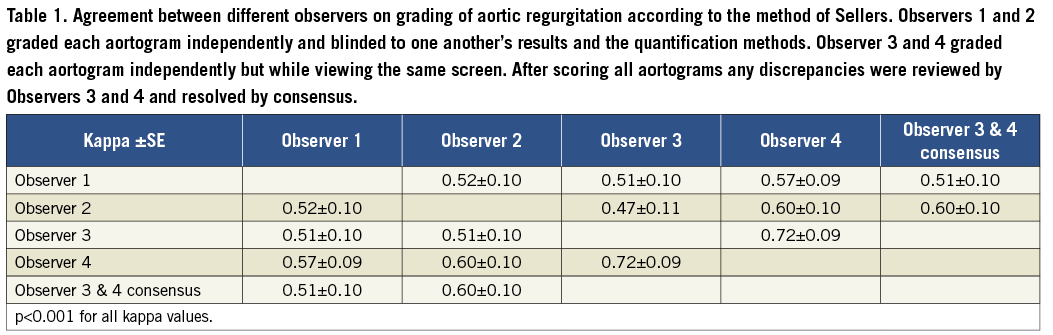
Four expert observers visually graded the severity of AR according to the method of Sellers. Observers 1 and 2 graded each aortogram independently and blinded to one another’s results and the results of the quantification methods. Observers 3 and 4 individually graded each aortogram but simultaneously while viewing the same screen (similar to the way AR may be scored by the two implanters during a TAVI procedure). After scoring all aortograms, any discrepancies were reviewed by Observers 3 and 4 and resolved by consensus. This meant that the consensus grading was independent of Observers 1 and 2 and could also be used to evaluate reproducibility.
Grading of AR by qRA
Two observers independently, and blinded to one another’s results, obtained contrast time-density curves with the CAAS A-valve qRA by following the same steps. On the aortogram, the region of interest is drawn to include the contrast-filled aortic root and the left ventricle. The base of the aortic root is indicated (Figure 2). The software then stabilises the image by subtracting the static background before producing five time-density curves, i.e., in the reference area (aortic root), and in the left ventricular base, mid and apex and overall (Figure 2). All values are normalised relative to the maximum density measured in the reference area, which is given the value of 100. For each ventricular time-density curve the following were measured for each of the first three heart phases after arrival of contrast in the aortic root and overall: increase, decrease, absolute area under the curve, reference area under the curve, relative area under the curve (RAUC, as a fraction of the reference area), absolute partial area under the curve, reference partial area under the curve, relative partial area under the curve, peak, phase reference peak, relative peak, mean, reference mean, relative mean, maximum upslope, maximum downslope, variance (Figure 3).
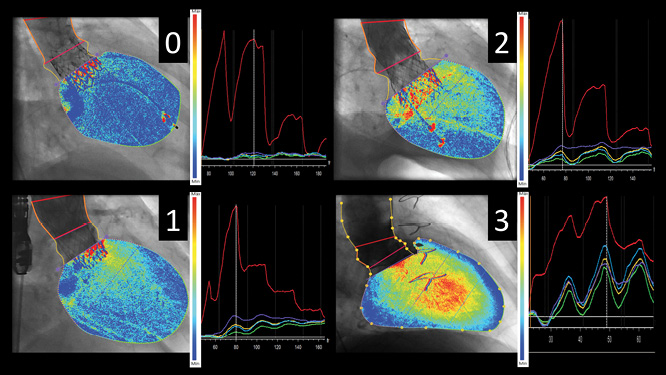
Figure 2. Aortogram time-density curve analysis step by step. The region of interest is drawn to include the contrast-filled aortic root and the left ventricle (left panel, dotted yellow lines). The base of the aortic root is indicated (left panel, purple line). The panels on the right show the 5 time-density curves generated by the qRA software, i.e., for the aortic root reference area (red), and for the left ventricle (LV) base (purple), mid section (light blue), apex (green) and overall (yellow). Cumulative LV contrast density maps overlaid on the aortograms give a visual impression of the quantified severity of aortic regurgitation ranging from absent (0) to moderate to severe (3) in the examples shown.
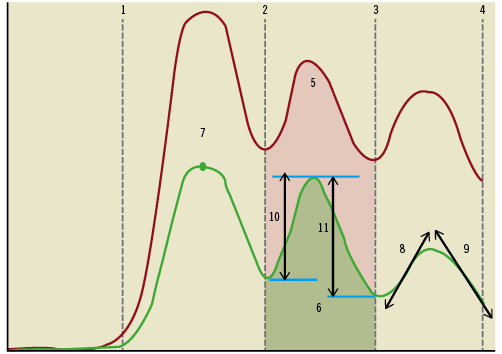
Figure 3. Measurements obtained from the time-density curves of the aortic root (red) and the left ventricle overall (green) over three cardiac phases. For each ventricular time-density curve the following were measured for each of the first three heart phases after arrival of contrast in the aortic root and overall: increase, decrease, absolute area under the curve (AUC), reference area under the curve, relative area under the curve (as a fraction of the reference area), absolute partial area under the curve, reference partial area under the curve, relative partial area under the curve, peak, phase reference peak, relative peak, mean, reference mean, relative mean, maximum upslope, maximum downslope, variance. Legend: 1: start of contrast injection; 2-4: phase borders; 5: absolute reference AUC; 6: absolute ventricular AUC; 7: phase peak; 8: phase upslope; 9: phase downslope; 10: phase increase; 11: phase decrease
RAUC is the single measure which includes the most data obtained from the time-density curves. Based on RAUC a colour-weighted contrast time-density map was generated to facilitate a visual impression of AR severity (Figure 2).
Calculation of the qRA index
The qRA index was calculated from the first three cardiac phases after the arrival of contrast in the aortic root by weighting the RAUC with increasing apical depth and longer duration of contrast within the LV (analogous to Sellers’ method). In addition, a peak phase qRA index was calculated by a similar weighting but based on the first three phases after the contrast peak in the aortic root, and an averaging of all phases leading up to the contrast peak.
Statistical methods
Data are represented as a mean±SD or median (25th to 75th) percentile as appropriate. Pearson’s or Spearman’s correlation coefficient was determined as appropriate. For the evaluation of inter-individual differences in measurement the Student’s t-test for paired samples was used, and scatter and Bland-Altman difference plots were generated. For the evaluation of agreement between different observers of the Sellers grade the kappa statistic was calculated. Reproducibility was assessed only for RAUC and qRA index because RAUC is the single measure which includes the most data obtained from the time-density curves, and it forms the basis from which the qRA index is calculated by incorporating other weighted parameters. Statistical significance was determined as a two-tailed p-value <0.05. SPSS 20.0 (IBM, Armonk, NY, USA) was used.
Results
REPRODUCIBILITY OF GRADING OF AR ACCORDING TO THE METHOD OF SELLERS
AR was graded as absent, mild, moderate, moderate-severe or severe according to the method of Sellers in, respectively, n (%): 6 (14), 17 (39), 14 (32), 4 (9) and 3 (7) aortograms by Observer 1, and in 3 (7), 13 (30), 20 (45), 7 (16) and 1 (2) by Observer 2. Grading of AR differed by one grade in 15 (34%) aortograms and was graded more severe in 12 and less severe in three by Observer 2 when compared to Observer 1. Similar differences were observed among the gradings of Observers 1-4 and between Observers 1 or 2 and the consensus grading, although the lowest difference was seen between Observers 3 and 4. The kappa statistic showed a moderate level of agreement among the different observers overall (Table 1).
REPRODUCIBILITY OF GRADING OF AR BY qRA
Both RAUC and qRA index were very highly correlated between the two observers, both r=0.98, p<0.001. There were no significant differences between Observers 1 and 2 in either total relative area under the curve (mean±SD: 0.15±0.13 vs. 0.15±0.13, mean difference±SD: 0.0±0.03, p=0.4) or qRA index (mean±SD: 0.8±0.6 vs. 0.8±0.7, mean difference±SD: 0.0±0.1, p=1.0).
The scatter plots and Bland-Altman plots show a high level of agreement for both parameters (Figure 4, Figure 5).
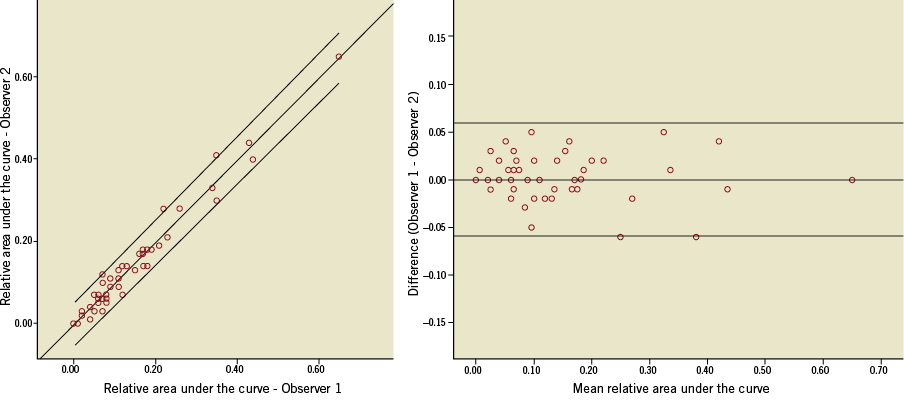
Figure 4. The scatter and Bland-Altman plots of relative area under the time-density curves measured by two observers. The line of best fit and 95% confidence interval are shown on the scatter plot (R2=0.964, p<0.001). The difference plot shows the mean difference and limits of agreement (95% confidence interval).
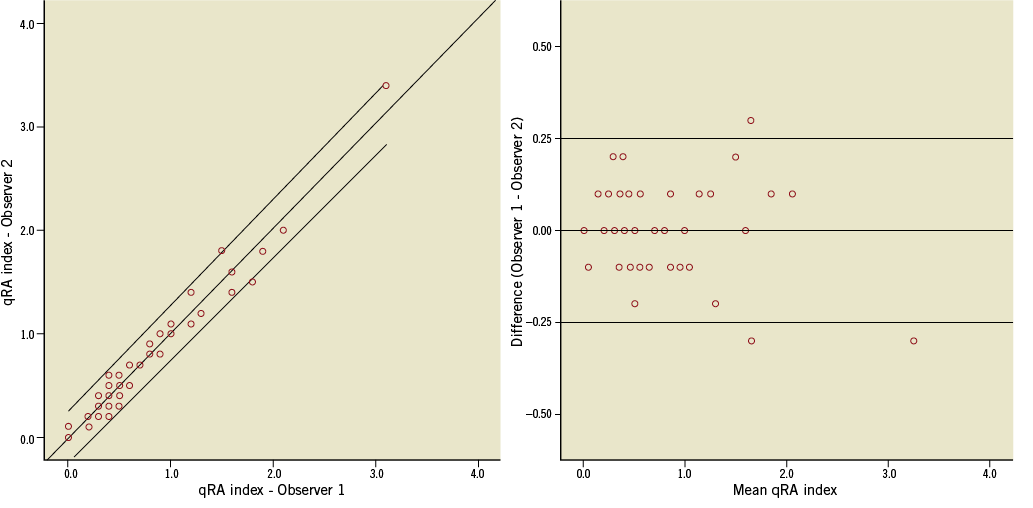
Figure 5. The scatter and Bland-Altman plots of qRA index measured by two observers. The line of best fit and 95% confidence interval are shown on the scatter plot (R2=0.97, p<0.001). The difference plot shows the mean difference and limits of agreement (95% confidence interval).
Correlation of qRA measurements with Sellers’ grading
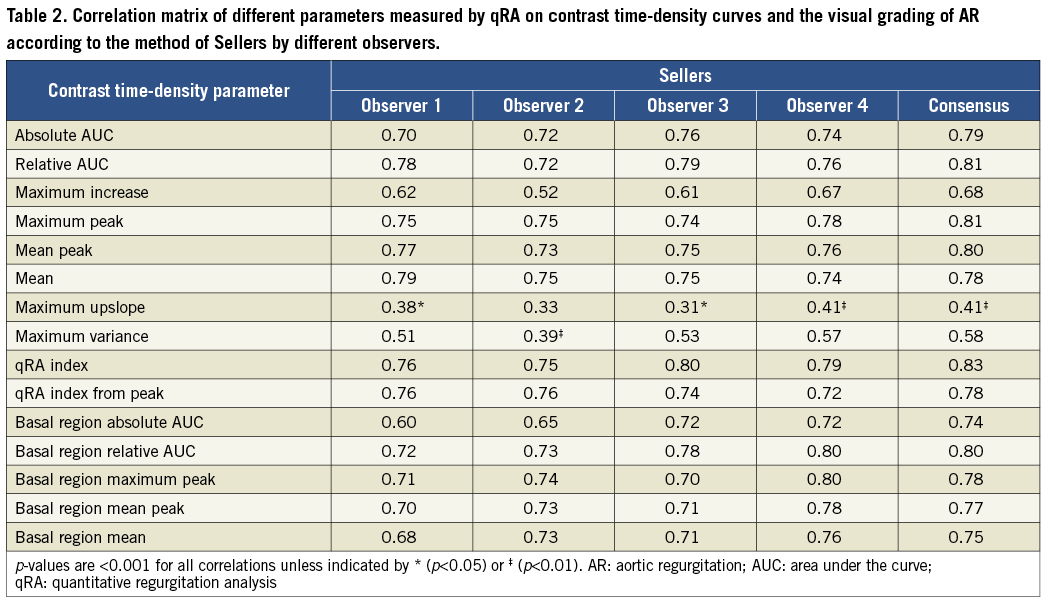
Several measurements from the qRA method were significantly correlated with the Sellers grading (Table 2). The strongest correlation was seen for relative area under the curve, peak contrast density, mean contrast density, qRA index and qRA index from peak. When only the basal segment of the left ventricle was used to measure contrast density changes, the correlations with Seller grading remained significant and were numerically only marginally lower, with basal region RAUC giving the best result (Table 2).
Interpretation of qRA measurements
To gain a provisional understanding of how to interpret the severity of AR based on the various measurements obtainable from qRA, the statistical distribution of parameters with a strong correlation with the Sellers grading was determined for each category of aortic regurgitation, as graded visually according to Sellers’ method (the consensus grading was used because it gave the highest correlation) (Table 3). Based on these data a guideline for interpretation of RAUC is as follows: 0.0-0.09 trivial, 0.1-0.19 mild, 0.20-0.29 moderate, 0.30-0.44 moderate-severe, ≥0.45 severe. Application of these guidelines to the measurement made by Observers 1 and 2 is shown in Figure 6A.
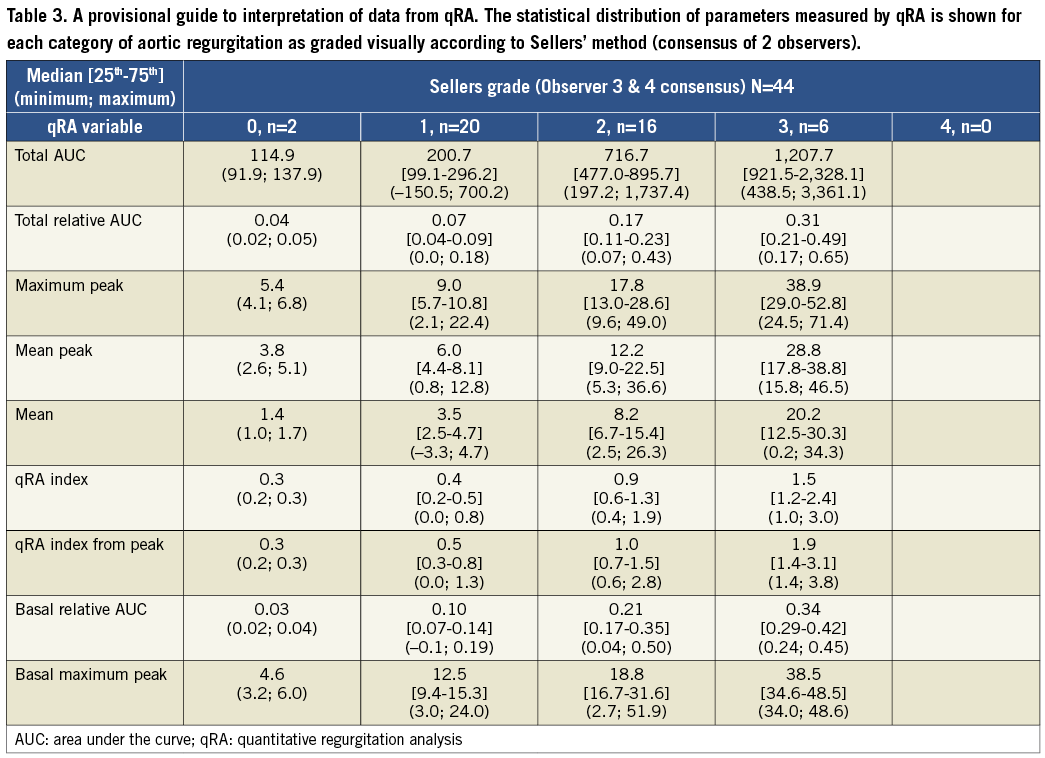
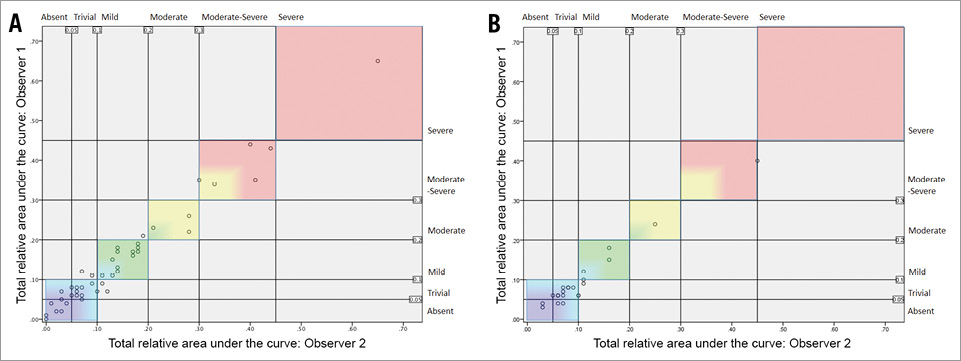
Figure 6. Scatter plot of relative area under the time-density curve (RAUC) as measured by two observers showing provisional interpretation of severity of aortic regurgitation generated from retrospective data (A) and applied to prospectively collected aortograms (B).
Prospectively collected aortograms
Of 32 prospectively collected aortograms a total of 22 (69%) were evaluable. Non-evaluability was due to breathing or over-projection of the descending aorta (i.e., non-adherence to acquisition guidelines). Measurements between the two observers were highly comparable for RAUC (mean±SD: 0.10±0.08 vs. 0.11±0.09, mean difference±SD: 0.01±0.02, p=0.04, r=0.98, p<0.001) and for qRA index (mean±SD: 0.5±0.4 vs. 0.6±0.4, mean difference±SD: 0.1±0.1, p<0.01, r=0.99, p<0.001). The application of these guidelines for interpretation of RAUC, which were developed from the retrospective cohort, to the measurement made by Observers 1 and 2 in the prospective cohort is shown in Figure 6B.
Discussion
This study demonstrates the feasibility of quantification of AR by measuring contrast density changes over time during contrast aortography. We report a high level of agreement between two independent observers for the quantitative method. In contrast, only moderate agreement was found for visual scoring between independent observers fully blinded to one another’s evaluation.
A key objective of this first study of qRA was to learn the image acquisition requirements and to come up with a proposal for standardised aortography. In addition to basic imaging parameters derived from the Sellers approach, we learned that over-projection of the descending aorta on the LV or ascending aorta has to be avoided. However, specifying an overlap-free projection was not simple because of variability in patient anatomy. Operators may be trained to judge the location of the descending aorta from the path of a transfemoral pigtail catheter. However, the aorta is much wider than the catheter, and the direction of catheter bias is unknown without contrast injection so that steeper angulations than anticipated are needed to allow an extra margin of error. Further work is needed to simplify the selection of an overlap-free C-arm angulation. We also learned that breathing motion is detrimental to image analysis, even when the diaphragms are not over-projected on the LV. Motion and overlap were the most common technical exclusions for calculating time-density curves of myocardial blush in the TAPAS trial11. The lack of optimised acquisition protocols for contrast aortography is also likely to deteriorate inter-observer variability in visual grading of AR, for example, by differential over-projection of the aortic root or LV on the spine or descending aorta10. Sixty-nine percent of aortograms were analysable when standardised acquisition criteria were applied prospectively, and this is likely to improve further with increasing familiarity. The non-analysability of 31% of aortograms was due to non-adherence to acquisition guidelines. Therefore, operators can change their imaging practice, despite the barriers of habit and pressure of time in the catheter laboratory, and in principle an analysability rate approaching 100% is feasible. Echocardiography image acquisition criteria for the reliable evaluation of AR are strict. Cardiologists in training memorise these criteria and practise echocardiography with feedback over a period of time to internalise a habit of good quality image acquisition. A broadly similar approach is needed to learn standardised aortography.
In this first study we report RAUC, and qRA index, as the primary variable for quantification of AR. RAUC is the single measure that includes the most data obtained from the time-density curves, and it forms the basis from which the qRA index is calculated. Modifying the quantitative analysis approach may obviate some of the technical image quality requirements. For example, the peak contrast density and the RAUC in the LV were both similarly correlated with the Sellers grade. Although the reference area in the aortic root is needed for normalisation of all variables, it is also an additional component of the formula for calculating RAUC, but not peak contrast density. In cases where the aortic root is overlapped or not fully in view, peak contrast density may be the preferable measure of AR severity. Similarly, the RAUC measured only in the basal segment may be useful when the LV apex is not fully in view or obscured. Further work is needed to clarify whether there is one optimal quantification approach, such as RAUC, qRA index or peak density, or several which may be best tailored to specific image criteria.
We report considerable overlap between different categories of visual AR grade with respect to RAUC and qRA index. Cohn et al reported in 167 patients who had aortography before surgical valve replacement that there was much overlap between different categories of AR as scored visually on cine-angiography12. Croft et al reported in 83 patients that regurgitant volume index, as calculated from the Fick principle and indicator dilution method, varied substantially between different categories of visually graded AR severity13. Michel et al studied 200 patients with a combination of quantitative ventriculography and indicator dilution techniques and reported wide scatter in regurgitant volume index and fraction with considerable overlap between different grades of AR scored visually14. Two small studies recently reported the feasibility of quantification of regurgitant fraction after TAVI with the CoreValve® bioprosthesis (Medtronic, Minneapolis, MN, USA) using velocity-encoded MRI15,16. Alternatively, vena-contracta planimetry on 3D TOE may be considered17. Although beyond the aims of the present study, calibration of the measurements obtained from time densitometry against a volumetric method is an essential next step to optimise application and interpretation of the results.
Limitations
A limitation is that contrast aortography cannot differentiate between valvular and paravalvular AR, which may impact on the choice of corrective measures.
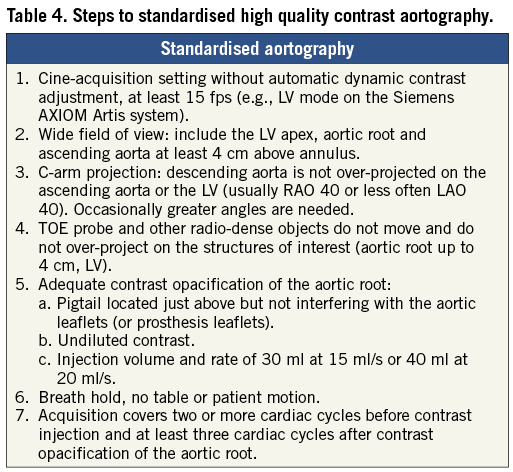
The gold standard used in this study, i.e., visual grading of AR according to Sellers’ method, is in daily use and semi-quantitative, but it is partly open to interpretation and shows only moderate reproducibility. However, it is prudent to demonstrate an acceptable reproducibility of the qRA method before proceeding to more burdensome investigations involving volumetric CMRI and quantitative echocardiography. The results of this study pave the way for comparison studies to a volumetric method which will inform the interpretation of the qRA approach. Visually adequate contrast opacification of the aortic root was a requirement but contrast injection volume and rate were not specified. Standardisation of injection parameters is likely to improve measurement reproducibility. Our experience suggests using undiluted contrast at an injection volume and rate of 30 ml at 15 ml/s or 40 ml at 20 ml/s. The proposed steps for standardisation of aortography are summarised in Table 4.
Conclusions
Quantification of aortic regurgitation by measurement of time-density changes on contrast aortography may improve the reproducibility of assessment of AR in the catheter laboratory. In keeping with other imaging modalities, standardisation of aortography makes measurement possible. Calibration against volumetric methods is needed to optimise the interpretation.
| Impact on daily practice Contrast aortography has conceptual advantages over echocardiography for assessment of AR after TAVI because the accumulation of contrast in the LV represents the sum total of multiple jets, irrespective of number, eccentricity and circuitous trajectories. The visual scoring of AR grade according to Sellers’ method is semi-subjective and only moderately reproducible. In contrast to all other imaging modalities, image acquisition and quality have not been standardised for aortography. This study proposes standardised image acquisition steps and quality criteria. As with other imaging modalities there is a learning curve to standardised high quality aortography image acquisition. Quantification of AR by measurement of contrast time-density changes on standardised aortography showed high inter-observer reproducibility, which was much improved over visual scoring according to Sellers’ method. |
Conflict of interest statement
P. de Jaegere is a proctor for Medtronic. G. Yong is a proctor for Edwards. T. Slots and J.P. Aben are employed by Pie Medical Imaging. The other authors have no conflicts of interest to declare.