Abstract
Aims: We sought to examine the feasibility and reproducibility of a new video densitometric (VD) quantification of aortic regurgitation (AR) on aortography, and its long-term clinical impact.
Methods and results: Using dedicated video densitometry software, AR after TAVI was quantified, and inter- and intra-observer reproducibility was investigated in 182 aortograms of the Brazilian TAVI registry. The aortograms were analysed using two software algorithms: 1) the quantitative regurgitation analysis (qRA) index interrogating the entire left ventricle (LV), and 2) a new method with the left ventricle outflow tract (LVOT) as a region of interest (ROI) (LVOT-AR). LVOT-AR was feasible in 64.8% vs. 29.7% of aortograms, compared with qRA index. Using the LVOT-AR, inter-observer variability was low (mean difference±standard deviation [SD]: 0.01±0.05, p=0.53), and the two observers’ measurements were highly correlated (r=0.95, p<0.001). Patients with LVOT-AR >0.17 had a significantly higher one-year all-cause mortality risk compared with patients with LVOT-AR ≤0.17 (37.1% vs. 11.2%, p=0.0008).
Conclusions: This study proposes an alternative methodology for AR assessment after TAVI by using the LVOT method (LVOT-AR) of VD angiography. The assessment of LVOT-AR is feasible, reproducible and potentially predictive of one-year mortality.
Abbreviations
AKI: acute kidney injury
AR: aortic regurgitation
AUC: area under the curve
AVR: aortic valve replacement
BAV: balloon aortic valvuloplasty
BMI: body mass index
CABG: coronary artery bypass grafting
CE: circumferential extent
COPD: chronic obstructive pulmonary disease
EuroSCORE: European System for Cardiac Operative Risk Evaluation
GFR: glomerular filtration rate
IQR: interquartile range
LV: left ventricle
LVEF: left ventricular ejection fraction
LVOT: left ventricle outflow tract
MI: myocardial infarction
NYHA: New York Heart Association
PCI: percutaneous coronary intervention
PG: pressure gradient
PVL: paravalvular leak
qRA: quantitative regurgitation analysis
RAUC: relative area under the curve
ROI: region of interest
SD: standard deviation
STS PROM: Society of Thoracic Surgeons Predicted Risk of Mortality
TAVI: transcatheter aortic valve implantation
TDC: time-density curves
TEE: transoesophageal echocardiography
VARC: Valve Academic Research Consortium
VD: video densitometric
Introduction
Aortic regurgitation (AR) after transcatheter aortic valve implantation (TAVI) is common and well-known as an adverse prognostic factor1-6. The reported prevalence of AR after TAVI varies from 40% to 67% for trivial to mild and from 7% to 20% for moderate to severe7. These inconsistencies in reported incidences of AR after TAVI are multifactorial and are, in part, due to differences in the method of assessment of AR, the parameters, criteria and thresholds used to grade AR, and the type of grading scheme used to classify the severity of AR8. Although the Valve Academic Research Consortium (VARC)-2 consensus document recommended an integrated echocardiographic approach with a special emphasis on the circumferential extent (CE) to assess the severity of AR after TAVI, this approach requires further validation9.
Aortography is a commonly used method for qualitative and semi-quantitative assessment of native AR, typically using the Sellers grades10. Conceptually, it has some advantages over echocardiography for AR quantification after TAVI as the contrast leaking to LV represents the sum of all regurgitant jets irrespective of their number, location and direction. Quantification of contrast time-density changes could be achieved by digital subtraction video densitometric (VD) assessment and was reported to improve reproducibility of AR adjudication on aortography11,12. By calculating relative area under the contrast time-density curve (RAUC), regurgitation fraction was calculated and validated in an experimental study13. Recently, Schultz et al14 reported a semi-automated method for time-density measurements, which highly correlated with Sellers’ grading but offered much better inter-observer agreement. However, the interrogation of the entire LV is not always feasible, and can be influenced by a number of background structures.
To eliminate the influence of background structures, the left ventricle outflow tract (LVOT) was chosen as the region of interest (ROI). This new method is called “LVOT-AR”. The aim of the present study was to examine the feasibility and reproducibility of this new VD method and to evaluate the clinical impact of AR after TAVI when adjudicated using LVOT-AR.
Methods
THE BRAZILIAN TAVI REGISTRY
The Brazilian TAVI registry is a multicentre registry which included a total of 418 patients with symptomatic severe aortic stenosis or degenerated bioprosthetic surgical valves who underwent TAVI in 18 Brazilian centres between January 2008 and January 2013. CoreValve® prostheses (Medtronic, Minneapolis, MN, USA) and SAPIEN XT prostheses (Edwards Lifesciences, Irvine, CA, USA) were implanted at a ratio of 360 (86.1%) to 58 (13.9%), principally using a transfemoral approach (96.2%)15. We analysed 182 aortograms, which represent all of the available aortograms provided by four participating centres of the Brazilian TAVI registry (Hospital Israelita Albert Einstein, São Paulo, Brazil; Instituto do Coração, São Paulo, Brazil; Instituto de Cardiologia, Porto Alegre, Brazil; Hospital Beneficência Portuguesa, São Paulo, Brazil). The CoreValve was deployed in 113 cases (62.1%), whereas the SAPIEN XT was deployed in the remaining cases. All adverse events and complications were retrospectively re-adjudicated by an independent clinical events committee according to the VARC-2 definitions9. The details of the inclusion and exclusion criteria, TAVI procedural technical aspects, and outcome definitions have been described elsewhere15, and details of the aortography and visual assessment of AR are described in the Online Appendix.
VIDEO DENSITOMETRIC AR ASSESSMENT
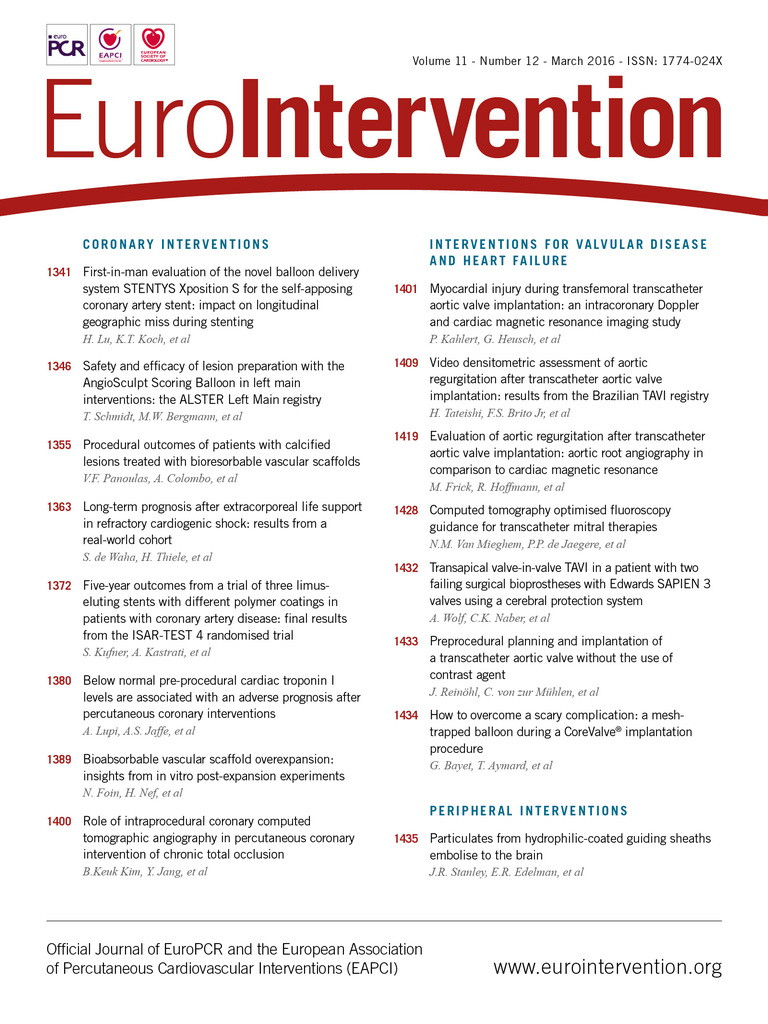
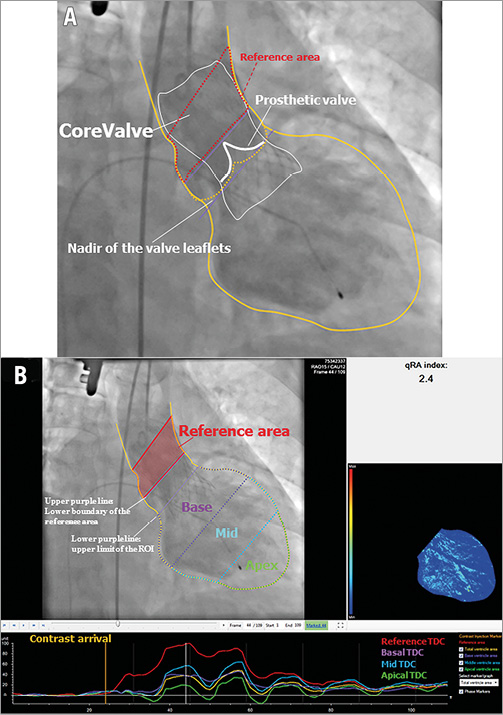
To quantify the severity of AR after TAVI, we used the dedicated video densitometry software CAAS A-Valve 2.0.2 (Pie Medical Imaging, Maastricht, The Netherlands). By using this software, contrast time-density curves (TDC) were generated using a semi-automatic algorithm. On the aortogram, the reference and the ROI were drawn to include the contrast-filled aortic root and the LV, and the base of the aortic root was indicated (Figure 1A). Five TDCs are created for three regions in the LV: base (subaortic segment), mid, and apex, for the total ventricle as well as the reference area in the aortic root. All ventricular values are normalised relative to the maximum density measurement in the reference region. For each of the TDCs, the AUC is automatically calculated as the time-density integral. The RAUC is automatically calculated as the AUC of the ROI as a fraction of the AUC of the reference area (Figure 1B). More technical details are presented in Online Figure 1A and Online Figure 1B.
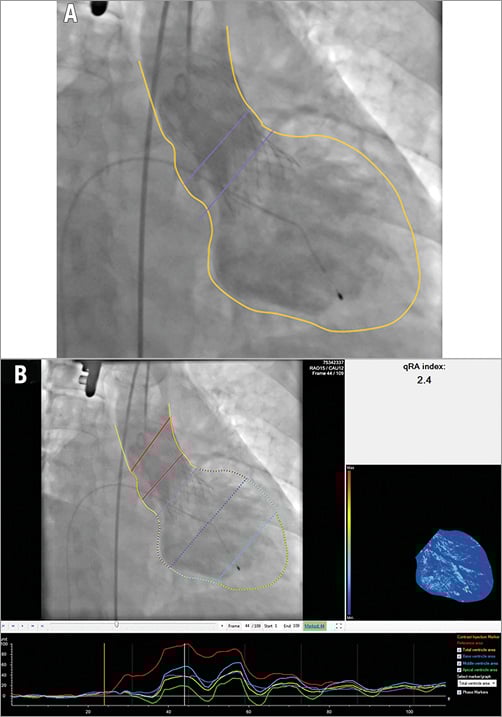
Figure 1. Tracing the contour of the ROI on an aortogram and generation of the time-density curves and colour-weighted contrast time-density map. A) The yellow line was manually drawn to define the contour of the reference region (the aortic root) and the ROI (the entire LV). The lower purple line was manually drawn at the nadir of the valve leaflets and represents the upper limit of the ROI. The upper purple line represents the lower boundary of the reference area. B) Upper left panel shows the two red lines enclosing the reference area. The entire LV is automatically divided into three segments: the subaortic segment - purple, the mid segment - blue, and the apical segment - green. These colours correspond to the colours of the time-density curves in the lower panel. The upper right panel shows the colour-weighted contrast time-density map based on the contrast time density for each LV segment (Online Appendix). LV: left ventricle; ROI: region of interest
THE qRA INDEX OF THE ENTIRE LV
The qRA index weighs the summated pixel density for the ROI (the entire LV) over three cardiac cycles against that of the reference region using a dedicated algorithm, finally yielding a severity scale analogous to the Sellers grades ranging from 0 (no regurgitation) to 4 (severe regurgitation). When the contrast in the descending aorta overlaps on the LV-ROI within three cardiac cycles (Figure 2A), the case is defined as not “analysable” for calculating the qRA index.
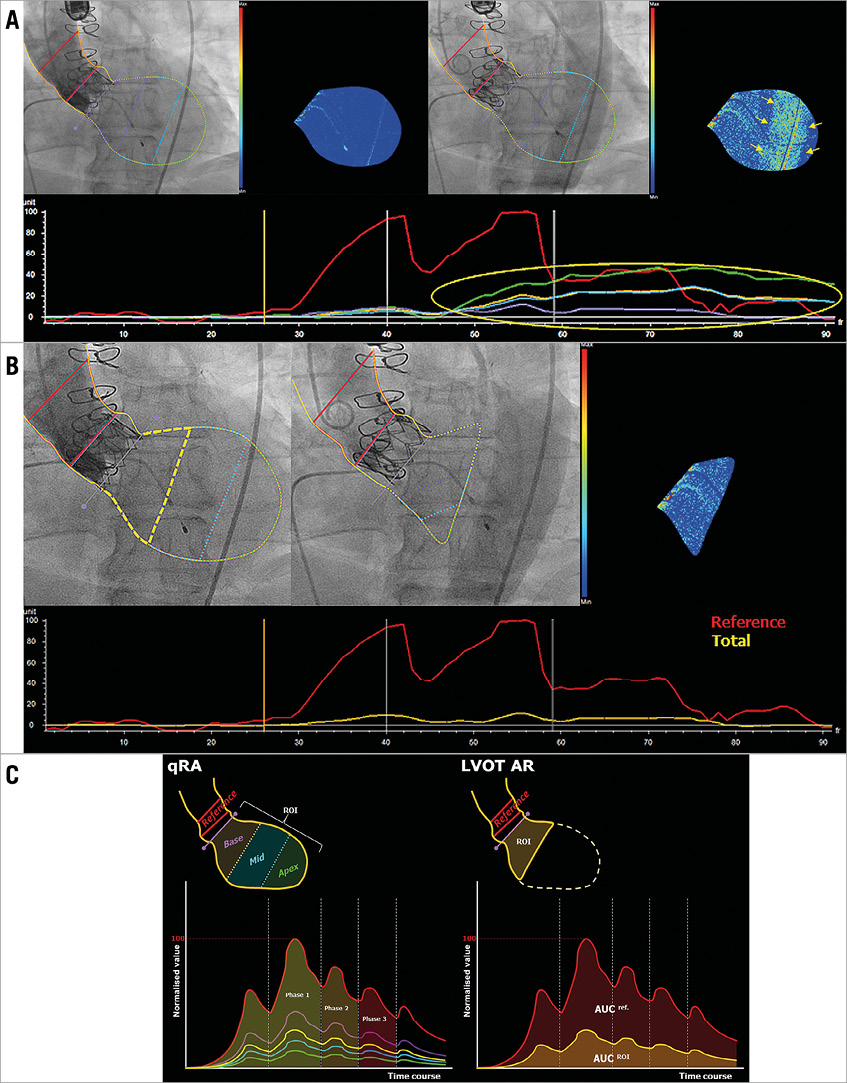
Figure 2. Representative images of the advantage of LVOT-AR. A) A trace of aortic regurgitation can be seen (upper left panel) just after the contrast is injected to the aortic root. Later on, the contrast-filled descending aorta overlaps the LV (upper right panel), causing a spurious increase in the contrast density (yellow circle and arrows) as detected on the time-density curves (lower panel) and the colour-density map. B) The contour of the ROI confined to the subaortic segment (LVOT-AR: yellow dashed line in upper left panel) and excluding the region of the descending aortic overlap so that the spurious increase in the contrast density can be corrected (upper middle and right, and the time-density curve in lower panel). C) Diagrammatic representation of qRA index and LVOT-AR. Left panel: the ROI includes all three LV segments and the five TDCs are generated. qRA index algorithm is based on comparing the AUC of the three LV segments (basal - purple, mid - blue, and apical - green) versus the AUC of the reference region (aortic root - red). RAUC can also be computed for the whole ventricle by comparing the AUC of the entire ventricle (yellow) to that of the reference region. The calculation is made over three cardiac cycles (phases 1-3). Contrast-density values in the ROI are normalised to the peak density value in the reference region, which is given a value of 100. Right panel: the ROI is confined to the subaortic segment (basal segment), and the RAUC is the ratio between the AUC of the subaortic segment (yellow curve) and the reference region (red curve). AR: aortic regurgitation; LV: left ventricle; LVOT: left ventricle outflow tract; qRA: quantitative regurgitation analysis; RAUC: relative area under the curve; ROI: region of interest
RAUC OF THE LVOT (LVOT-AR)
When LVOT-AR is analysed, the contour of the ROI is modified to include the subaortic LV segment instead of the entire LV (Figure 2B, Figure 2C). In contrast with the qRA index, in which the algorithm is usable only when the entire LV is interrogated, RAUC ranges from 0 to 1. Zero indicates that there is no contrast in the ROI, and 1 indicates that the density of contrast in the ROI is the same as in the reference area.
REPRODUCIBILITY OF ASSESSMENT OF qRA INDEX AND LVOT-AR
Two trained observers (H. Tateishi and C.M. Campos) graded the severity of AR according to qRA index and LVOT-AR methods in 40 randomly selected cases. Observers 1 and 2 graded each aortogram independently and were blinded to one another’s results and to the grade of AR as determined by the method other than the one being tested at the time. Observer 1 (H. Tateishi) re-analysed the angiograms after an interval of four weeks to test intra-observer agreement.
STATISTICAL ANALYSIS
Continuous data are presented as mean±standard deviation (SD) if normally distributed or as median and 95% confidence interval (CI) or interquartile range (IQR) if not normally distributed. Continuous variables were tested for normal distribution with the use of the Shapiro-Wilk test and verified by histograms. Categorical variables are given as frequencies and percentages. For continuous variables, a Student’s t-test was performed for comparison between two groups. For categorical variables, the chi-square test or Fisher’s exact test was used for comparisons. For the evaluation of inter-observer differences the Student’s t-test for paired samples was used, scatter and Bland-Altman difference plots were generated, and intra-class correlation coefficient for absolute agreement (ICCa) was estimated.
Time-to-event analysis was performed with the use of Kaplan-Meier estimation, while comparison between the groups was done by using the log-rank test. To test the association of the LVOT-AR with mortality, Cox proportional hazards regression analysis was performed. Statistical analysis was performed with SPSS, Version 22 (IBM Corp., Armonk, NY, USA) and MedCalc, version 14.12.0 (MedCalc Software, Ostend, Belgium). A two-tailed p<0.05 defined the statistical significance.
Results
FEASIBILITY OF VD GRADING OF AR
Of 182 aortograms, 40 aortograms with the guidewire or the catheter remaining across the prosthetic valve were excluded. Five more cases were excluded due to other causes, including inadequate image quality from table motion, inadequate opacification of the aortic root or aortic root dissection during the procedure.
When qRA index of the entire LV was calculated, 83 out of 137 aortograms were defined as non-analysable. The causes of non-analysability were: fewer than three cardiac cycles available for analysis (40 cases); the diaphragm and/or bowel gas overlapping with the ROI (19 cases); the LV not fully in view (17 cases); the contrast-filled descending aorta completely overlapping with the ROI (five cases); strong breathing/lack of breath holding (one case); and over-projection of dense objects overlapping with the ROI (one case). Consequently, 54 cases (29.7%) were finally defined as analysable for qRA index. Figure 3 presents the flow chart of steps which were followed to identify analysable aortograms.
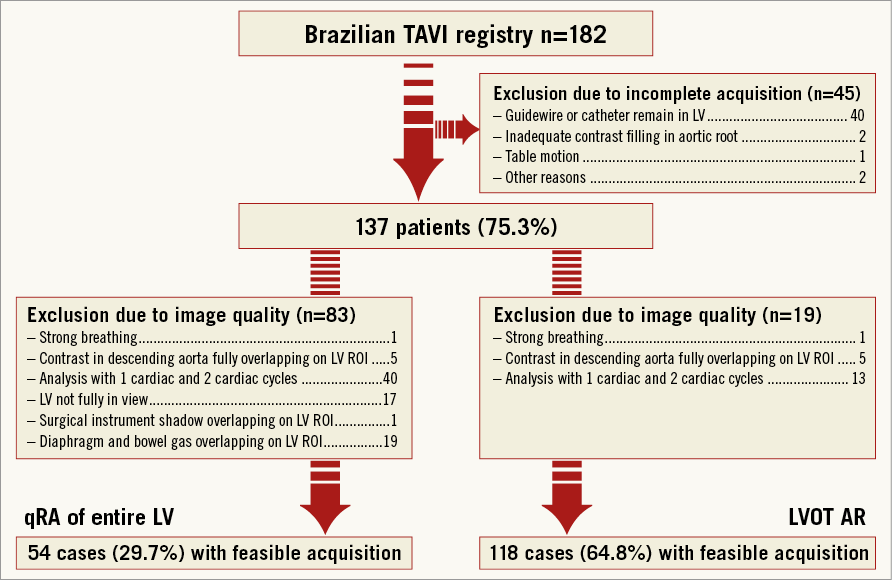
Figure 3. Study profile. AR: aortic regurgitation; LV: left ventricle; LVOT: left ventricle outflow tract; qRA: quantitative regurgitation analysis; ROI: region of interest; TAVI: transcatheter aortic valve implantation
When interrogation was confined to the LVOT as an ROI (LVOT-AR), only 19 aortograms were defined as non-analysable. The reasons for non-analysability were: fewer than three cardiac cycles available for analysis (13 cases); the contrast-filled descending aorta overlapping with the LVOT (five cases); and strong breathing/lack of breath holding (one case). Consequently, 118 cases (64.8%) were finally defined as analysable for LVOT-AR.
REPRODUCIBILITY OF VD METHODS OF AR QUANTIFICATION
Among the 40 randomly selected angiograms for reproducibility analysis, there was no significant inter-observer difference in either qRA index (mean±SD: 1.04±0.75 vs. 1.14±0.76, mean difference±SD: 0.10±0.32, p=0.0531) or LVOT-AR (mean±SD: 0.16±0.17 vs. 0.17±0.18, mean difference±SD: 0.01±0.05, p=0.5280). Inter-observer correlation was high (r=0.91 for qRA index, r=0.95 for LVOT-AR, p<0.001 for both) and ICCa showed a good agreement (0.91 for qRA index, 0.95 for LVOT-AR). The scatter diagrams with regression line and Bland-Altman plots are shown in Figure 4 and Figure 5.
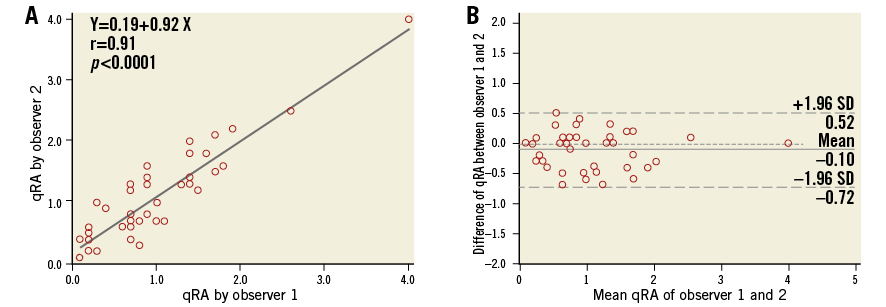
Figure 4. Scatter diagram with regression line and Bland-Altman plots of the qRA index assessed by two observers. A) The two observers’ readings were highly correlated. B) There was no significant difference between the two observers’ readings (mean±SD: 1.04±0.75 vs. 1.14±0.76, mean difference±SD: 0.10±0.32, p=0.0531). qRA: quantitative regurgitation analysis; SD: standard deviation
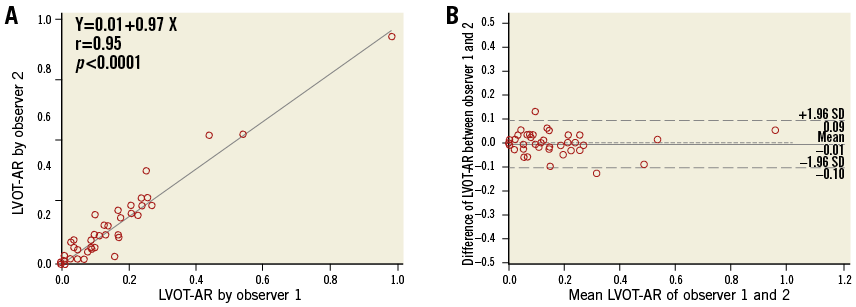
Figure 5. Scatter diagram with regression line and Bland-Altman plots of the LVOT-AR by the two observers. A) The two observers’ readings showed a high correlation. B) There was no significant difference between observers 1 and 2 in LVOT-AR measurements (mean±SD: 0.16±0.17 vs. 0.17±0.18, mean difference±SD: 0.01±0.05, p=0.5280). AR: aortic regurgitation; LVOT: left ventricle outflow tract; SD: standard deviation
Intra-observer variability, for both qRA index and LVOT-AR, was low with the 1st and the 2nd analyses highly correlated (r=0.94, r=0.97, respectively). The ICCa also showed a good agreement (0.94 for qRA index, 0.97 for LVOT-AR). There were no significant differences between the 1st and the 2nd analyses in either qRA index (mean±SD: 1.02±0.74 vs. 1.00±0.71, mean difference±SD: 0.02±0.25, p=0.6565) or LVOT-AR (mean±SD: 0.16±0.17 vs. 0.15±0.18, mean difference±SD: 0.01±0.04, p=0.3261). The scatter diagrams with regression line and Bland-Altman plots are shown in Figure 6 and Figure 7.
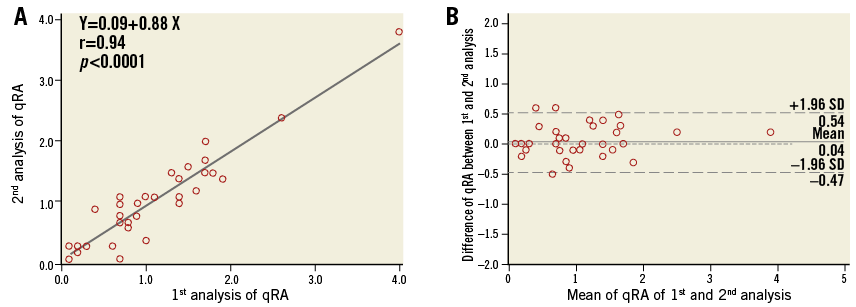
Figure 6. Scatter diagram with regression line and Bland-Altman plots of qRA index of two analyses by the same observer. A) A high intra-observer correlation of qRA index readings. B) There was no significant difference of qRA index between the 1st analysis and the 2nd analysis (mean±SD: 1.02±0.74 vs. 1.00±0.71, mean difference±SD: 0.02±0.25, p=0.6565). qRA: quantitative regurgitation analysis; SD: standard deviation
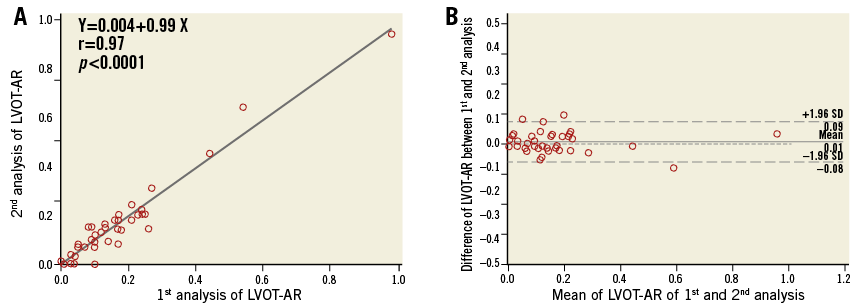
Figure 7. Scatter diagram with regression line and Bland-Altman plots of LVOT-AR of two analyses by the same observer. A) The two analyses of LVOT-AR were also highly correlated denoting a good intra-observer agreement. B) There was no significant difference of LVOT-AR between the 1st analysis and the 2nd analysis (mean±SD: 0.16±0.17 vs. 0.15±0.18, mean difference±SD: 0.01±0.04, p=0.3261). AR: aortic regurgitation; LVOT: left ventricle outflow tract; SD: standard deviation
AR AFTER TAVI
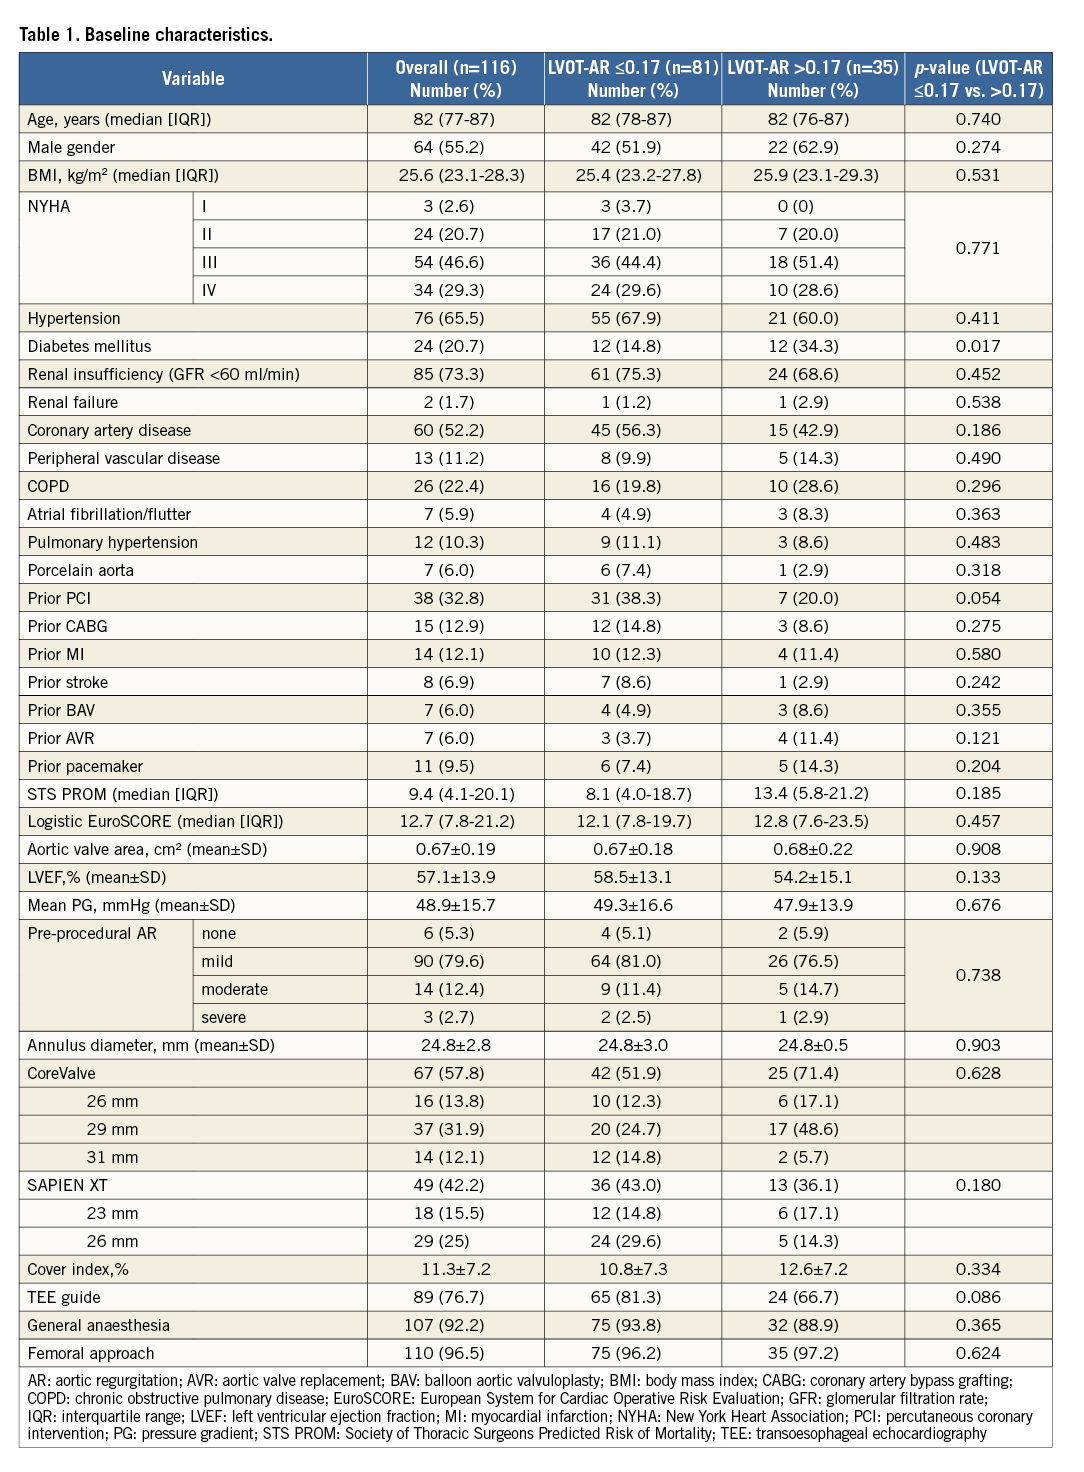
In 118 patients analysable for LVOT-AR, post-TAVI AR visual grade (Sellers grade) was 0 in 12% (n=14), I in 58% (n=68), II in 26% (n=31) and III in 4% (n=5) (Online Figure 2). The mean, median and 95% CI values for qRA index and LVOT-AR were 1.1, 1.0 and 0.9-1.2, and 0.14, 0.12 and 0.08-0.14, respectively. The optimal LVOT-AR cut-off value for the prediction of all-cause mortality was calculated by receiver-operating characteristic curve analysis: based on LVOT-AR 0.17 as a cut-off value, patients were dichotomised into two groups. Eighty-one patients had LVOT-AR ≤0.17 and 35 patients had LVOT-AR >0.17. Of 35 patients who had LVOT-AR >0.17, twenty patients suffered from AR defined as Sellers grade >I. Table 1 and Online Table 1 show the comparisons between groups.
CLINICAL IMPACT OF LVOT-AR
Of 118 patients analysable for LVOT-AR, follow-up data were available for 116 patients (median [IQR]: 9.4 [4.1-20.1]% for STS score; 12.7 [7.8-21.2]% for logistic EuroSCORE). Sixty-seven CoreValve and 49 SAPIEN XT were implanted in this population. The mean±SD of LVOT-AR for CoreValve and SAPIEN XT was 0.14±0.14 and 0.14±0.12 (CoreValve vs. SAPIEN XT, p=0.849), respectively. The mean follow-up time was 609 days and total number of deaths was 39 during the entire follow-up (22 deaths within one year).
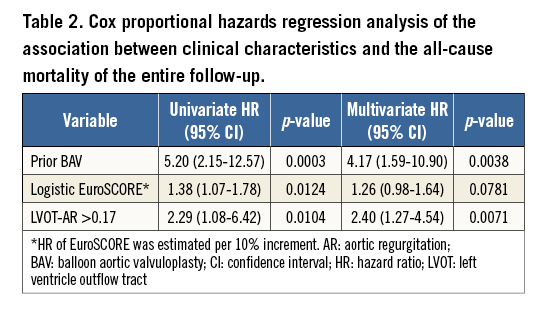
Patients with LVOT-AR >0.17 had a significantly increased one-year all-cause mortality compared with the patients who had LVOT-AR ≤0.17 (37.1% vs. 11.2%, hazard ratio [HR]: 3.82 [1.50-9.75, 95% CI], p=0.0008) (Figure 8). In multivariate Cox proportional hazards regression analysis, LVOT-AR >0.17 independently predicted all-cause mortality for the entire follow-up period (HR: 2.40 [1.27-4.54, 95% CI], p=0.0071) (Table 2). In our study the history of balloon aortic valvuloplasty (BAV) independently predicted the all-cause mortality. According to a previous report2, a history of prior BAV could represent a high-risk subset of patients with poorer baseline presentation.
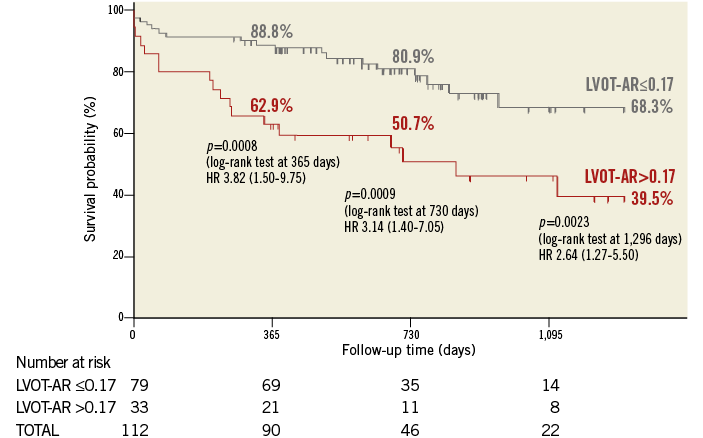
Figure 8. Kaplan-Meier estimation and log-rank test of cumulative survival according to the LVOT-AR. AR: aortic regurgitation; LVOT: left ventricle outflow tract
Discussion
The main findings of the present study are that: 1) LVOT-AR improves the feasibility of VD quantification of AR after TAVI, 2) a high level of inter- and intra-observer reproducibility was obtained with this new method, 3) LVOT-AR potentially predicts long-term all-cause mortality after TAVI.
The main concept of the LVOT-AR method of VD aortography is to eliminate the influences of background structures, thus improving feasibility, without missing an AR jet. It is not always feasible to interrogate the entire LV adequately due to diaphragmatic over-projection, descending aortic overlap or failure to include the apex in view14.
The advantages of LVOT-AR are that it can eliminate the influence of overlapping structures, especially the contrast-filled descending aorta (Figure 2), and that the inclusion of the apex is not necessary. In addition to the better feasibility, the restriction of the ROI to the subaortic segment may be more suitable for the detection of PVLs which tend to be small, eccentric and serpiginous with limited penetration towards the LV apex.
An inherent limitation of the angiographic assessment of AR is that it does not take into account the volume of the receiving chamber (LV). For example, the same amount of contrast can leak into a dilated LV and become more diluted or into a small LV and become less diluted. This phenomenon can confound the visual impression on the degree of “opacification”. However, the impact on the VD method is much less pronounced by “opacification”. VD weighs the sum of pixels in the ventricle over at least three cardiac cycles rather than reflecting the instantaneous faintness of opacification, as visual grading does. Furthermore, we believe that the assessment of AR in the LVOT may be less affected by LV dilation, geometry and contractility, as Klein et al suggested in a previous report12.
Prompt detection of PVL after device deployment allows the operator to undertake corrective measures that can seal the leakage. Echocardiographic quantification of PVL, mostly using qualitative and semi-quantitative parameters, is operator-dependent and challenged by image quality during the procedure. Haemodynamic indices can be an integral part of the periprocedural assessment of PVL, given their availability and potential prognostic value. The aortic regurgitation index (ARI) should be readily feasible, quick with robust reproducibility, but, regrettably, is calculated with the catheter passing across the prosthetic valve, disrupting its competence.
LVOT-AR cannot differentiate between transvalvular and paravalvular AR, which may impact on the choice of corrective measures, as well as these haemodynamic indices.
Therefore, a multimodality approach that combines echocardiographic, angiographic, and haemodynamic parameters is recommended for the assessment of PVL8,16,17. This concept was recommended by the cardiovascular imaging societies’ guidelines and also by the VARC-2 consensus document8,18.
Study limitations
Our study is based on a retrospective data analysis of a relatively small number of patients. The limitations of this study are those inherent to retrospective studies where data have been collected in a clinical context.
LVOT-AR was not validated against parameters of other modalities. For further investigation, a prospective study that compares LVOT-AR with echocardiographic parameters based on VARC-2 criteria, quantitative Doppler or cardiac magnetic resonance should be proposed.
Another limitation is the difficult tracing of the contour of the ROI in case of a small AR that faintly opacifies the LV. This limitation would be even more troublesome if the entire LV is chosen as an ROI. Inadequate contrast opacification of the reference region (aortic root), lack of standardisation of injection parameters and projection selection, and the influence of breathing motion are all limitations inherent to any angiographic measurement and can influence accuracy and reproducibility. The feasibility of LVOT-AR in the current study might not be compatible with the clinical generalisation of the method. Any upcoming prospective study should include an “angiographic acquisition protocol” which should consider the most important reasons which accounted for the reduced feasibility based on the current study.
Conclusion
LVOT-AR is a new VD angiographic method which provides quick and reproducible quantification of AR after TAVI with a reasonable predictability of clinical outcomes. This method can be combined with haemodynamic indices of AR severity and with echocardiographic assessment of the origin and mechanism of AR after TAVI. This combination should provide quick decision making and timely provision of countermeasures against AR.
| Impact on daily practice The assessment of the LVOT-AR can judge the severity of PVL and potentially predicts long-term all-cause mortality after TAVI. The current study provides this simple, objective and reproducible parameter that can be integrated into the periprocedural multimodality approach to detect and quantitate PVL. Our study suggests that this method can also be a useful prognostic marker. |
Guest Editor
This paper was guest edited by Josep Rodés-Cabau, MD; Cardiology Department, Quebec Heart & Lung Institute, Laval University, Quebec City, Quebec, Canada. The Guest Editor, J. Rodés-Cabau, has received research grants from Edwards Lifesciences, St. Jude Medical and Medtronic.
Conflict of interest statement
F. Brito and M. Perin are proctors for Edwards Lifesciences and Medtronic. P. Lemos and R. Leite are proctors for Medtronic. L. Bary is an employee of Pie Medical Imaging. The other authors have no conflicts of interest to declare.
Supplementary data
Online Appendix. Angiography and visual assessment of AR
Single or biplanar aortic root angiography was performed using at least 20 ml of non-ionic contrast injected through a pigtail catheter positioned 2 to 3 cm above the prosthetic valve. The decision on the contrast volume and injection speed, catheter size, and the projection were left to the discretion of the operators. Final aortography was performed at least 10 minutes after valve implantation in the same projection as the pre-procedural aortography.
Two trained observers (H. Tateishi, C.M. Campos) visually graded the severity of AR according to the Sellers grading. Both observers graded each aortogram independently and blinded to one another’s results. After scoring all aortograms, any discrepancies were re-reviewed simultaneously by both observers and resolved by consensus.
Online Figure 1. Tracing the contour of the ROI on an aortogram. A) Aortogram in the right anterior oblique projection after TAVI with a CoreValve. The yellow line was manually drawn to define the contour of the reference region (the aortic root) and the ROI (the entire LV). The lower purple line was manually drawn at the nadir of the valve leaflets (corresponding to the annular plane) and represents the upper limit of the ROI. The upper purple line represents the lower boundary of the reference area. The distance between the two lines is automatically set after manual drawing of the lower one (at a default height of 15 mm). The area between the two purple lines is excluded from both the LV and reference area calculations (as the attachment of the semilunar cusps throughout the length of the aortic root or the heart valve stent interferes with the clear discrimination between the LVOT and the aortic root). B) Upper left panel shows the two red lines enclosing the reference area, which has a default height of 30 mm. The entire LV is automatically divided into three segments of equal height: the subaortic segment (purple), the mid segment (blue), and the apical segment (green). These colours correspond to the colours of the time-density curves in the lower panel. The upper right panel shows the colour-weighted contrast time-density map based on the contrast time density for each LV segment. LV: left ventricle; LVOT: left ventricle outflow tract; ROI: region of interest
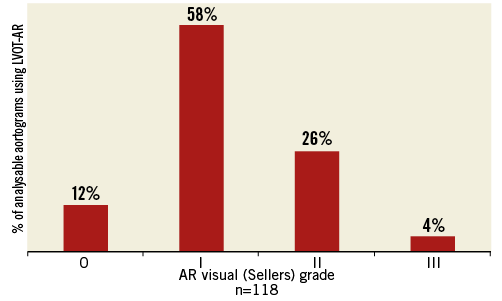
Online Figure 2. Prevalence of aortic regurgitation, using visual assessment (Sellers grade). AR: aortic regurgitation; LVOT: left ventricle outflow tract