Abstract
Aims: The aim of this study was to evaluate the intermediate-term clinical impact of aortic regurgitation (AR) after transcatheter aortic valve implantation (TAVI) using a novel quantitative angiographic method taking into account the influence of pre-existing AR.
Methods and results: AR after TAVI was quantified in 338 patients (age 82 [78-86] years; 55% male) and the influence on intermediate-term all-cause mortality was evaluated. In 228 aortograms, AR was quantitated using a dedicated videodensitometric method focused in the left ventricular outflow tract (LVOT-AR). Patients with LVOT-AR >0.17 had a significantly increased all-cause mortality at three years, compared with patients who had LVOT-AR ≤0.17 (adjusted hazard ratio [HR]: 1.73, 95% confidence interval [CI]: 1.05-2.86, p=0.032). Taking the influence of pre-existing AR into account, patients with post-procedural LVOT-AR >0.17 and ≤mild pre-existing AR had a significantly increased mortality at two years, compared to patients with LVOT-AR >0.17 and >mild pre-existing AR (HR: 2.55, 95% CI: 1.16-5.58, p=0.029). In those with >mild pre-existing AR (n=70), post-TAVI LVOT-AR >0.17 was not associated with increased mortality (HR: 0.77, 95% CI: 0.31-1.91, p=0.578).
Conclusions: AR after TAVI could be quantitated utilising LVOT-AR. The cut-point of >0.17 indicates a significant AR pertaining to increased intermediate-term mortality, especially in those with no significant pre-existing AR.
Introduction
Aortic regurgitation (AR), typically paravalvular, is a common complication of transcatheter aortic valve implantation (TAVI)1-5. Moderate to severe AR after TAVI is well known as an adverse prognostic factor on short- and long-term survival, while the impact of mild AR on clinical outcomes continues to be debated6.
Although new-generation transcatheter heart valves (THVs) have been developed7-11, accompanied by a dramatic reduction of paravalvular leakage (PVL) severity12, mild AR is still identified in 12-64% of patients after TAVI8-10,13. Therefore, timely accurate quantitation of AR after TAVI continues to have important prognostic and therapeutic implications.
In the context of long-standing aortic stenosis (AS), even mild AR that develops acutely after TAVI might result in serious haemodynamic consequences14. When the non-compliant left ventricle (LV) is subjected to acute volume overload, failure to increase the end-diastolic volume leads to an undue rise of the end-diastolic pressure and a decrease of the forward stroke volume15. However, if AR co-exists with AS at baseline, the LV is preconditioned and could, theoretically, better tolerate the volume overload imposed by post-TAVI AR. Although this theory is often considered when studying the clinical impact of AR after TAVI, little evidence is available to support this concept16-18.
Recently, an angiographic videodensitometric (VD) method for quantification of AR after TAVI has been shown to be more objective, quantitative and reproducible than the classic visual assessment19. VD analysis of the AR jet interrogating the entire LV is, however, not always feasible and can be influenced by a number of background structures19. Alternatively, interrogation could be confined to the left ventricular outflow tract (LVOT) and has recently been reported to be more feasible and reproducible than the entire LV method20 and to be a useful prognostic index20. Additionally, LVOT-AR could be less prone to the influence of the variability in LV geometry and contractility21.
The aim of the present study was to evaluate the intermediate-term clinical impact of AR after TAVI using LVOT-AR, taking into account the influence of pre-existing AR.
Methods
STUDY DESIGN AND POPULATION
The present study included all cases with complete angiographic data from a multicentre registry (399 patients who were enrolled between January 2008 and January 2013). The list of participating centres, details of inclusion and exclusion criteria, TAVI procedure technical aspects, and adjudication of adverse events have been previously described22.
ANGIOGRAPHY AND VISUAL ASSESSMENT OF AR
Aortic root angiography was performed in all cases before and after valve implantation to quantitate pre-existing and post-TAVI de novo AR. Final aortography was performed at least 10 minutes after final THV deployment.
Four trained cardiologists (H. Tateishi, M. Abdelghani, R. Cavalcante, and Y. Miyazaki) graded the severity of AR according to Sellers grading23 and videodensitometry. Analysis was performed by this academic consortium independent of the investigators at the recruiting sites. In 100 randomly selected aortograms, two observers graded each aortogram independently and blinded to each another’s analysis. Inter-observer agreement on the grade of AR was substantial (weighted kappa=0.70).
VIDEODENSITOMETRIC AR ASSESSMENT
To quantify the severity of AR after TAVI, we used dedicated videodensitometry software (CAAS A-Valve 2.0.2: Pie Medical Imaging, Maastricht, the Netherlands). On the aortogram, the reference and the region of interest (ROI) are drawn to include the contrast-filled aortic root and the LV, and the base of the aortic root is indicated (Figure 1A, Figure 1B). Contrast time-density curves (TDCs) are generated for the reference area and the ROI (Figure 1B). The area under the TDC of the ROI (AUC) is automatically calculated as the time-density integral. The relative AUC (RAUC) is automatically calculated as the AUC of the ROI as a fraction of the AUC of the reference area.
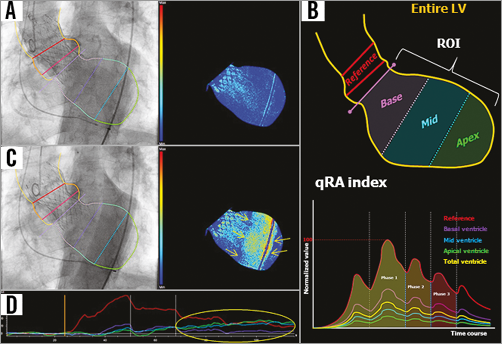
Figure 1. Tracing the contour of the region of interest on an aortogram and generation of the time-density curves and colour-weighted contrast time-density map for qRA index. A) The yellow line was manually drawn to define the contour of the reference region and the ROI. The right panel shows the colour contrast time-density map based on the contrast time-density for the LV segment. B) The entire LV is automatically divided into three segments: the base segment - purple, the mid segment - blue, and the apical segment - green. These colours correspond to the colours of the time-density curves in the lower panel. The qRA index algorithm is based on comparing the AUC of the three LV segments versus the AUC of the reference region. C) The contrast-filled descending aorta overlaps the LV ROI. The right panel shows a spurious increase in the contrast density (yellow arrows) as detected on the colour-density map, as well as on the time-density curves (D, yellow circle). LV: left ventricle; qRA: quantitative regurgitation analysis; RAUC: relative area under the curve; ROI: region of interest
The feasibility of generating the RAUC is influenced by breathing motion and objects overlapping the reference region and/or the ROI, such as the contrast-filled descending aorta (Figure 1C, Figure 1D). For mortality analysis in the present study, we used the LVOT-AR method (Figure 2) to improve reproducibility and feasibility20, and to minimise the influence of LV geometric and functional variability21. RAUC theoretically ranges from zero to one. Further technical details have been reported previously19,20.
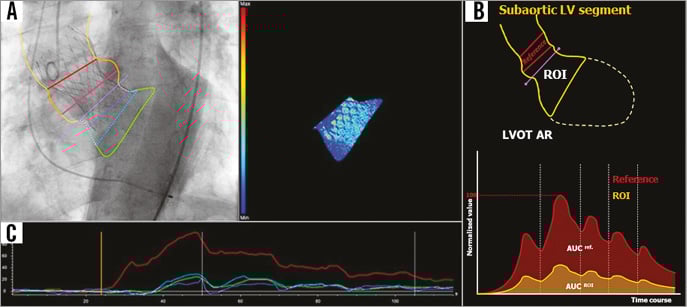
Figure 2. Representative consequences of utilisation of LVOT-AR. A) & B) The contour of the ROI confined to the subaortic segment (LVOT-AR: yellow contour in B). On the lower panel of B, LVOT-AR is shown by calculation of RAUC, which is the ratio between the AUC of the subaortic segment (yellow curve) and the reference region (red curve). C) After exclusion of the region of the descending aortic overlap, the spurious increase (Figure 1D) in the contrast density can be corrected. AR: aortic regurgitation; LV: left ventricle; LVOT: left ventricular outflow tract; RAUC: relative area under the curve; ROI: region of interest
ECHOCARDIOGRAPHIC ASSESSMENT
Transthoracic echocardiography examinations were performed at baseline and analysed at each centre. The following parameters were evaluated in all patients: LV dimensions, mass index (LVMI) and ejection fraction (EF), peak and mean pressure gradients (PG) across the aortic valve, aortic valve area (AVA) and the presence and severity of mitral regurgitation (MR). Echocardiographic analysis was performed in accordance with the recommendations of the American Society of Echocardiography/European Association of Echocardiography24.
STATISTICAL ANALYSIS
Continuous variables are presented as median and interquartile range (IQR) because of rejected normal distribution, and were tested for normal distribution using the Shapiro-Wilk test. Categorical variables are summarised as frequencies and percentages. For continuous variables, the Student’s t-test was performed for comparison between the two groups. For categorical variables, the chi-square test was used for comparisons. The optimal LVOT-AR cut-off value for the prediction of all-cause mortality was calculated by receiver-operating characteristic (ROC) curve analysis. Time-to-event analysis was performed using Kaplan-Meier estimation, while comparison between the groups was carried out by using the log-rank test. To test the association of LVOT-AR with mortality, multivariable Cox proportional hazards regression analysis was performed for all-cause mortality through the entire follow-up, using baseline variables which are predictors of all-cause mortality in the univariate analysis with entry/stay criteria of p-value=0.20/0.10 in a backward stepwise fashion. LVOT-AR, EuroSCORE, LVMI, and LVEF <50 were then forced into the final model.
Statistical analysis was performed with SPSS, Version 22 (IBM Corp., Armonk, NY, USA) and MedCalc, Version 14.12.0 (MedCalc Software, Ostend, Belgium). A two-tailed p<0.05 defined the statistical significance.
Results
Out of 399 aortograms, 61 aortograms with the guidewire or the catheter passing across the prosthetic valve during angiographic acquisition were excluded. When interrogation was confined to the LVOT as a ROI (LVOT-AR), 228 (67.5%) aortograms were analysable and these patients constituted the study population. The reasons for non-analysability are shown in Figure 3 which represents the flow chart of steps that were followed to identify analysable aortograms.
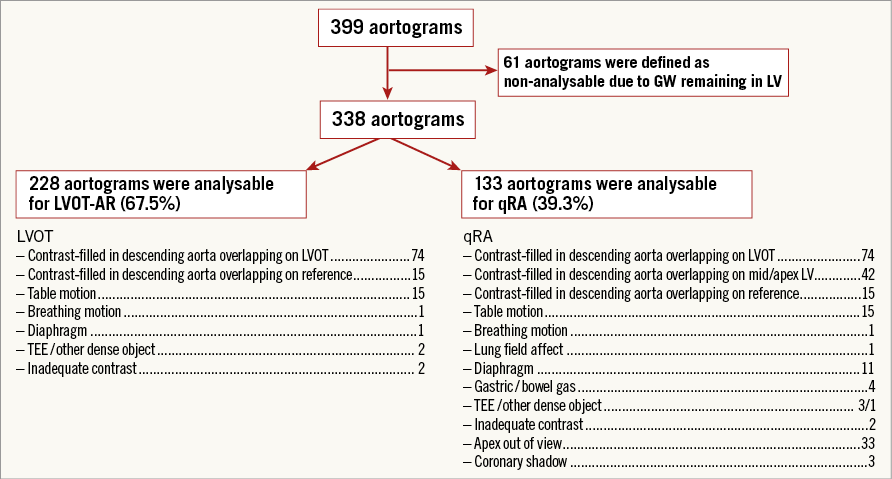
Figure 3. Flow chart of steps followed to identify analysable aortograms.
PREPROCEDURAL AND POST-PROCEDURAL AR ASSESSMENTS
Pre-TAVI AR visual grade was 0 in 28 (13.9%), I in 103 (51.2%), II in 53 (26.4%) and III in 17 (8.5%) patients (Figure 4). Post-TAVI AR visual grade was 0 in 19 (8.3%), I in 142 (61.7%), II in 57 (25.7%) and III in 10 (4.3%) patients.
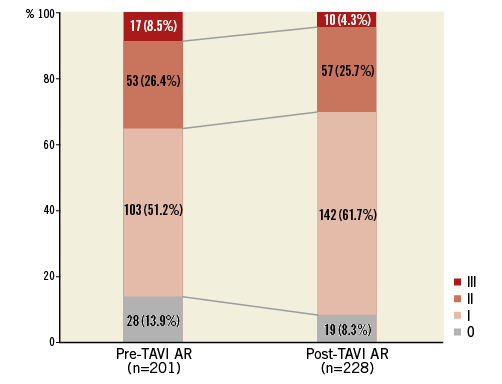
Figure 4. Prevalence of pre-TAVI and post-TAVI AR (using Sellers’ angiographic grading). AR: aortic regurgitation; TAVI: transcatheter aortic valve implantation
The mean, median and IQR values for post-TAVI LVOT-AR for the overall study population were 0.14, 0.12 and 0.06-0.19, respectively. The median (IQR) of LVOT-AR for CoreValve® (Medtronic, Minneapolis, MN, USA) (n=155), SAPIEN XT (Edwards Lifesciences, Irvine, CA, USA) (n=69), and Inovare (Braile Biomédica, São José do Rio Preto, Brazil) (n=4) was 0.13 (0.07-0.22), 0.10 (0.05-0.14), and 0.05 (0.03-0.09) (CoreValve vs. SAPIEN XT, p=0.002), respectively.
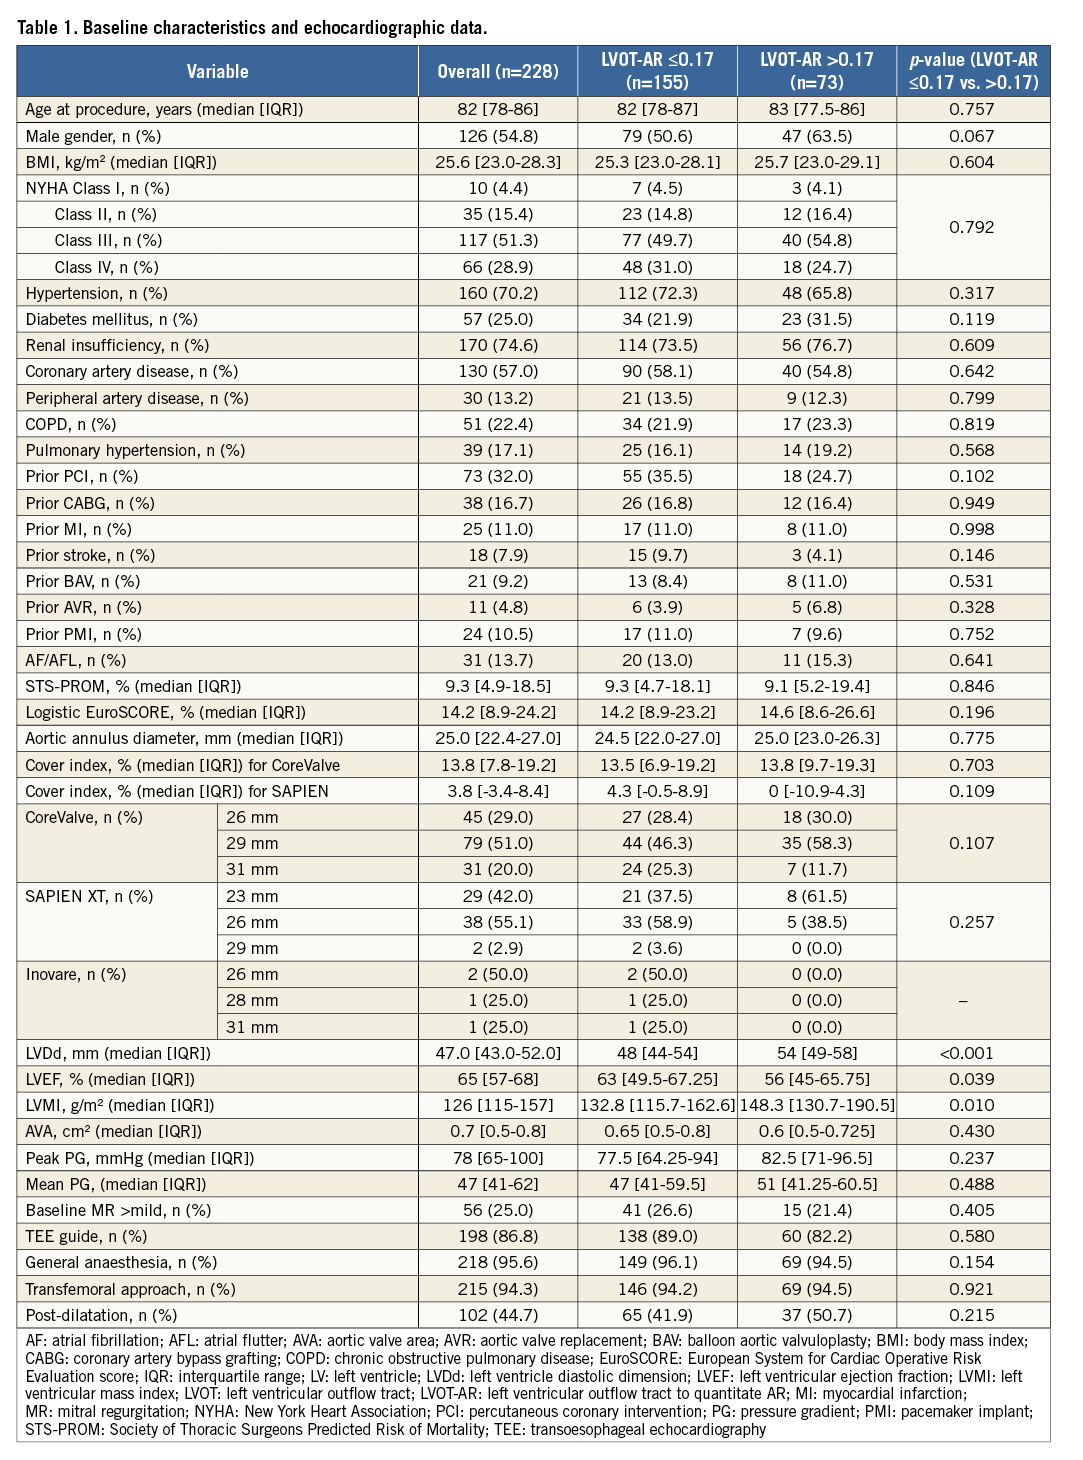
Using ROC curve analysis, the optimal LVOT-AR cut-off value for predicting all-cause mortality was LVOT-AR >0.17 (AUC=0.610). The study population was, accordingly, dichotomised into two groups (155 patients with LVOT-AR ≤0.17, and 73 patients with LVOT-AR >0.17). The baseline clinical and echocardiographic characteristics of both groups are shown in Table 1.
CLINICAL IMPACT OF DE NOVO AR AFTER TAVI AND THE ROLE OF PRE-EXISTING AR
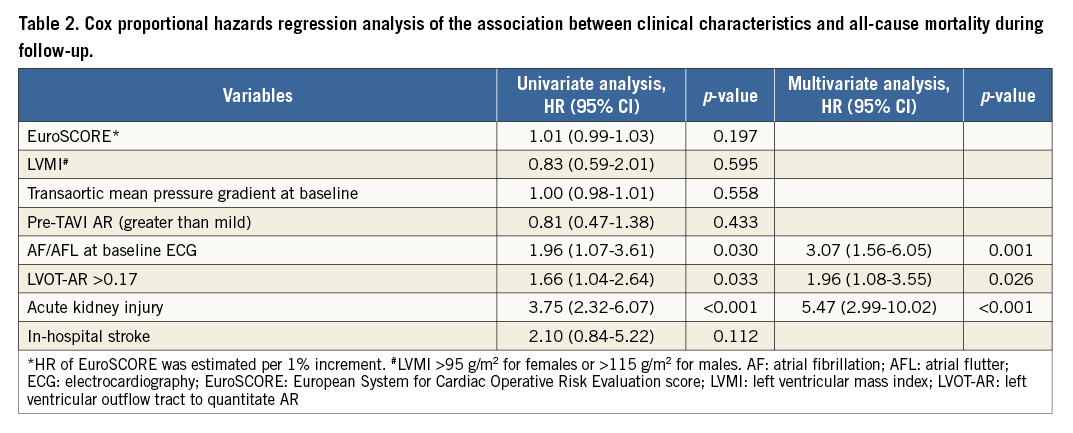
During the entire follow-up period (mean 521 days), 73 deaths occurred. Patients with LVOT-AR >0.17 had a significantly increased all-cause mortality at three years, compared to patients with LVOT-AR ≤0.17 (45.5% vs. 37.7%, adjusted hazard ratio [HR]: 1.73, 95% confidence interval [CI]: 1.05-2.86, p=0.032) (Figure 5). In multivariate analysis, LVOT-AR >0.17 independently predicted all-cause mortality during the follow-up period (HR: 1.72, 95% CI: 1.04-2.84, p=0.036) (Table 2).

Figure 5. Kaplan-Meier estimation and log-rank test of cumulative survival with the patients dichotomised into two groups based on LVOT-AR 0.17. *Adjusted HR accounted for: COPD, TEE-guided TAVI, periprocedural stroke, AKI, in accordance with a previous report22. AKI: acute kidney injury; AR: aortic regurgitation; COPD: chronic obstructive pulmonary disease; HR: hazard ratio; LVOT: left ventricular outflow tract; TAVI: transcatheter aortic valve implantation; TEE: transoesophageal echocardiography
For evaluation of the influence of pre-existing AR, patients with available pre- and post-TAVI angiograms (n=201) were divided into four groups: 97 patients with mild or less (Sellers ≤1) pre-TAVI AR and post-TAVI LVOT-AR ≤0.17; 34 patients with mild or less pre-TAVI AR and LVOT-AR >0.17; 40 patients with >mild pre-TAVI AR and LVOT-AR ≤0.17; and 30 patients with >mild pre-TAVI AR and LVOT-AR >0.17. In patients with mild or less pre-TAVI AR, LVOT-AR >0.17 was significantly associated with increased mortality as compared to LVOT-AR ≤0.17 (HR 3.53, 95% CI: 1.61-7.76, p<0.001) (Figure 6A). In contrast, when there was a significant pre-TAVI AR (≥moderate), LVOT-AR did not significantly affect mortality (HR 0.77, 95% CI: 0.31-1.91, p=0.578) (Figure 6B). Interestingly, among patients with significant AR after TAVI (LVOT-AR >0.17), the hazard of death at two years was significantly higher in patients with mild or less than in patients with significant pre-existing AR (HR 2.55, 95% CI: 1.16-5.58, p=0.029) (Figure 7).
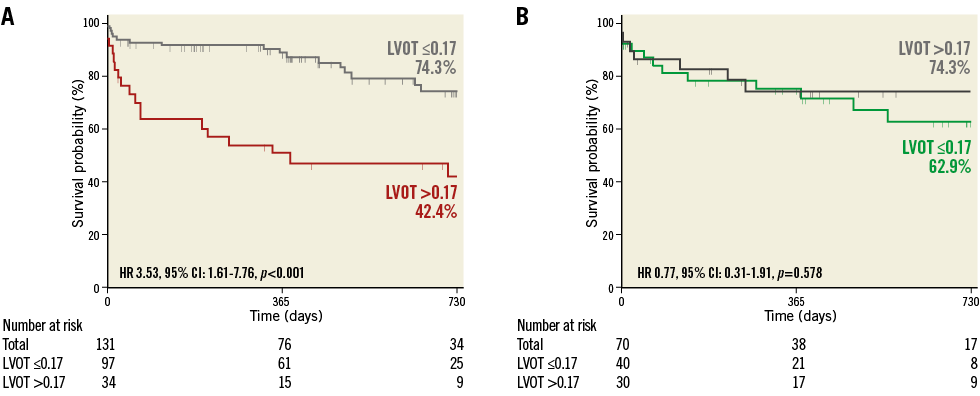
Figure 6. Kaplan-Meier estimation and log-rank test of cumulative survival with the patients divided into four groups based on the severity of pre-TAVI AR and post-TAVI LVOT-AR. A) Patients with mild or less pre-TAVI AR. B) Patients with moderate or severe pre-TAVI AR. AR: aortic regurgitation; CI: confidence interval; HR: hazard ratio; LVOT: left ventricular outflow tract
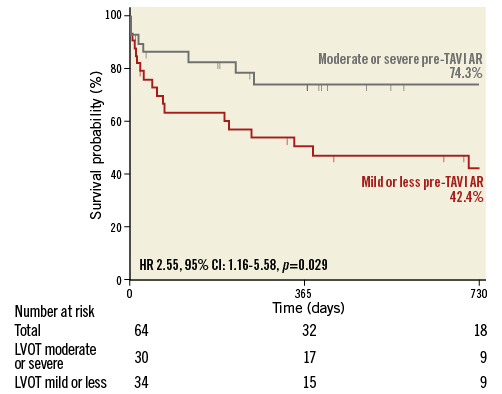
Figure 7. Kaplan-Meier estimation and log-rank test of cumulative survival in patients with LVOT-AR >0.17 dichotomised into two groups based on the severity of pre-TAVI AR. AR: aortic regurgitation; CI: confidence interval; HR: hazard ratio; LVOT: left ventricular outflow tract
Discussion
The main findings of the present study are that: 1) LVOT-AR >0.17 is an independent predictor of intermediate-term all-cause mortality after TAVI, especially when there is no significant pre-TAVI AR; and 2) the presence of significant pre-TAVI AR buffers the effect of post-TAVI AR on mortality.
LV hypertrophy develops in the setting of AS as a compensatory mechanism to reduce myocardial wall stress and maintain cardiac output. However, LV hypertrophy eventually leads to impaired relaxation, increased stiffness, myocardial fibrosis, and elevation of LV end-diastolic pressure15. The sudden conversion from pressure (AS) to volume (AR) overload is poorly accommodated by the hypertrophied LV, especially when there is no pre-TAVI AR (isolated AS)15. This pathophysiologic vulnerability explains the reported “malignant” outcome in patients developing AR after TAVI, even if the latter is mild5. Moreover, this phenomenon could account, at least partially, for the inconsistency of data on the clinical impact of mild AR after TAVI5,25.
In the present study, in accordance with a few previous reports16-18, we demonstrated that pre-TAVI AR could modify the clinical outcome in patients developing AR after TAVI.
When pre-TAVI AR is mild or less, post-TAVI AR could be detrimental (Figure 7, red line). On the other hand, a significant pre-TAVI AR preconditions the LV to accommodate volume overload (Figure 7, grey line).
In the present analysis, aortograms quantitated AR severity immediately after valve implantation. The latter has been reported to change (mostly improve) over time, especially when a CoreValve is used26. Although this phenomenon poses some concerns as to whether an immediate post-implantation AR quantitation is adequate for decision making, the present study shows that routine angiographic surveillance of AR in the cathlab can still be used for prognostication, especially when pre-existing AR severity is taken into account. Although the area under the ROC curve defining a post-TAVI LVOT-AR >0.17 as a cut-point portending a worse outcome is small (0.61), this is well explained by the interaction with pre-existing AR severity.
In line with some recent reports27, we identified atrial fibrillation (AF)/atrial flutter (AFL) (at baseline) as an independent predictor of intermediate-term mortality. AF/AFL is linked to embolic complications and to worsening of heart failure (due to decreased ventricular filling secondary to shortened diastole and loss of atrial contraction and of atrioventricular synchrony). All these conditions contribute to all-cause mortality.
Study limitations
Our study is based on a retrospective data analysis of a relatively small number of patients selected on the basis of the feasibility of the VD assessment. The limitations of this study are those inherent to retrospective studies. The methods of AR assessment before and after device implantation were different (visual vs. VD).
Operators tend to use the angiographic projection with the three aortic cusps aligned in one plane to guide the TAVI procedure. In this projection, however, the contrast-filled descending aorta frequently overlaps the ROI. It is therefore believed that setting a dedicated acquisition protocol could significantly improve the feasibility of the proposed tool (LVOT-AR).
Conclusions
AR after TAVI could be quantitated with LVOT-AR. The cut-point of >0.17 indicates a significant AR pertaining to increased intermediate-term all-cause mortality, especially in those with no significant pre-existing AR.
| Impact on daily practice In the setting of the “minimalist approach” – increasingly adopted by TAVI centres28 – intraprocedural identification and quantification of AR relies mainly on angiography. Consequently, the method used in the present analysis may be utilised for guiding corrective measures against AR. |
Guest Editor
This paper was guest edited by Alec Vahanian, MD; Cardiology Department, Hôpital Bichat-Claude Bernard, Paris, France.
Acknowledgements
We appreciate the effort of Teresa Cristina Nascimento for collection and summarising of clinical data for this registry.
Conflict of interest statement
F. de Brito Jr is a proctor for Edwards Lifesciences and Medtronic. P. Lemos and R. Leite are proctors for Medtronic. T. Slots is an employee of Pie Medical Imaging. The other authors have no conflicts of interest to declare. The Guest Editor has no conflicts of interest to declare.