Introduction
Transcatheter aortic valve implantation (TAVI) is undeniably invading the “surgical” space and expanding its indication. Over the last five years, there has been a real revolution in TAVI technology with the introduction of newer devices that aimed to simplify the procedure1. These swift advances have transformed the landscape in structural heart disease and culminated in a broader use of TAVI in clinical practice2,3. The procedure is not only spreading worldwide but is also becoming less aggressive for the patient with the so-called “minimalist approach”.
With the rise and consolidation of this minimally invasive era of TAVI procedures, precluding general anaesthesia, the use of transoesophageal (TEE) or transthoracic echocardiogram (TTE) during the procedure becomes restricted. However, a thorough assessment for (paravalvular) aortic regurgitation (AR) is important immediately post TAVI, since more than mild AR affects short- and long-term clinical outcomes4,5,6 and can be corrected during the procedure (e.g., with a valve-in-valve implant, balloon post-dilatation or even snaring) or even in the chronic stage (percutaneous closure of paravalvular leak)7. Thus, aortography (re-)emerges as a valuable tool for periprocedural AR assessment, as a surrogate technique of AR assessment, whenever transthoracic echocardiography is not available or doable in the interventional suite.
The low reproducibility of Sellers criteria8, a subjective method to quantify AR, begets the need for an objective and precise quantification of AR such as that provided by videodensitometry (VD). This objective method relies on aortography and can accurately quantify the transvalvular or paravalvular AR9,10,11.
The quantitative AR assessment using the aortogram with VD was tested in vitro, in animal models and validated in clinical trial and real-world populations, evaluated in comparison either with echocardiography or with magnetic resonance imaging9,10,11,12,13,14,15.
In this “insight” review we describe the evolution of this novel technique towards its complete validation in the clinical setting for TAVI, as well as the present and future application of the method in clinical trials and in the assessment of regurgitation in other valve procedures, such as mitral and tricuspid.
HISTORY OF VIDEODENSITOMETRY
The use of the so-called Roentgen VD was introduced in the 1960s by Earl H. Wood16 from New York, USA, and Paul H. Heintzen17 from Germany. The simple method for the recording of radiopaque dilution curves during angiocardiography consisted of the amalgamation of the consolidated techniques of angiocardiography and the dye-dilution method. The use of radiopaque angiographic contrast medium as the “indicator” and the continuous recording of the changes in the X-ray density of different heart chambers (or vessels) – provoked by the passage of the contrast media – could produce a refined quantitative evaluation of the images, e.g., regurgitation.
In the 1970s, with the use of cineangiography, Dr G. von Bernuth together with Dr E.H. Wood undertook an experimental procedure to test VD for the assessment of AR18. In four closed chest dogs (with provoked aortic insufficiency by valvotomy), the investigators injected radiopaque material into the aorta, recording the angiograms on magnetic tapes – producing time-density curves (videodensograms). The so-called AR index was calculated as the ratio of the area under the time-density curves of the aortic root and left ventricle (LV) videodensograms. The results were then compared with the consolidated upstream-sampling dye-dilution technique, and with data from a simultaneous assessment with an electromagnetic aortic flow transducer, previously implanted in the dogs. After a series of assessments with different heart rates, the investigators found that videodensitometric assessment of regurgitation greatly correlated with the assessment of the electromagnetic flow meter (r=0.95) and with the upstream-sampling dye-dilution technique (r=0.92). The authors concluded that “VD is a sensitive method for detection and estimation of the severity of AR presumably applicable in the clinical setting”.
It was more than a decade later that the technique was applied with a computer-based analysis of the time-density curves in humans. In 1986, Klein et al tested the concept of videodensitometric assessment of AR in humans using digital subtraction aortography19. The authors performed aortograms in 17 patients with varying degrees of AR and in four control patients. After acquisition of the images, the computer generated a display, with time as a function of cardiac cycles from the start of the contrast injection on the x-axis and the summation of density within the two regions of interest (aortic root and LV) on the y-axis (Figure 1). Then the computer generated a separate curve corresponding to the ratio of the two previous density curves from the LV and aortic root; the ratio at the end of the injection was then the result of the videodensitometric assessment in this particular study (Figure 2). The authors were able to show the discrimination of quantitative videodensitometric regurgitation among the different categorical classes of regurgitation by blinded visual assessment of the cineangiographies, suggesting its potential clinical use. Since this correlation was made with (although blinded) subjective visual assessment, one year later Grayburn et al compared the quantitative assessment of regurgitation in the angiography with the objective assessment of electromagnetic flow (EMF)20. For that, the authors used six dogs instrumented with an EMF probe in the ascending aorta and produced varying degrees of regurgitation by a basket catheter. Applying the same methodology of time-density curves (Figure 3), the authors showed an excellent correlation between VD and EMF (r=0.94) (Figure 4). Based on that, the authors concluded that AR fraction could be accurately quantified by analysis of time-intensity curves generated from the aorta and LV after digital subtraction angiography (DSA).
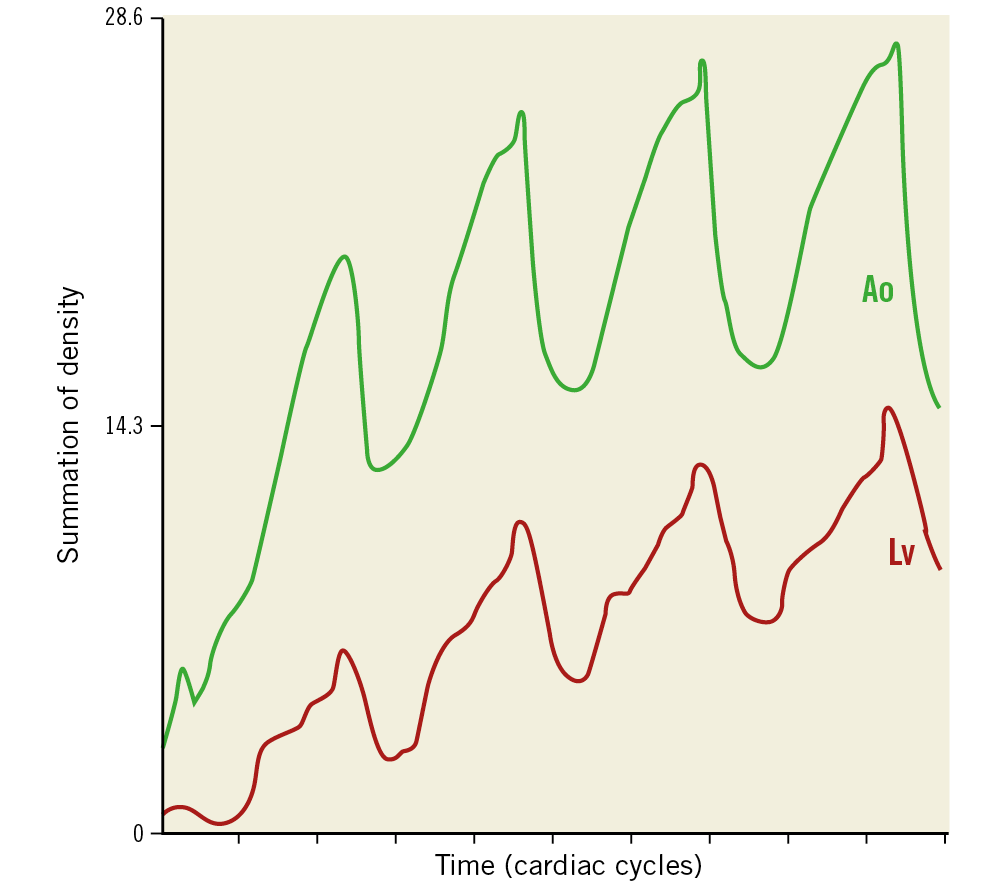
Figure 1. Computer-generated time-density curves of the aortic root (green line) and the left ventricle (red line) after injection of contrast in a patient with aortic regurgitation in whom digital subtraction aortography was performed. Reproduced with permission from Klein et al19.
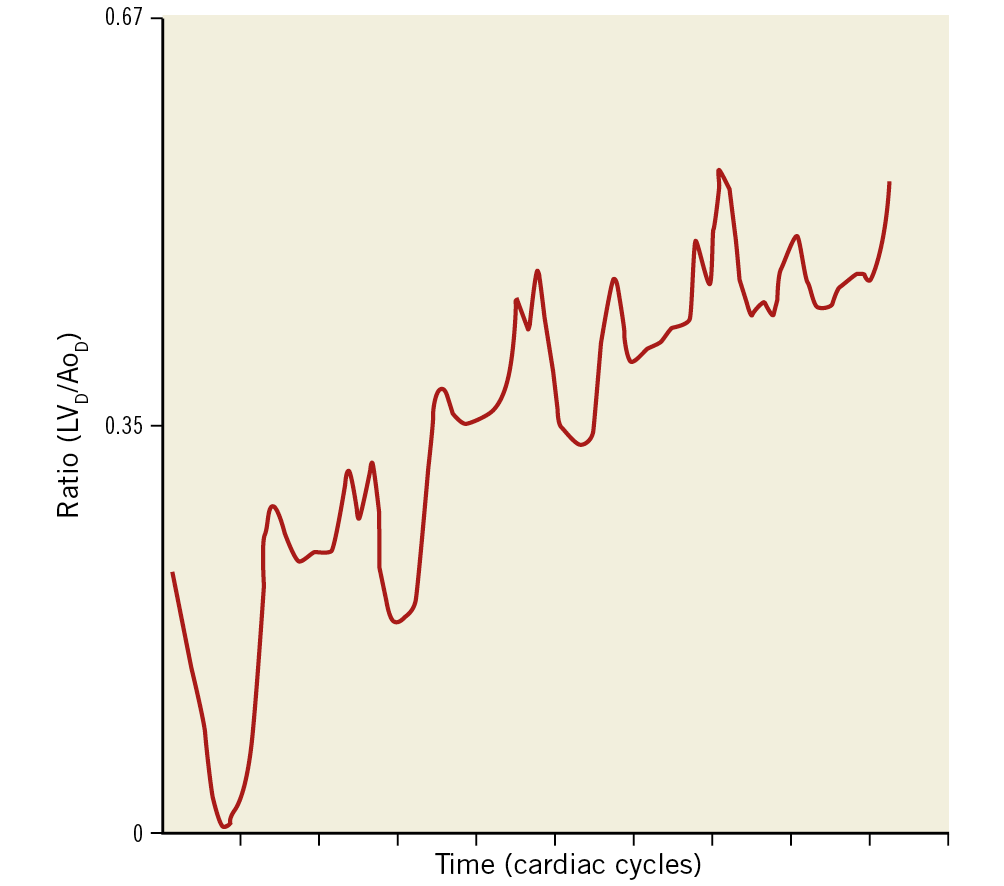
Figure 2. Ratio at the end of injection (LVD/AoD). The plateau at the end of the injection, defined as the time of the final peak of the aortic density curve is analysed. Reproduced with permission from Klein et al19.
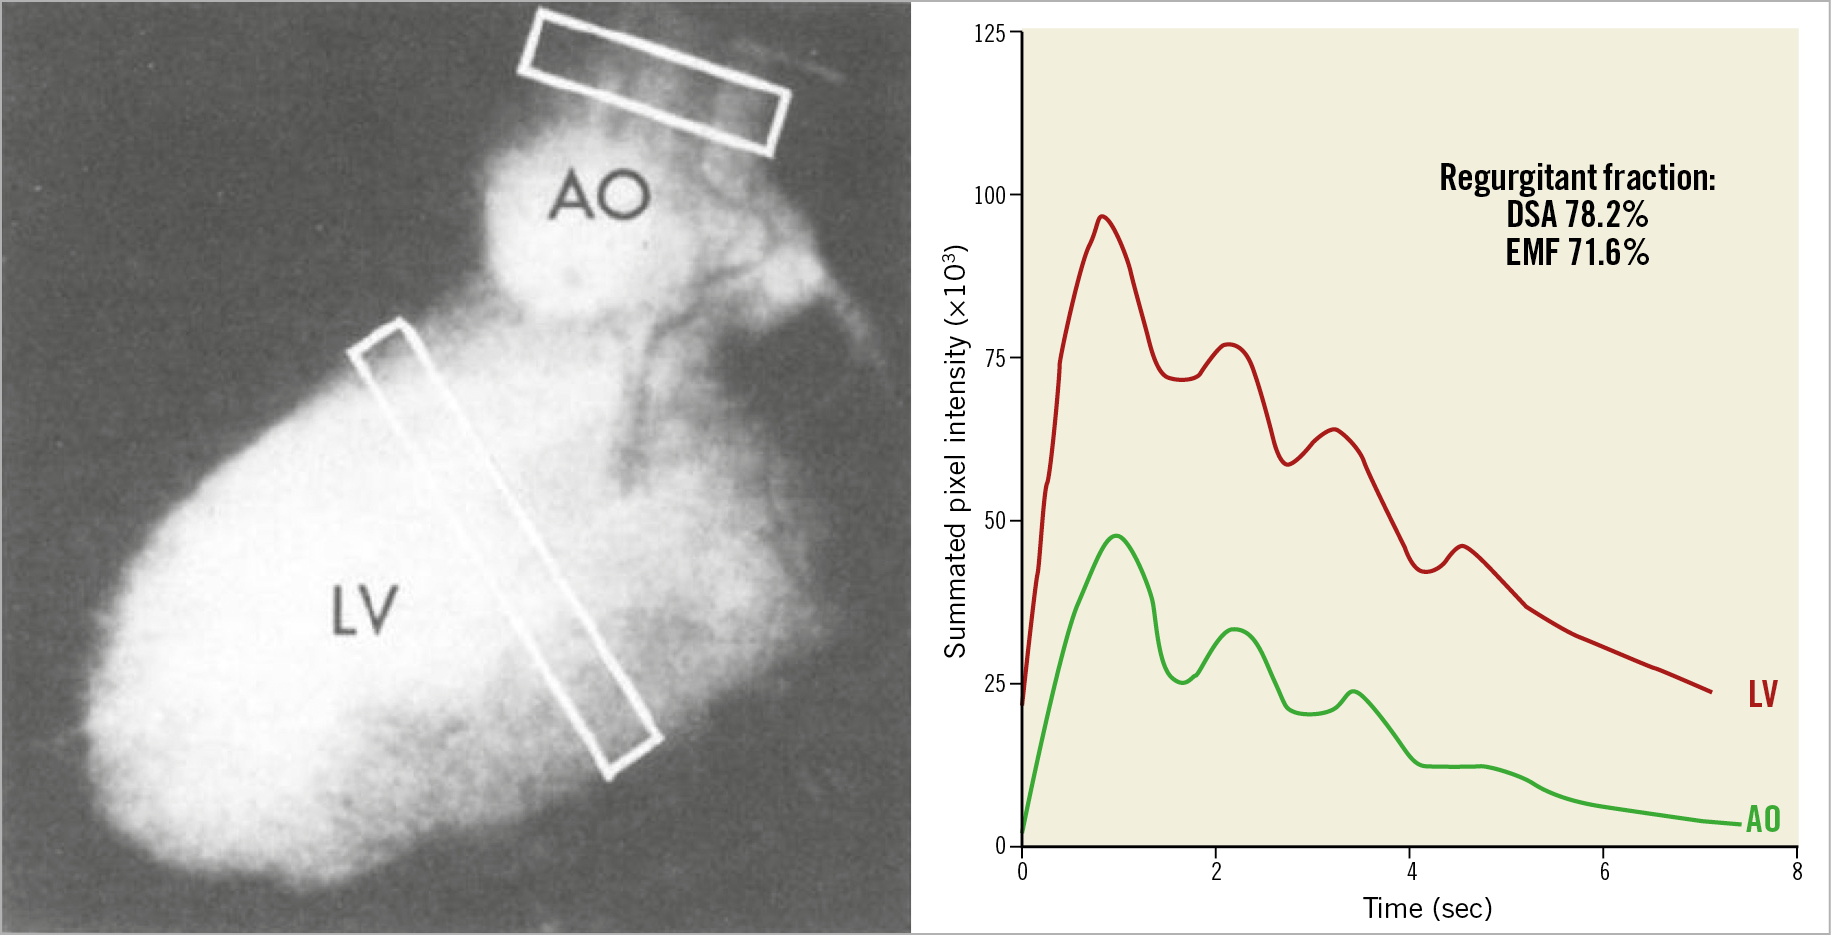
Figure 3. Calculation of regurgitant fraction with the use of videodensitometry (time-intensity curves). The left panel shows the processed, subtracted digital image of the aortogram in a severe regurgitation in dogs. Note the two white rectangles representing the areas of interest for creating the time-intensity curves. On the right panel, the curves generated for both areas of interest, aortic (green line) and left ventricle (red line). Reproduced with permission from Grayburn et al20.
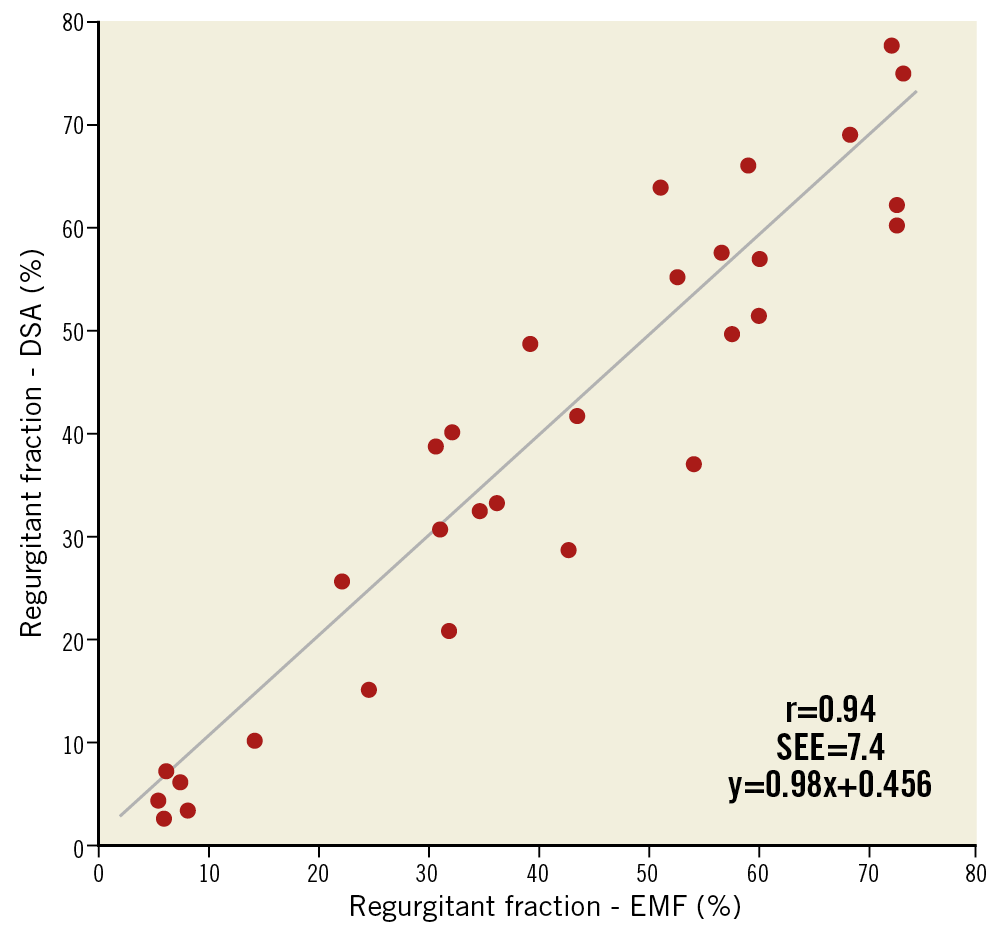
Figure 4. Scatter plot with regression line showing the relation between regurgitant fraction calculated with digital subtraction aortography (DSA) and electromagnetic flow (EMF). Reproduced with permission from Grayburn et al20.
RISE OF ECHOCARDIOGRAPHY AND DETHRONEMENT OF AORTOGRAPHY FOR REGURGITATION ASSESSMENT
In the 1980s growing adoption of echocardiography and the introduction of new parameters for non-invasive assessment of heart valve diseases challenged the role of invasive angiography for the diagnosis of and decision-making process in valvular heart disease. In a single-centre experience of 305 patients who were operated in a year for either mitral or aortic valve disease, 184 did not undergo catheterisation before surgery; there was no difference in surgical mortality, two-year follow-up mortality or in the two-year presence of symptoms21. Since the patients underwent non-invasive methods of assessment of disease severity and surgical planning, these results pointed out the lack of need for catheterisation prior to a valve replacement procedure21. Later, with Doppler echocardiography, similar findings were observed in different studies, confirming the non-requirement of catheterisation for valve surgeries22,23.
ECHOCARDIOGRAPHIC ASSESSMENT OF REGURGITATION POST TAVI
Nowadays, TAVI has spread substantially worldwide and new designs aiming to simplify the procedure, reduce complications and improve procedural outcomes have been introduced. One of the main issues with the aortic prosthesis for TAVI is AR, mainly represented by paravalvular regurgitation (PVR) – which leads to a constant focus on the engineering of new devices.
AR (central or paravalvular) is a common condition after prosthetic valve implantation and can affect up to 70% of patients24. Regurgitation can be due to multiple factors related to the device, the patient or even to the operator. Among the most likely causes are the prosthesis type, degree of native valve calcification, implantation depth, annulus size (limited sizes of prostheses) and the method of sizing the annulus (either with TTE or TEE or with a multislice computed tomography [MSCT] scan)25,26,27.
Not only is AR common following TAVI, but the severity of AR relates closely to clinical outcomes24. An appropriate and accurate assessment of regurgitation becomes essential during the procedure.
AR assessment after the implantation of a bioprosthesis is more demanding and difficult than for a native valve evaluation28 and remains the Achilles’ heel of TAVI29. There are several reasons why the quantification of regurgitation is a challenge with echocardiography: (i) patient-specific aortic annular and/or leaflet geometry, especially in calcified and degenerated cusps; (ii) calcification that contributes to incomplete apposition of the device to the annulus, (iii) ultrasound backscattering of the metallic struts of the device that may attenuate the ultrasound signal; (iv) paravalvular regurgitant jets may be single or multiple, and are often crescent and eccentric, following serpiginous trajectories, with an axis of flow that may not be well assessed through standard Doppler imaging windows, and (v) the lack of a standardised reference to define PVR severity consistently, which is still a major issue29,30. Thus, conventional methods applied to quantify regurgitation in the native valve such as pressure half-time, vena contracta location and jet width may not be reliable for post-TAVI assessment.
In addition, the assessment is greatly influenced by the imaging plane and also the location of the regurgitant jet (Figure 5). As shown in the Figure, jets in certain locations are not assessable in certain acoustic windows of the echocardiogram31. Another important aspect of the echocardiographic assessment of regurgitation after TAVI is its low reproducibility. It has been demonstrated that, even between core laboratories, the agreement on AR assessment was weak. Hahn et al32 performed an analysis comparing the agreement in AR assessment between a consortium composed of three echocardiographic core laboratory directors and the Placement of Aortic Transcatheter Valves (PARTNER) IIB trial core laboratory. The authors documented that both for the four-class grading of PVR (kappa=0.48) and for the seven-class grading (kappa=0.52) the agreement was considered weak33 (Figure 6).
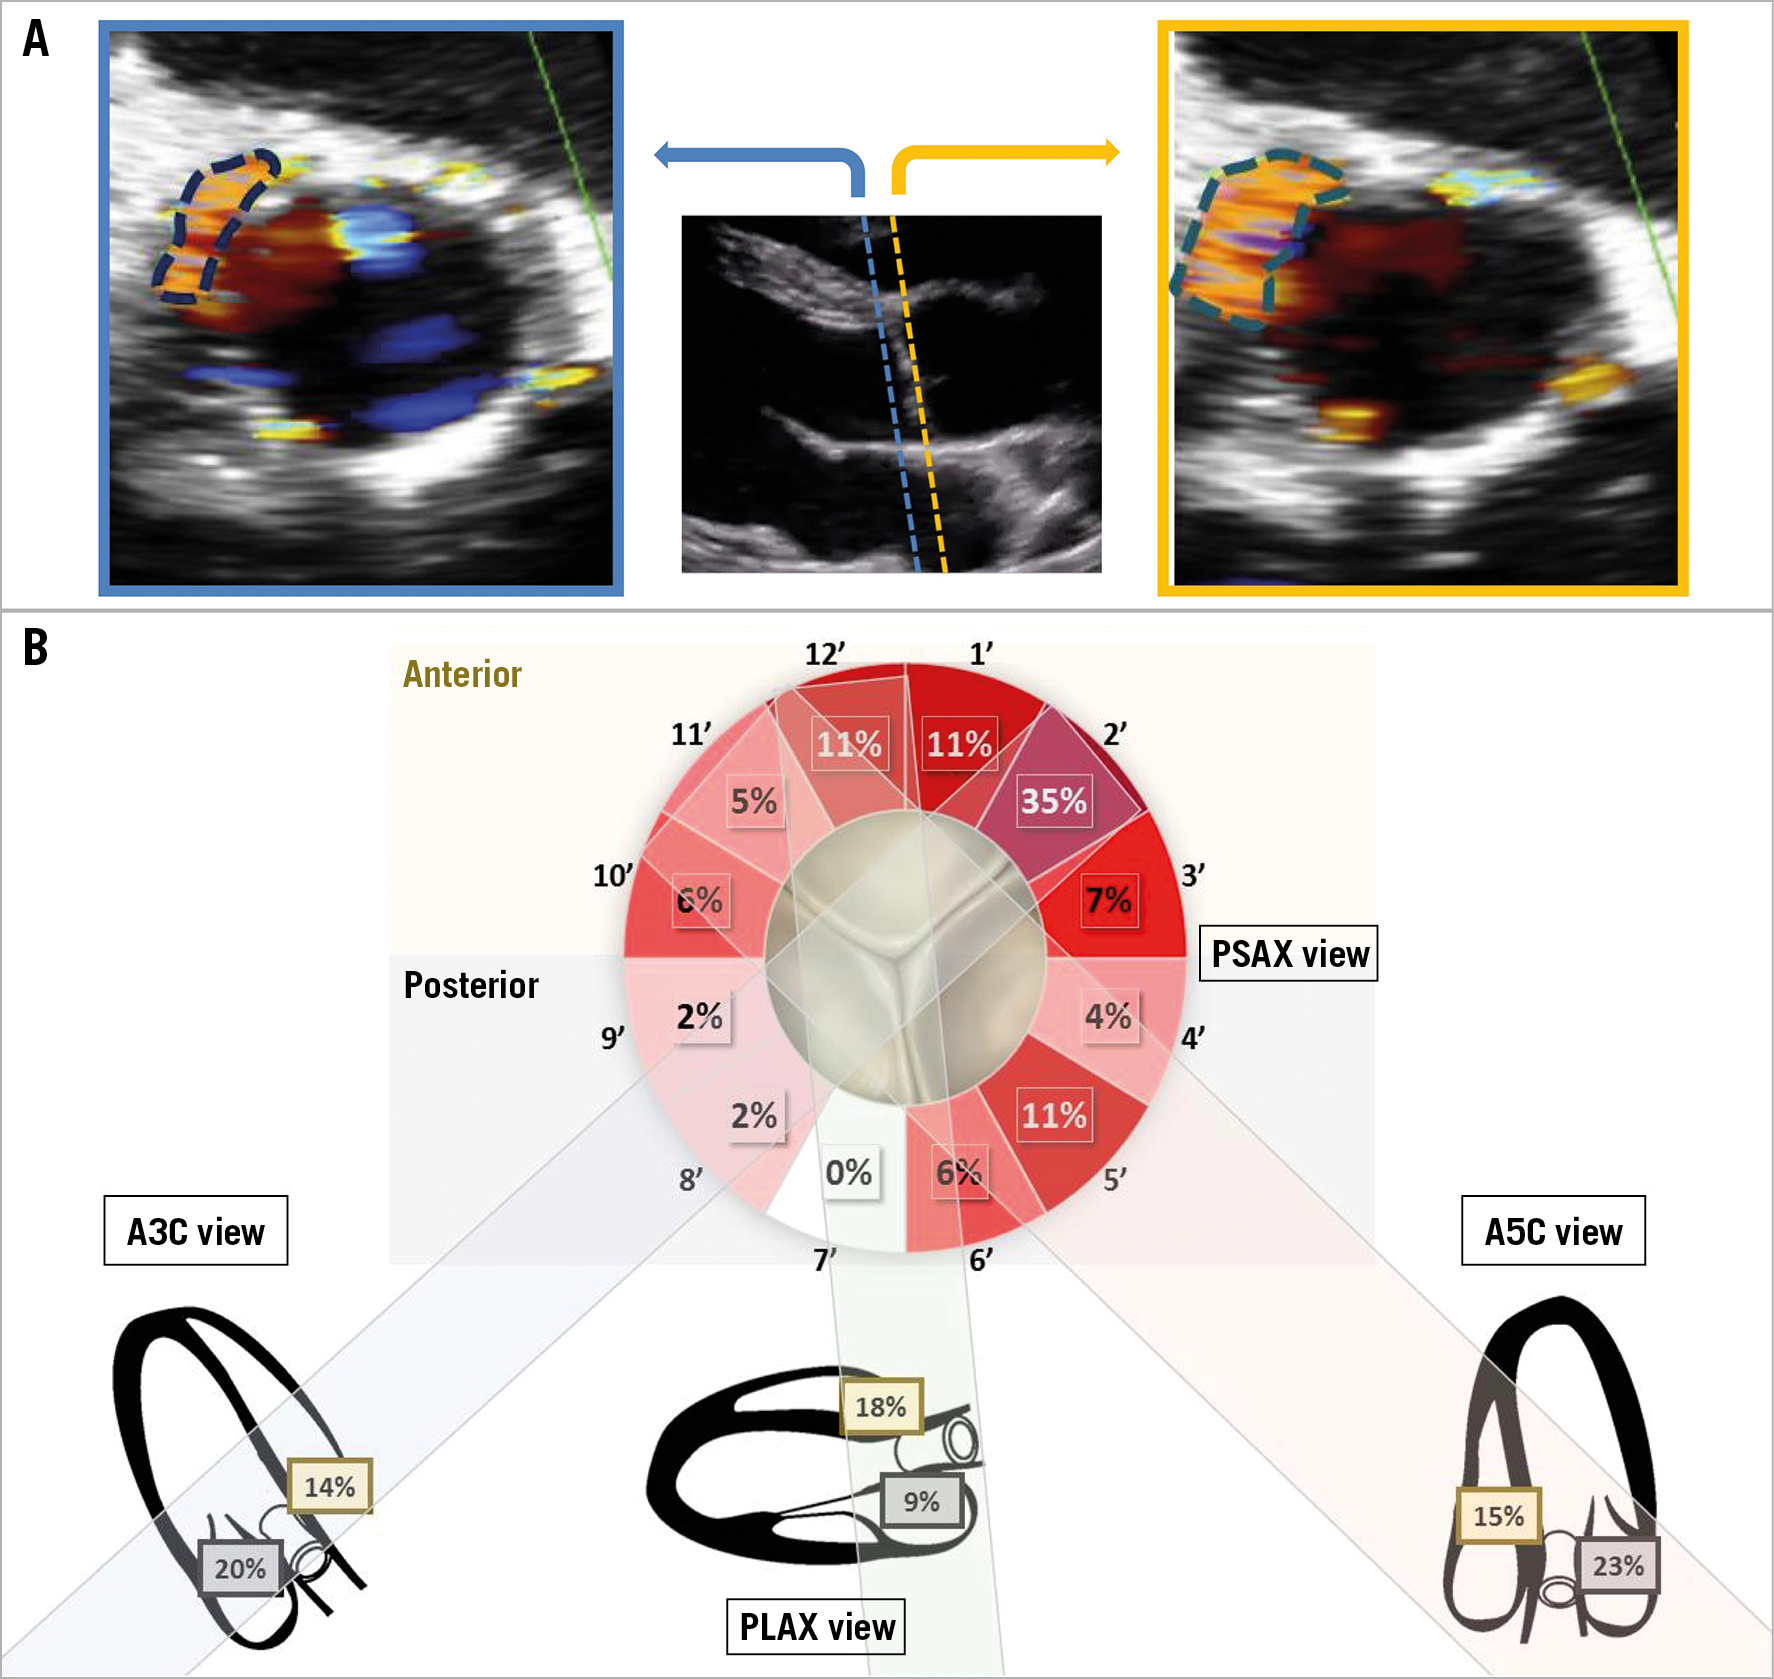
Figure 5. Determinants of misinterpretation of paravalvular regurgitant jets by echocardiogram. A) A schematic representation of how the imaging plane can influence the interpretation of the amount of regurgitation assessed by circumferential extent. B) An example of the location of paravalvular AR jets determined by colour Doppler in parasternal short-axis view and long-axis views. Jets originating at the non-coronary sinus region (posterior location in apical 3-chamber view) are under-represented in parasternal short-axis view. While 20% of jets seen in long-axis views are present in that region, only 4% of those depicted on parasternal short-axis view are located in the corresponding sector. A3C: apical 3-chamber; A5C: apical 5-chamber; LAX: long axis; PLAX: parasternal long axis; PSAX: parasternal short axis. Reproduced and modified with permission from Abdelghani et al31.
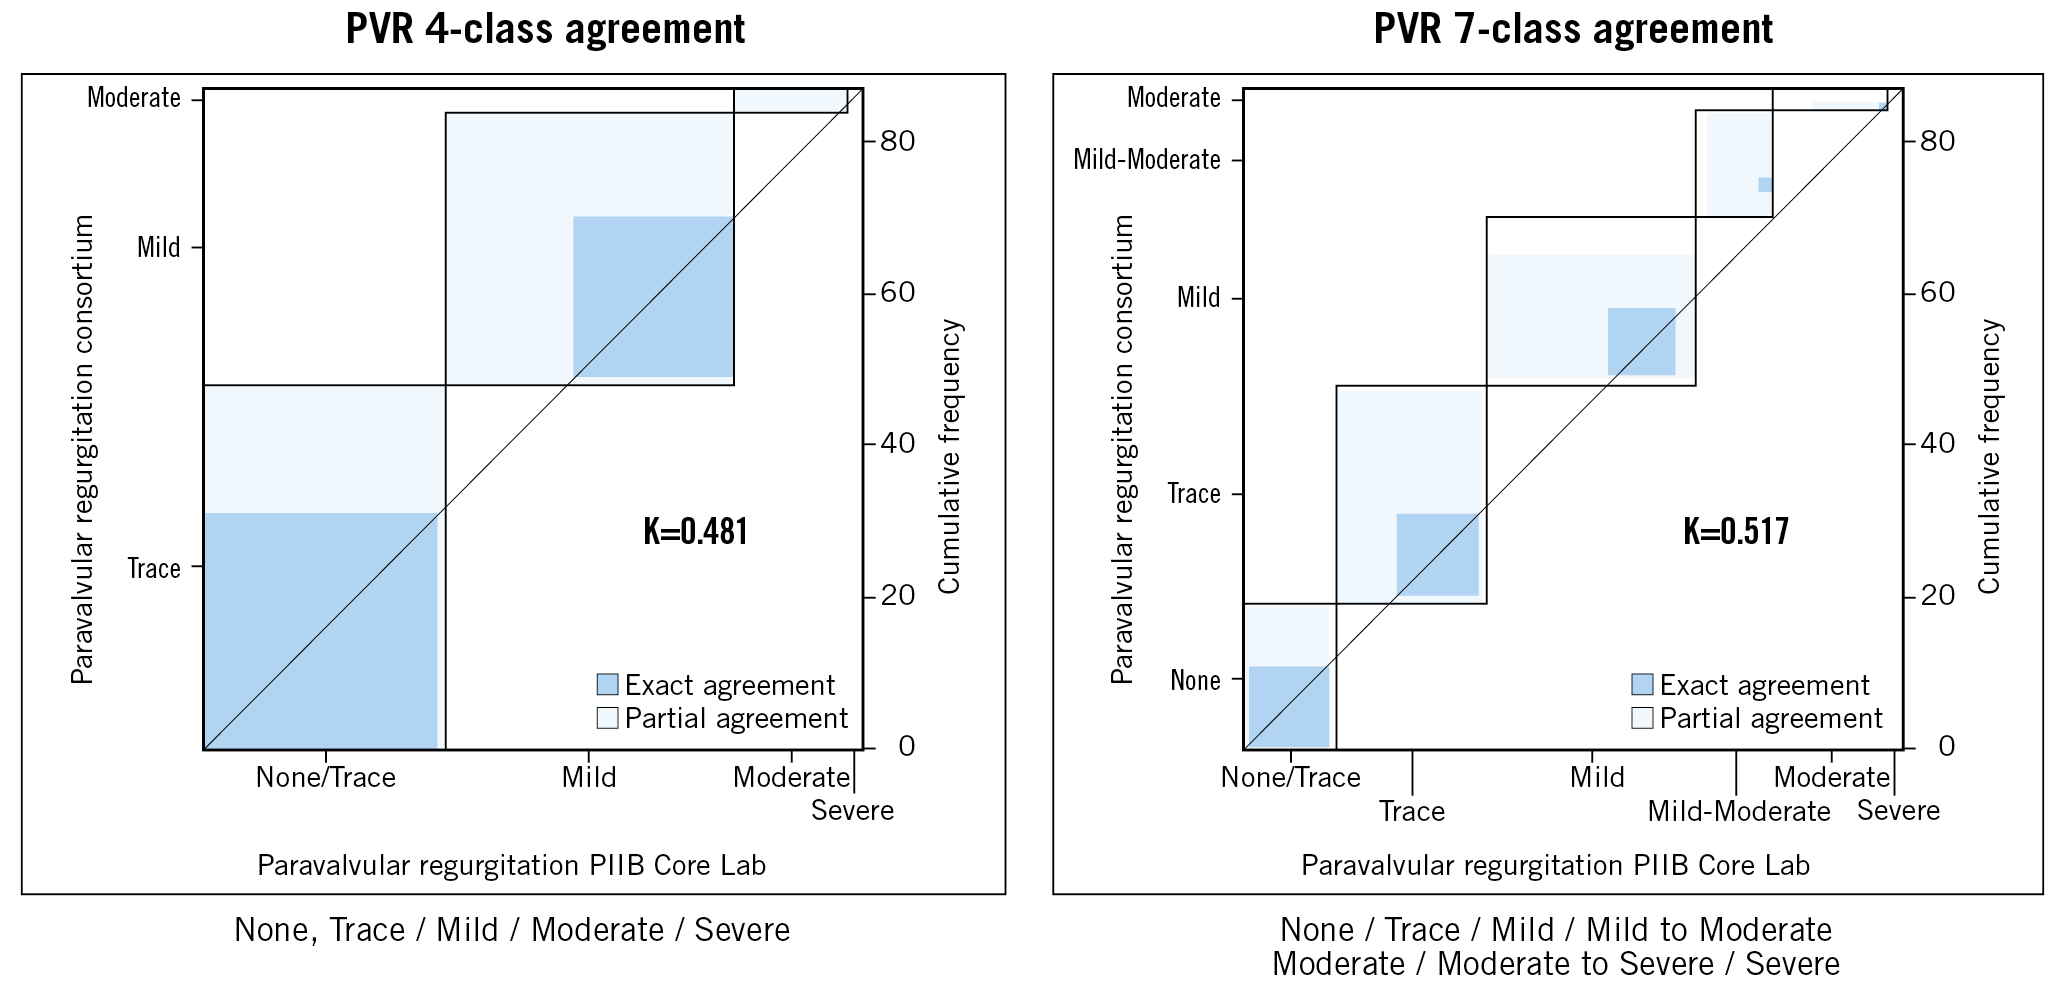
Figure 6. Agreement between the Placement of Aortic Transcatheter Valves (PARTNER) IIB (PIIB) core laboratory and the consortium using Kappa statistics in the grading of aortic regurgitation. Left panel shows the agreement using the four-grade scheme and the right panel shows the agreement using the seven-grade scheme. Reproduced with permission from Hahn et al32. PVR: paravalvular regurgitation
Lately, in their consensus document, the Valve Academic Research Consortium-2 (VARC-2) proposed some approaches for assessing PVR post TAVI. However, these methods have yet to be validated and may be insufficient to overcome all of the specific limitations imposed on echocardiography in TAVI patients34.
THE MINIMALIST TAVI ERA AND THE UNMET NEED FOR AR ASSESSMENT
In the early days, following Cribier’s first-in-man report of a TAVI in 200235, the procedure was performed worldwide mainly in inoperable patients, usually under general anaesthesia with the guidance of a TEE36.
Currently, percutaneous transfemoral TAVI is the preferred treatment strategy for symptomatic aortic stenosis patients, even those at low surgical risk2,3. With the improvement in devices, growth of clinical experience and broader indications of TAVI, the procedure had to be greatly simplified37, and so-called minimalist TAVI became mainstream. This simplified approach for TAVI has been shown to be safe and effective and is already the routine in many centres38,39,40.
Minimalist TAVI comprises a series of simplifications pre-procedure, intra-procedure and at follow-up. For a TAVI to be considered minimalist, the most important changes during the procedure are the maximum use of the transfemoral approach, local anaesthesia (with or without patient sedation), the minimum restricted insertion of catheters and lines, and a truly percutaneous approach (meaning the use of vascular closure devices and percutaneous bail-out management in case these devices fail)37.
The use of local anaesthesia has some advantages, compared to general anaesthesia: (i) the patient tends to maintain haemodynamic stability during the entire procedure, thus with less need for inotropic agent; (ii) the operators are able to assess the neurological status of the patients continuously as well as assess pain easily – which is a valuable marker for vascular complications; and (iii) it reduces the length of hospital stay which, combined with the other advantages, makes local anaesthesia a cost-effective alternative to TAVI with general anaesthesia37,41.
With the preclusion of general anaesthesia, TEE use in the procedure becomes limited, leaving assessment of PVL to a later stage – to post-procedure TTE. However, the use of a TTE-guided TAVI has shown major detection of intraprocedural PVL-related events, defined as a combination of mild PVL, need for intraprocedural post-dilation and for second valve insertion42. Therefore, the use of a simplified and intraprocedural assessment (angiographic) of post-implantation PVL is generally adopted in the minimalist approach37.
Haemodynamic status has been studied recently as an adjunctive assessment after TAVI as a surrogate for regurgitation. Namely, there is the aortic regurgitation index43 and the diastolic pressure-time index44. These two methods take into account the pressures measured in the aorta and LV after the procedure. Although not thoroughly validated and mainly presented as dichotomous information, they may be integrated with multimodality imaging for the decision-making process during the procedure.
CONTRAST ANGIOGRAPHY – FROM VISUAL TO OBJECTIVE EVALUATION OF REGURGITATION
Sellers et al proposed the semi-quantitative method of AR grading in 19648. Originally, this visual assessment method graded the severity of aortic insufficiency in “+”, ranging from 1+ to 4+. More recently, Frick et al adapted that assessment for a post-TAVI scenario45. The details of the visual peculiarities of each stratum of regurgitation are shown in Table 1.

However, its somewhat subjective nature imposes bias on this assessment, mainly related to the reproducibility of the technique. An analysis involving four experienced interventional cardiologists blinded to any other type of AR assessment showed a poor agreement of assessment. The kappa coefficients from their assessment results ranged mostly from 0.47 to 0.60, which are considered weak agreements33. A quantitative objective way to assess regurgitation precluding this reproducibility drawback was mandatory. Hence, we saw the revival of the aortographic assessment of regurgitation using VD.
CONTEMPORARY QUANTIFICATION OF AR FROM AN AORTOGRAM – THE REBIRTH OF THE PHOENIX FROM ITS ASHES
With the adoption of valve regurgitation assessment by an echocardiogram, the aortogram was pushed aside as a historical method of assessment. However, with the increase in TAVI procedures, and even more with the rise of the minimalist TAVI approach, the use of an aortogram to assess PVL became pervasive again. Quantification of aortic insufficiency using VD has evolved from the early days (with improvements) to what we use nowadays - the contemporary quantitative aortogram. Chronologically, the assessment of post-TAVI PVL in the entire LV by VD preceded the assessment restricted to the left ventricle outflow tract (LVOT) approach11,46.
FROM THE LEFT VENTRICLE TO THE OUTFLOW TRACT
LV VD was the first to be used in the contemporary analyses of AR aortography. The entire LV represents the region of interest for the analyses46. From the aortogram images, the regions to be analysed are drawn including the contrast-filled aortic root and the entire LV. The software (CAAS A-Valve; Pie Medical Imaging, Maastricht, the Netherlands) then stabilises the image by subtracting the permanently radiopaque images (static background) before producing five time-density curves derived from the reference area (aortic root), and from the left ventricular base, mid and apex and overall (Figure 7). A great number of mathematical calculations with all data derived from the time-density curves were performed in that pilot study. Of note in the evolution of the technology, the investigators used the ratio between the areas under the curves (RAUC) and the quantitative regurgitation analysis (qRA) index. The qRA index was calculated from the first three cardiac phases after the arrival of contrast in the aortic root by weighting the RAUC with increasing apical depth and longer duration of contrast within the LV (analogous to Sellers’ grading method).
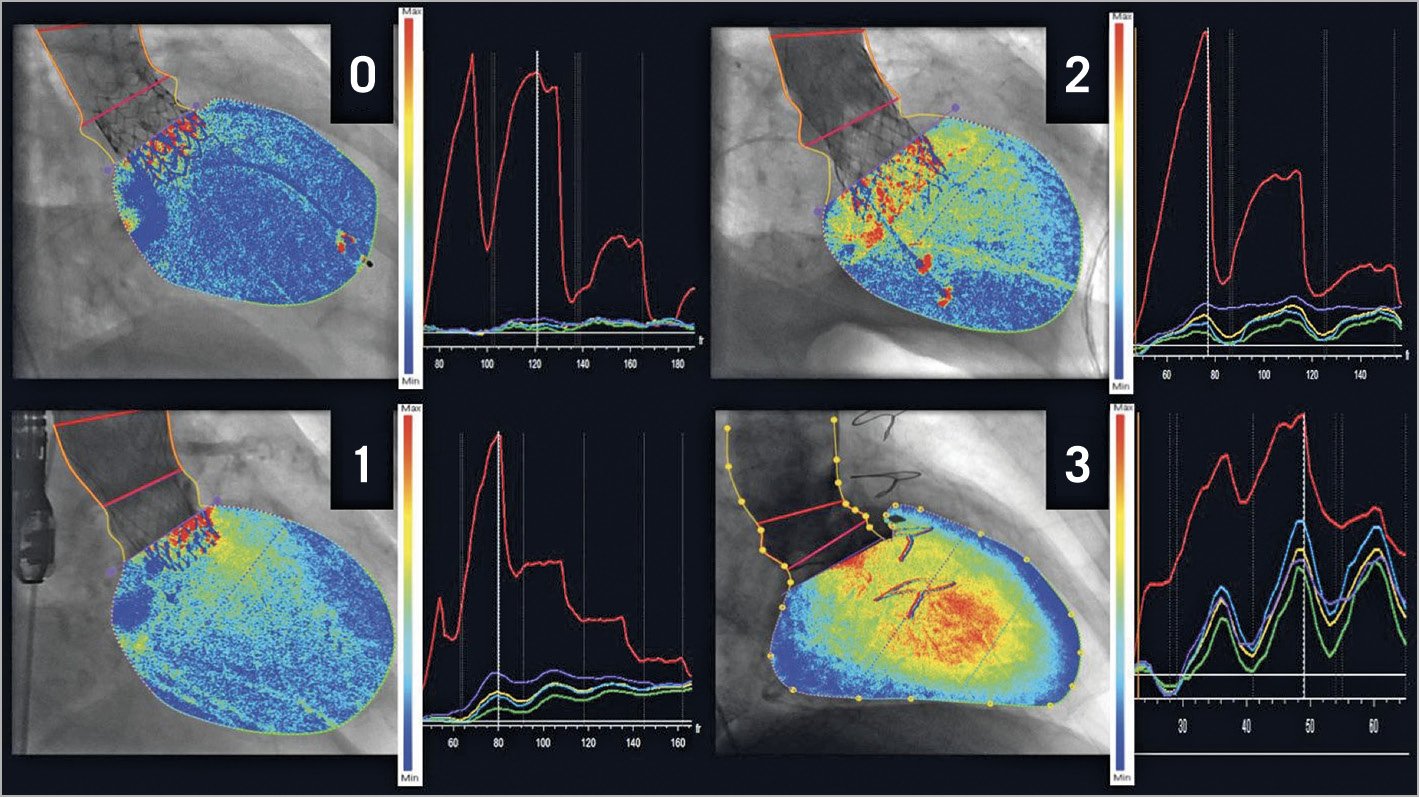
Figure 7. Different degrees of aortic regurgitation assessed by LV videodensitometry (qRA). The region of interest is drawn to include the contrast-filled aortic root and the entire left ventricle (left panel, dotted yellow lines). The base of the aortic root is indicated (left panel, purple line). The panels on the right show the five time-density curves generated by the qRA software, i.e., for the aortic root reference area (red), and for the left ventricle (LV) base (purple), mid-section (light blue), apex (green) and overall (yellow). Cumulative LV contrast density maps overlaid on the aortograms give a visual impression of the quantified severity of aortic regurgitation ranging from absent (0) to moderate to severe (3) in the examples shown. Reproduced with permission from Schultz et al46.
The authors showed a good correlation of the results of both the qRA index (r=0.83, p<0.001) and RAUC (r=0.81, p<0.001) with the Sellers’ grade of AR assessed by four independent and blinded observers. The most important findings of the study, however, were the reproducibility assessment of both methods, Sellers’ and VD. The agreement on the analyses of the Sellers’ grade was weak33, with kappa statistics ranging from 0.47 to 0.72 (Table 2). In contrast to that, the correlation between two observers for both qRA index assessment and RAUC was excellent (both r=0.98, p<0.001), showing the great reproducibility of the technique.

Although the technique has been shown to be highly reproducible and correlated with visual assessment of regurgitation, the weakness of the method was the feasibility of analysis – 69% of the aortograms in this particular study46. The basis of VD is to assess changes in density in two particular regions (i.e., LV and aortic root) induced by opacification from the injected angiographic contrast medium. Thus, the overlapping of those regions with another region to be contrasted (e.g., the descending aorta) would compromise the isolated assessment of the density in the regions of interest, thus compromising the accurate assessment of regurgitation. This initial study by Schultz et al had acquisition guidelines to avoid the overlap. However, specifying an overlap-free projection was not simple because of variability in patient anatomy, hence the low feasibility of analysis. In order to overcome this overlapping issue, a new study using only the LVOT as the region of interest was planned, examining the feasibility and reproducibility of this approach, called LVOT-AR11.
Using retrospective data from the Brazilian TAVI Registry47, Tateishi et al assessed 182 angiographies with both qRA and LVOT-AR. Briefly, the LVOT-AR technique uses the same concept as the RAUC of the entire LV VD, but confined to the third basal part of the LV – the outflow tract11. The anatomical advantages of using LVOT-AR instead of qRA are shown in Figure 8.
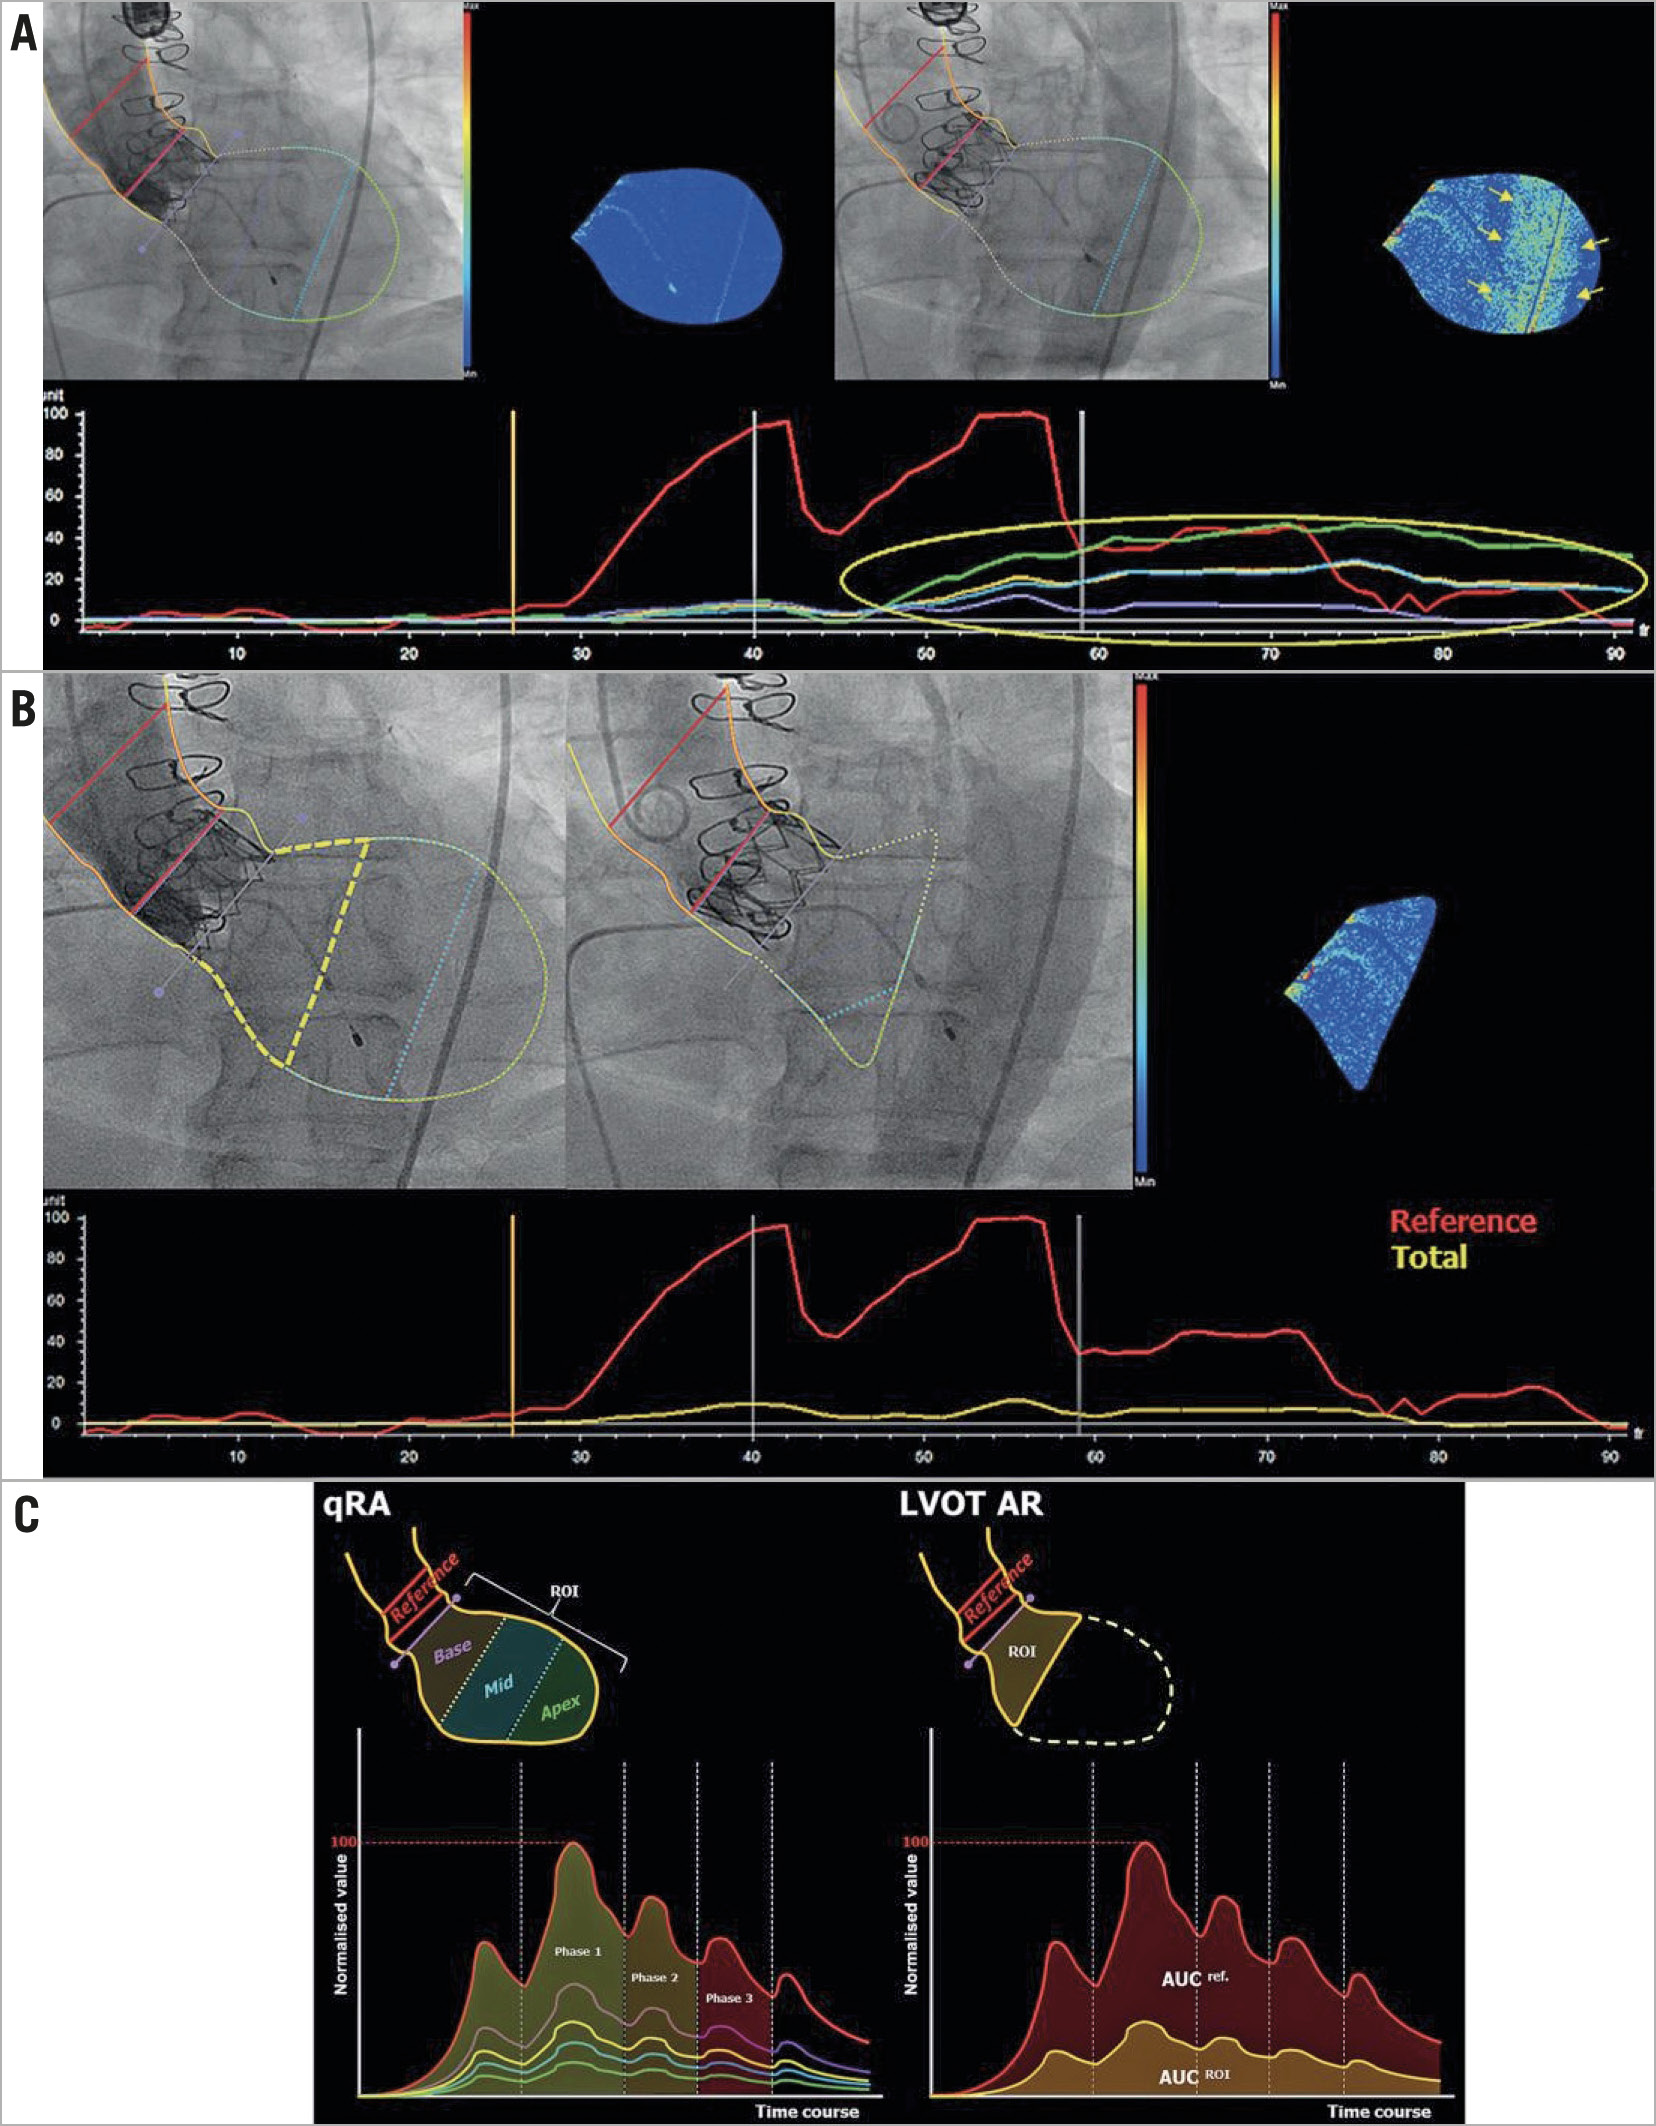
Figure 8. Representative images of the advantage of LVOT-AR in contrast with qRA. Reproduced with permission from Tateishi et al11. A) Regular analysis of qRA. However, the yellow arrows show the increase in density in the middle/apical part of the LV not related to regurgitation, but related to the contrast-filled descending aorta overlapping the LV (upper right panel), also detected on the time-density curves (lower panel). B) The contour of the ROI confined to the subaortic segment (LVOT-AR: yellow dashed line in upper left panel) and excluding the region of the descending aortic overlap so that the spurious increase in the contrast density can be corrected (upper middle and right, and the time-density curve in lower panel). C) Schematic representation of qRA index and LVOT-AR. Left panel: the ROI includes all three LV segments and the five TDCs are generated. qRA index algorithm is based on comparing the AUC of the three LV segments (basal – purple, mid – blue, and apical – green) versus the AUC of the reference region (aortic root – red). RAUC can also be computed for the whole ventricle by comparing the AUC of the entire ventricle (yellow) to that of the reference region. The calculation is made over three cardiac cycles (phases 1-3). Contrast-density values in the ROI are normalised to the peak density value in the reference region, which is given a value of 100. Right panel: the ROI is confined to the subaortic segment (basal segment), and the RAUC is the ratio between the AUC of the subaortic segment (yellow curve) and the reference region (red curve). AR: aortic regurgitation; LV: left ventricle; LVOT: left ventricle outflow tract; qRA: quantitative regurgitation analysis; RAUC: relative area under the curve; ROI: region of interest; TDCs: time-density curves
For this analysis, since data were retrospectively assessed, no acquisition guidelines were followed. The feasibility of LVOT-AR was shown in comparison with the feasibility of qRA in the same cohort of patients. A total of 137 were analysed with both techniques (qRA and LVOT-AR). Only 54 cases (29.7%) were analysable using qRA, as opposed to 118 cases (64.8%) that could be analysed using LVOT-AR, showing the higher yield of LVOT-AR for the analyses. LVOT-AR was also shown to be highly reproducible. The inter-observer correlation coefficient was 0.95 (p<0.0001) and the intra-observer correlation coefficient was 0.97 (p<0.0001)11.
IN VITRO VALIDATION
Although not in a chronological order of events, the investigators performed the in vitro experiment following the experience acquired during the analysis of aortograms stemming from clinical practice. With the success of the method and the knowledge of the three modalities of videodensitometric evaluation of regurgitation, namely (i) RAUC or LV-AR, (ii) LVOT-AR, and (iii) qRA, Abdelghani et al sought to determine the accuracy of the results of videodensitometry in a controlled environment of regurgitation (a mock circulation system with a transcatheter heart valve)12. The mock circulation system (Figure 9) was set up to simulate the left ventricle and the aortic root with a bioprosthetic valve in between. It consisted of an elastic silicone tube corresponding to the aortic root, a heart valve module (a 25 mm diameter plastic tube in which a prosthetic valve was deployed), and a rigid polycarbonate tube including a servo motor-operated piston pump acting as the left ventricle. The system was kept warm (body temperature – 37 degrees Celsius) submerged in a 30-litre water bath. A pulsatile cardiac output of 5 L/min was generated at a rate of 75 cycles/min with a corresponding ISO 5840-compliant flow curve (35% systole and 65% diastole per cycle).
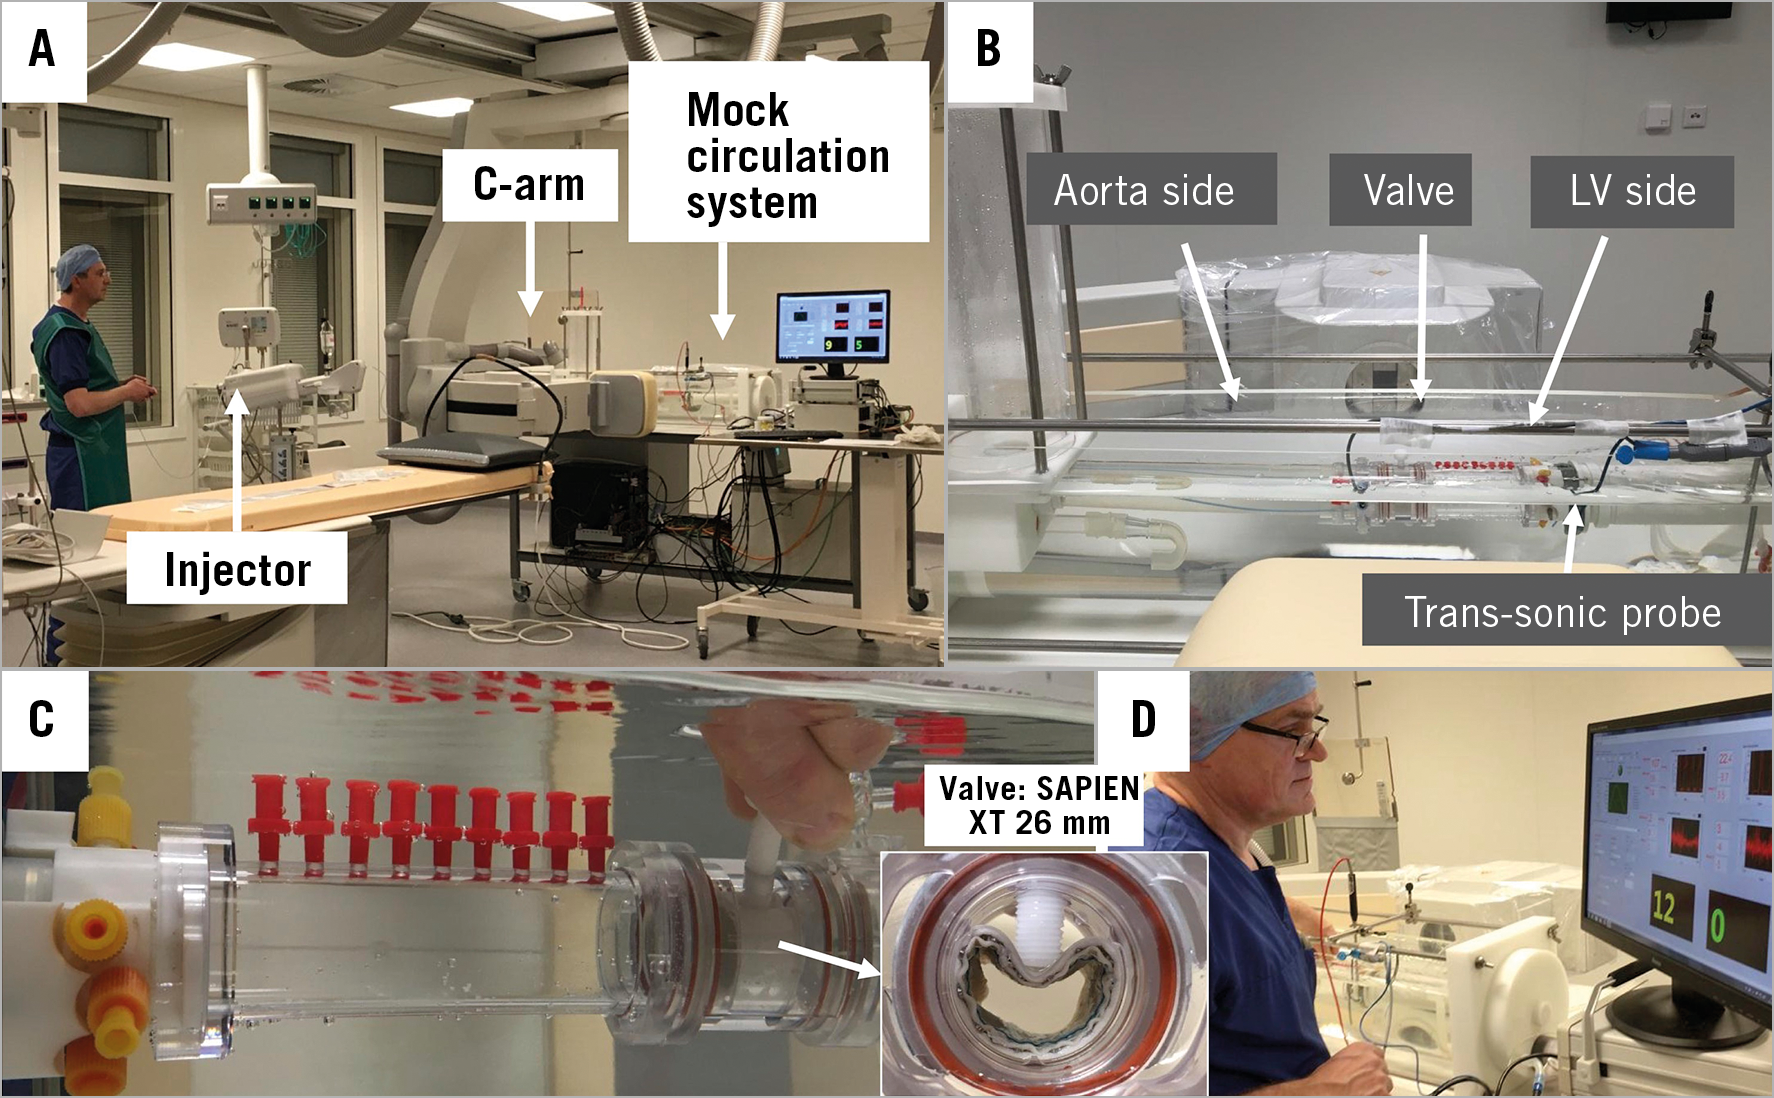
Figure 9. In vitro validation experiment set-up. A) Cath lab with the mock circulation system mounted and captured by the C-arm. B) The mock circulation system showing the aortic and LV sides, divided by the prosthetic valve and the positioning of a trans-sonic probe in the LV side. C) Closer look at the circulation system showing how to compress the prosthetic valve externally with a white plastic screw, creating a controlled deformation in order to provoke a paravalvular regurgitation. White arrow highlights the en face view of the prosthetic valve evidencing its controlled deformation created by the plastic screw. D) Technician adjusting in real time the amount of regurgitation by pressing the screw and checking the transducer-measured regurgitation on the screen. Reproduced and modified with permission from Abdelghani et al12.
To create a paravalvular regurgitation observed after implantation of a prosthetic transcatheter valve, a radiolucent screw was inserted radially into the valve module and advanced to deform the stent of the valve (26 mm SAPIEN XT device; Edwards Lifesciences, Irvine, CA, USA) (Figure 9C, Figure 9D). Thus, a predicted regurgitation could be created, controlled by an operator with real-time visualisation of the trans-sonic measured regurgitation (Transonic 28 PAU, with TS 410 flowmeter; Transonic Systems Inc., Ithaca, NY, USA). A total of 12 experiments were performed with increasing degrees of regurgitation fraction12. For both LV-AR (regression line=0.845x –6.011) and LVOT-AR (0.816x –3.049) the correlation with regurgitation fraction was strong (Spearman’s r2=0.958 and 0.964, respectively) (Figure 10). Also, both methods (LV-AR and LVOT-AR) were considered not different (p=0.514) and were strongly correlated (r2=0.992, p<0.001, y=0.967x +2.718), in the absence of any overlapping structures.
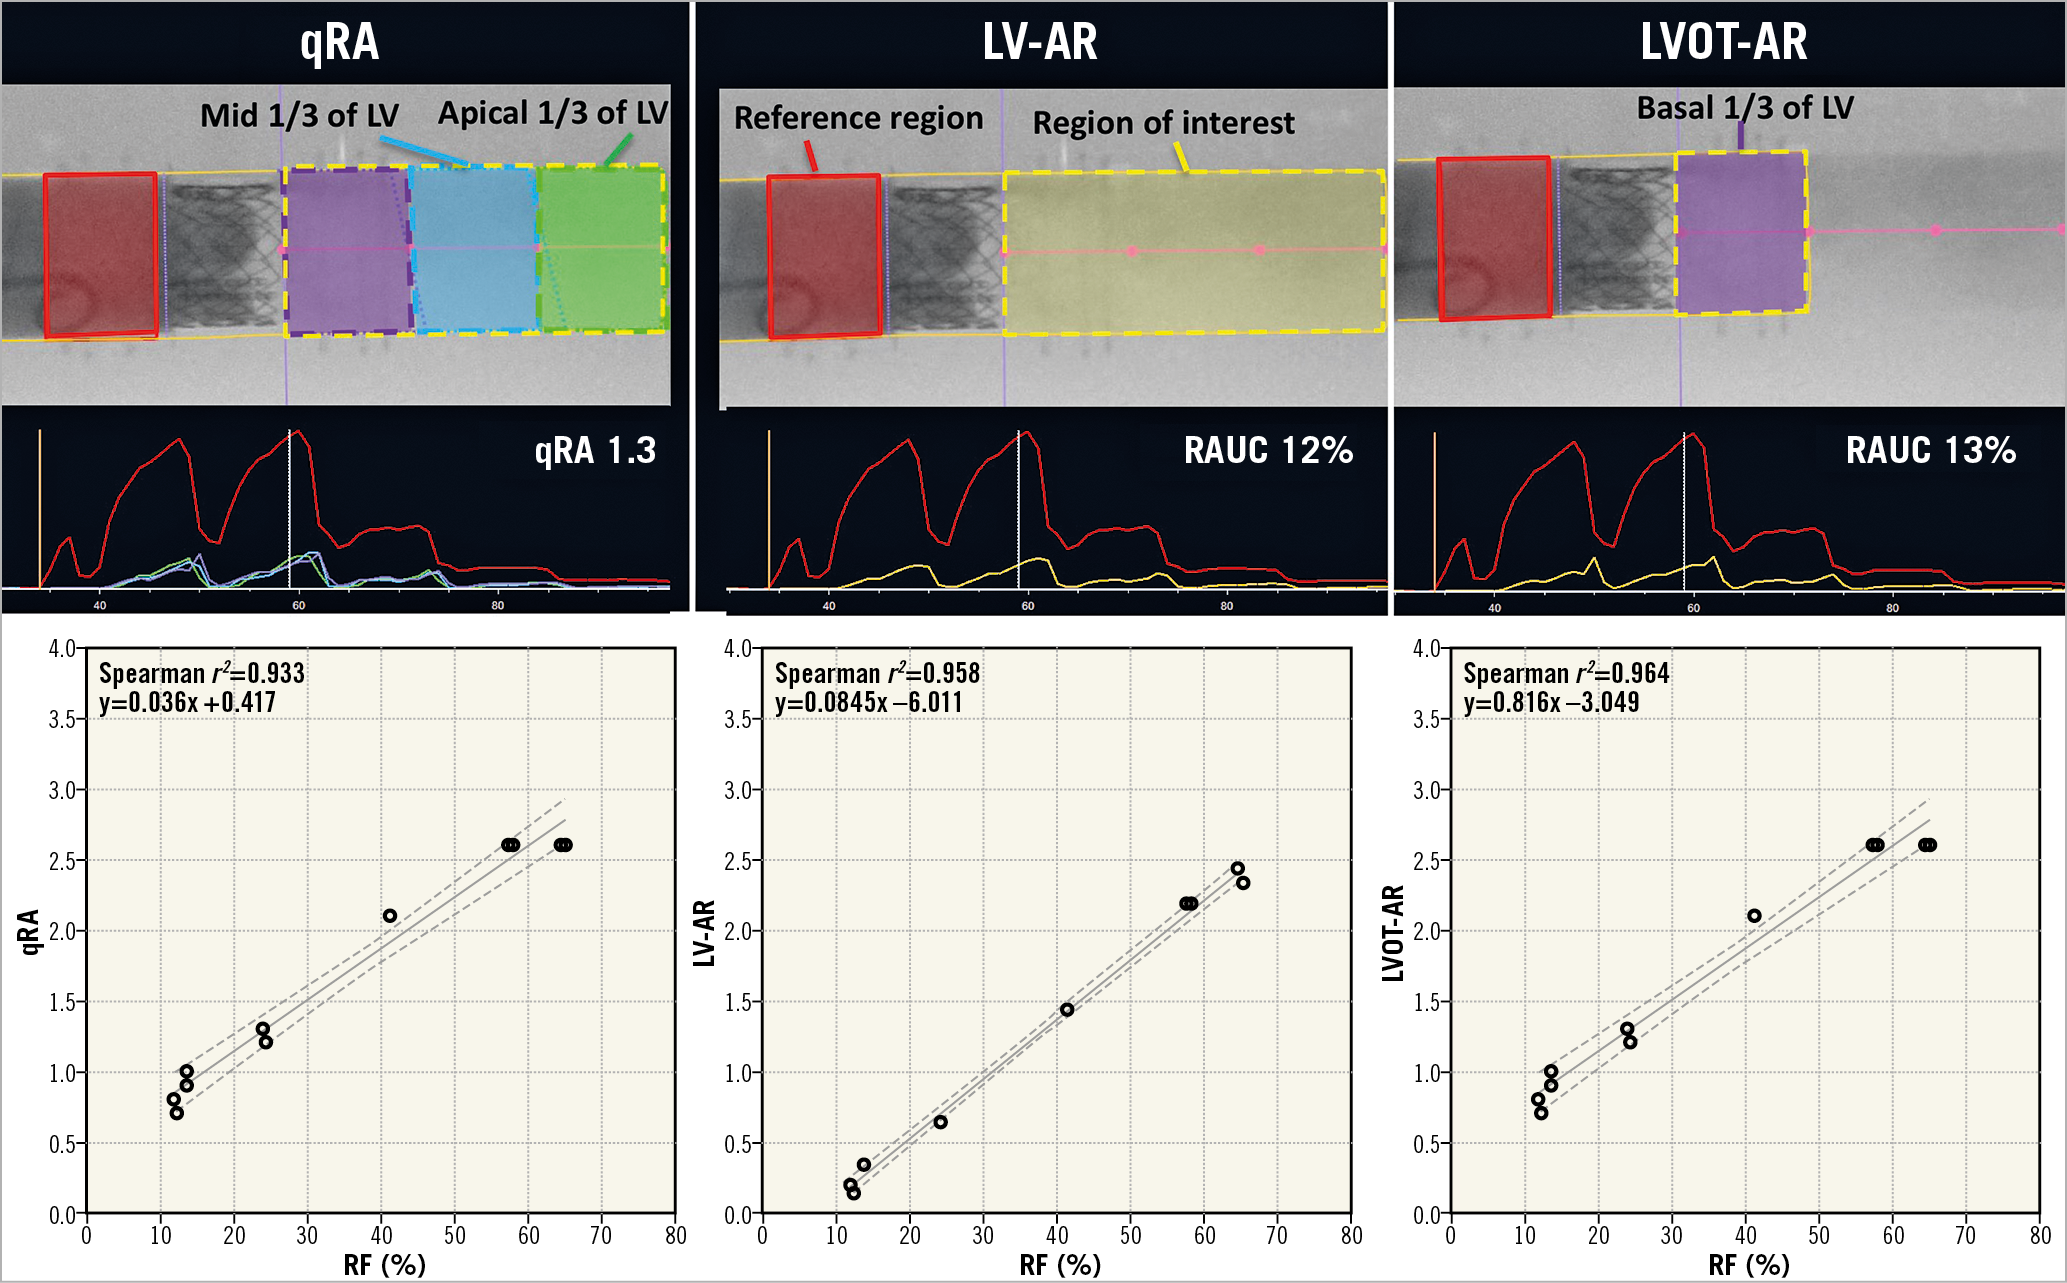
Figure 10. Videodensitometric assessment of regurgitation. Upper panels: representation of the three modalities (qRA, LV-AR and LVOT-AR) of videodensitometric assessment of regurgitation: in vitro experiment. Lower panels: the three scatter plots with the line of best fit and the 95% confidence interval lines displaying the relation between the regurgitation fraction (RF; on the horizontal axis) assessed by the trans-sonic probe and videodensitometric parameters of regurgitation severity on the vertical axis – qRA, LV-AR and LVOT-AR. Reproduced and adapted with permission from Abdelghani et al12.
ESTABLISHMENT OF NUMBER OF CARDIAC CYCLES TO ANALYSE
Another important aspect of this controlled experiment was the determination of the number of heart beats to be used for a proper analysis of regurgitation with videodensitometry. Although even with a single cardiac cycle the correlation of videodensitometry with RF could be documented, there was a stepwise increase in the correlation coefficients from one to four cardiac cycles. With three cardiac cycles the correlation was already very strong (r2 higher than 0.9), with no meaningful increment in accuracy with further increase in the number of heart beats (Figure 11).
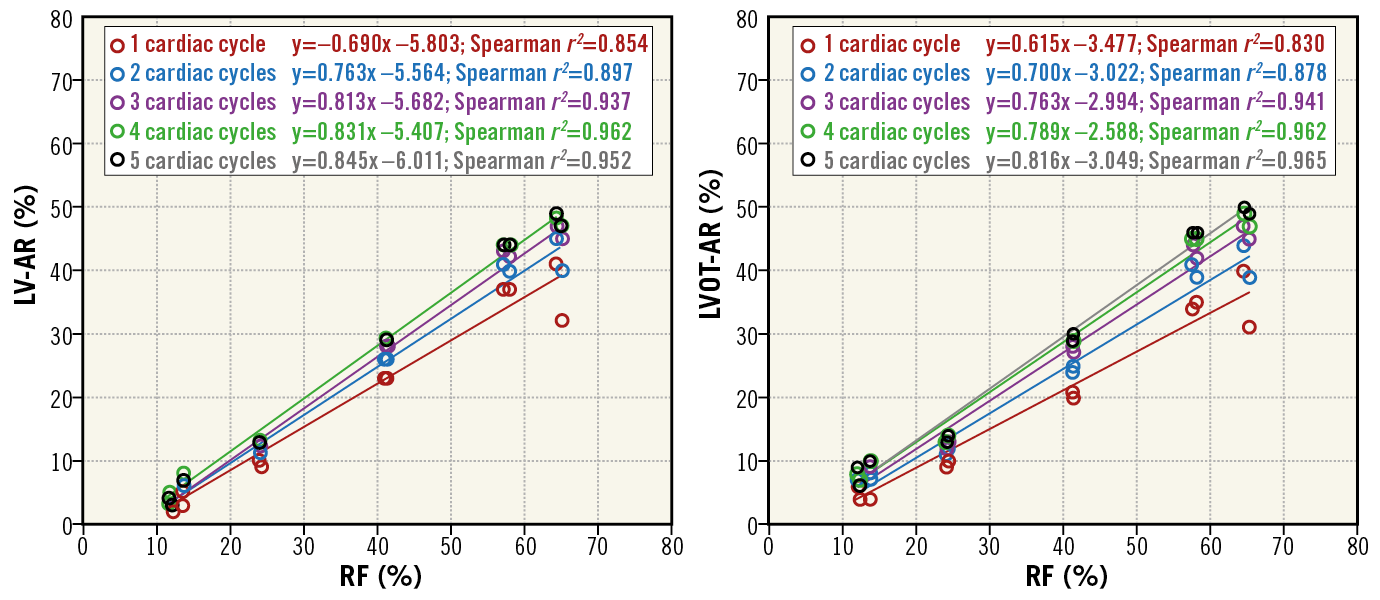
Figure 11. Correlation between LV-AR and LVOT-AR and regurgitation fraction (RF) using different numbers of cardiac cycles. Scatter plots with the lines of best fit displaying the correlations of LV-AR (left side) and LVOT-AR (right side) with RF when one (red), two (blue), three (purple), four (green) or five (black) cardiac cycle(s) is/are included in the analysis. With three cardiac cycles or more the best fit lines are visually superimposed and the Spearman r2 are all above 0.9 for either method. Reproduced and adapted with permission from Abdelghani et al12.
IN VIVO VALIDATION – ANIMAL STUDY
The investigators also sought to test the videodensitometry technique in vivo, with controlled increasing regurgitation. In order to conduct that experiment, Modolo et al48 used long peripheral WALLSTENTs (WALLSTENT™; Boston Scientific, Marlborough, MA, USA) with increasing diameters (6, 7, 8 and 10 mm). The WALLSTENTs were inserted across the aortic valve of an anaesthetised pig over a wire inserted in the LV and were partially deployed to induce a regurgitation – resulting in a fully unconstrained device across the valve, impeding the coaptation of the leaflets. After deployment, the WALLSTENTs were re-sheathed and replaced by a larger device to induce progressively more AR. The schematic representation of the procedure and the results of the quantitative assessment of regurgitation are shown in Figure 12. The authors were able to determine an increase in the quantitative amount of regurgitation related to the increase of the WALLSTENT diameter.
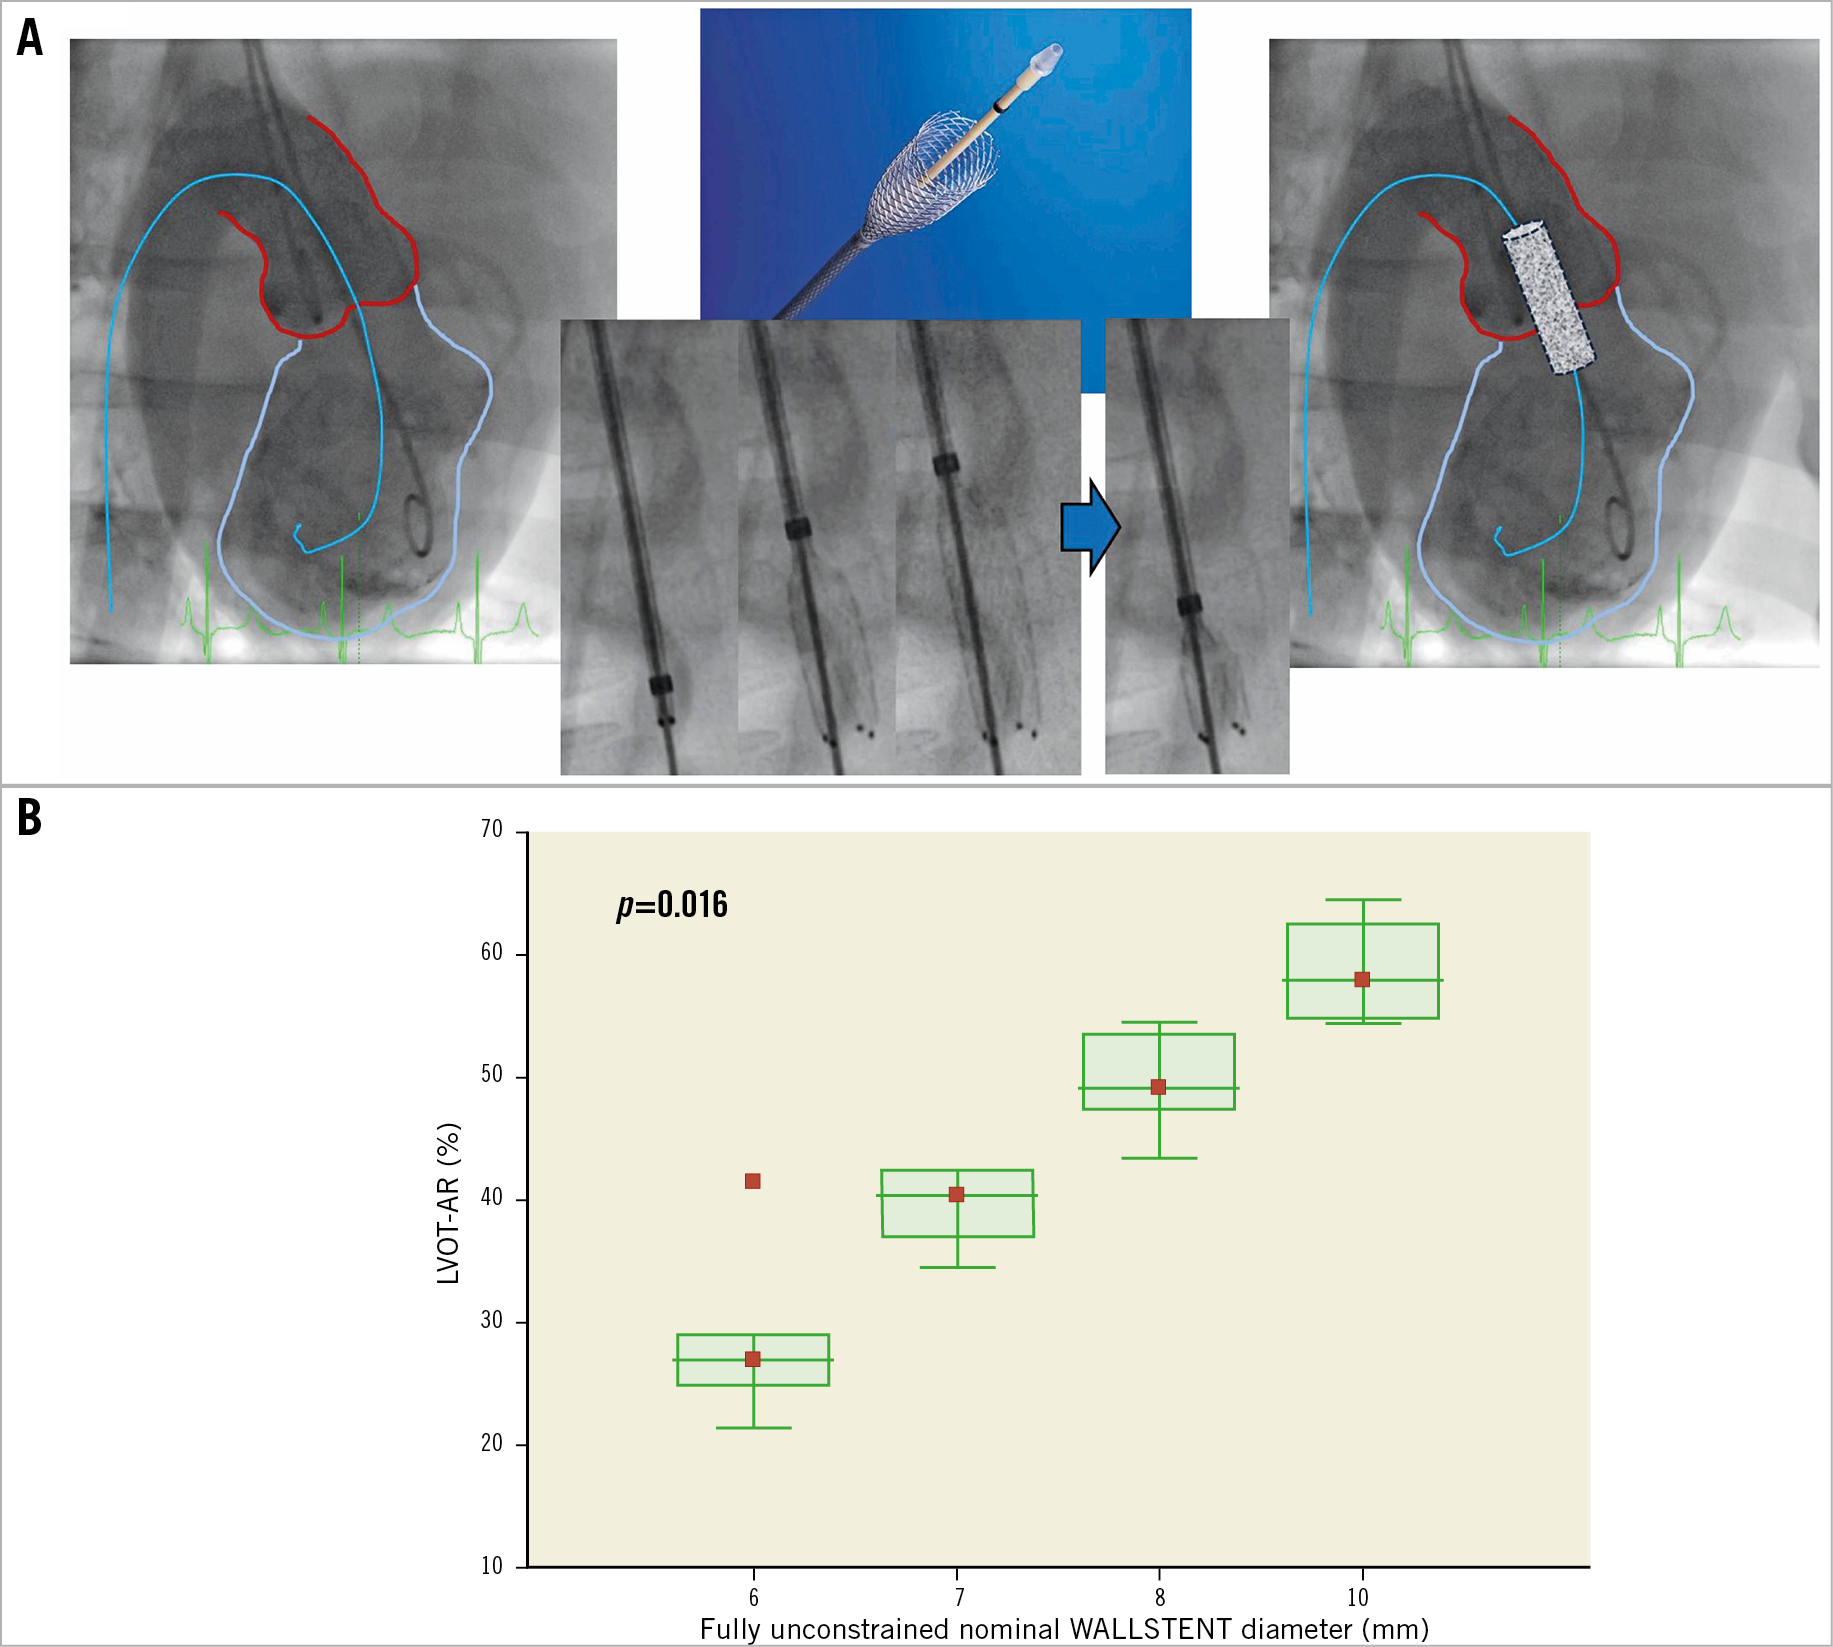
Figure 12. Induced regurgitation in vivo. A) Schematic representation of the procedure. After the positioning of the LV guidewire a WALLSTENT was inserted across the aortic valve and partially unsheathed and deployed (right side) up to its fully unconstrained diameter. The aortogram and quantitative assessment of regurgitation were then performed. B) The correlation of the multiple assessments of regurgitation with different diameters of WALLSTENT inserted. Study performed by Modolo et al48.
CLINICAL USE AND IMPLICATIONS OF VIDEODENSITOMETRY
PROGNOSTIC VALUE
It is known that paravalvular regurgitation following TAVI greatly influences clinical outcomes, especially mortality4,5,6. Thus, the use of quantitative aortography to assess regurgitation post TAVI was warranted. This work was performed by Tateishi et al11. In an analysis of the Brazilian TAVI Registry47, the investigators assessed the regurgitation post TAVI evaluated by an academic core laboratory.
With a mean follow-up of 609 days and 112 patients with LVOT-AR assessed, the investigators were able to determine a cut-off value of regurgitation of 17%, by a receiver operating characteristic curve, for best prediction of all-cause mortality. In fact, a time-to-event analysis was able to show a significant separation of survival curves (Figure 13). Even in a Cox regression adjusted model, LVOT-AR above 17% was considered an independent predictor of all-cause mortality (hazard ratio [HR] 2.40, 95% CI: 1.27-4.54, p=0.007). Similar results were found in a cohort of Japanese patients undergoing TAVI (n=51). Using the same cut-off point, the investigators identified higher one-year all-cause mortality in those with LVOT-AR >17% (59.5% versus 16.6%, p=0.03)15 (Figure 14). These studies showed a close link between all-cause mortality after TAVI procedures and regurgitation assessed by the quantitative aortogram method.
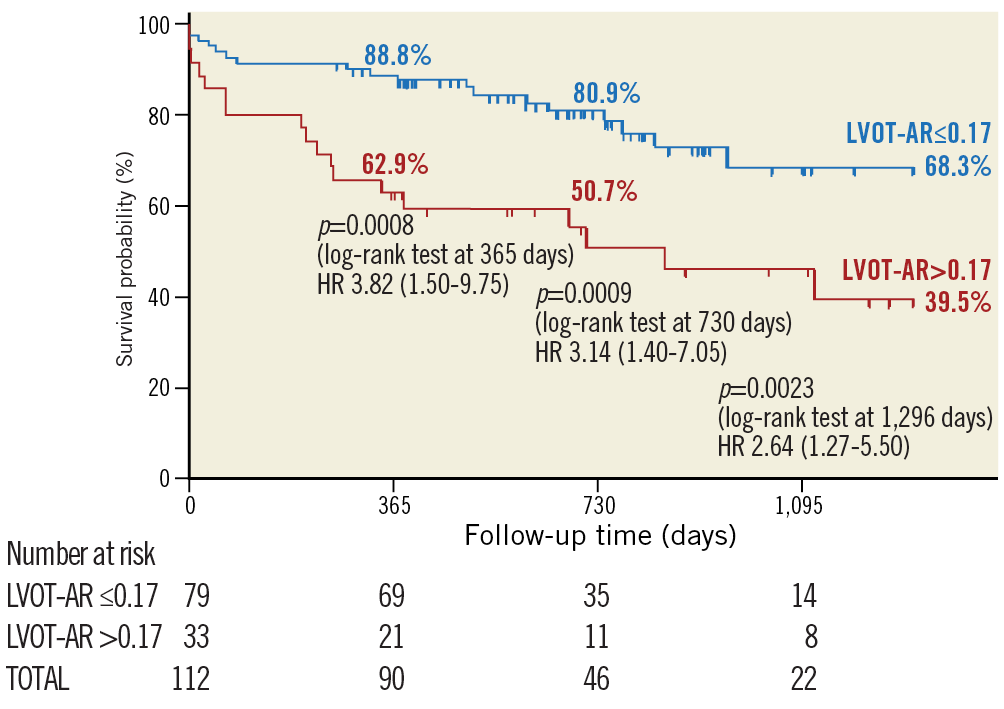
Figure 13. Time-to-death curves using the Kaplan-Meier method and log-rank test of cumulative survival according to LVOT-AR categories (above 17% or 17% and below). Reproduced with permission from Tateishi et al11.
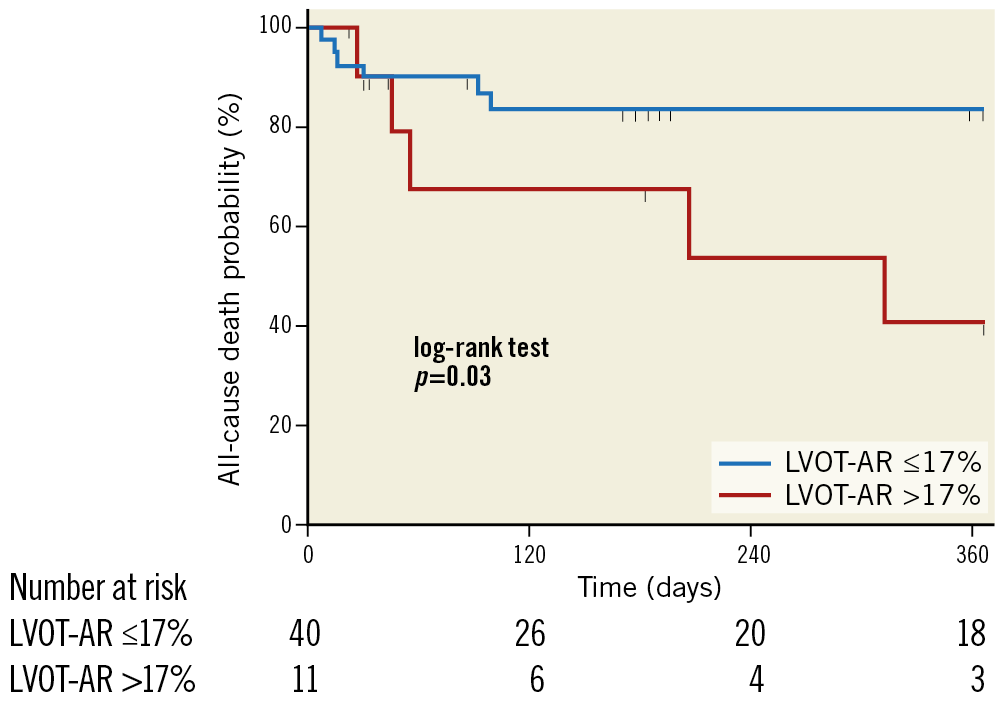
Figure 14. Time-to-death curves using Kaplan-Meier method and log-rank test of cumulative survival in a Japanese cohort of patients undergoing TAVI according to LVOT-AR categories (above 17% or 17% and below). Reproduced with permission from Tateishi et al15.
With regard to the categorical ordinal assessment of regurgitation, even mild amounts of paravalvular regurgitation are associated with poor outcomes5. Nowadays, the impact of a mild regurgitation could be evaluated specifically in a sensitive way, in contrast to the past, when mild regurgitation was frequently mixed and merged with trace, none or, in particular, when a moderate AR was misclassified as mild. Thus, a more granular approach, such as the quantitative continuous method, given in percentage, might assist physicians better and more accurately discriminate within the trace/mild/moderate categories of regurgitation.
VALIDATION AND CORRELATION WITH ECHOCARDIOGRAPHY AND MRI
ECHOCARDIOGRAPHY
Association of quantitative results of VD were made with both transthoracic and transoesophageal echocardiography. Using a cohort of 399 patients from the Brazilian TAVI Registry47, Abdelghani et al10 were able retrospectively to evaluate 228 aortograms that were considered analysable for VD. Comparing the values of quantitative assessment of regurgitation (LVOT-AR) with the strata of regurgitation by pre-discharge TTE, the investigators found that: LVOT-AR was 0.10 (0.04-0.16), 0.12 (0.06-0.19), and 0.25 (0.16-0.34) in none-trace, mild and moderate-severe AR, respectively (Figure 15A). Applying the receiver operating characteristic curve statistics, the authors encountered a cut-off value of >0.17 for defining echocardiographic moderate to severe regurgitation (Figure 15B, Figure 15C).
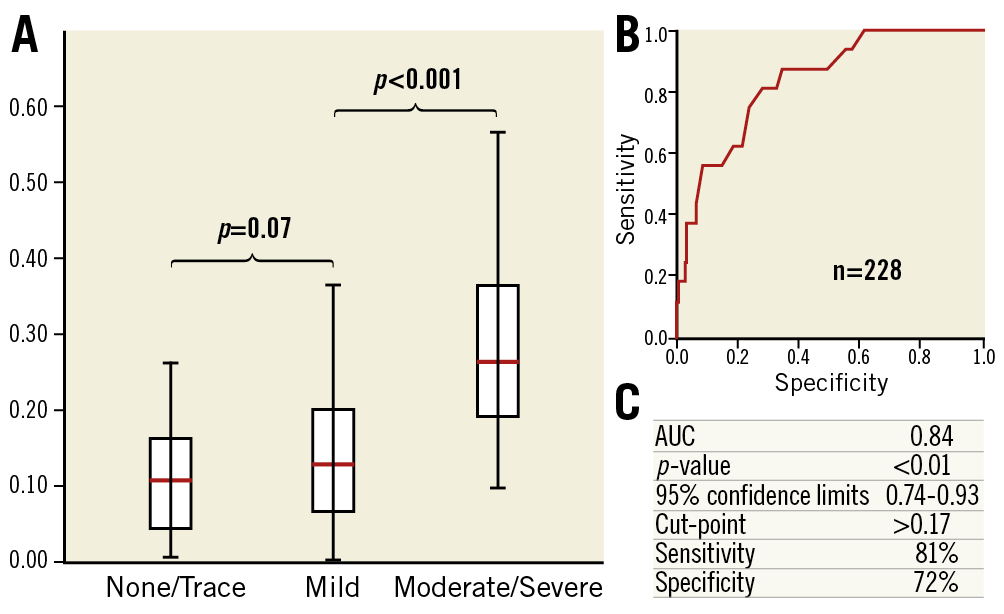
Figure 15. Discrimination of LVOT-AR measures in different echocardiographic strata of regurgitation. A) The distribution of LVOT-AR across the echocardiographic grades of aortic regurgitation after TAVI. The box (interquartile range) and whiskers (95% confidence interval) plot shows a significant overlap of LVOT-AR between the none-trace and the mild grades of aortic regurgitation on echocardiography. B) Receiver operating characteristic curve of LVOT-AR corresponding to greater than mild AR as defined by echocardiography after TAVI. C) Statistical details of the ROC curve. Reproduced with permission from Abdelghani et al10. AUC: area under the curve
A cohort of 74 consecutive patients from a single centre (Yamaguchi University Hospital) was evaluated to investigate the association of TEE parameters with the quantitative assessment of regurgitation using the aortogram (LVOT-AR)15. From 51 patients who had a TEE performed, the investigators were able to discriminate different and crescent values of LVOT-AR in the strata of regurgitation assessed by circumferential extent on the intraprocedural TEE (Figure 16A). Also, an association of the continuous values of LVOT-AR and circumferential extent by TEE was observed (Figure 16B). These studies have shown that both TEE and TTE findings on aortic regurgitation post TAVI greatly correlate with the continuous findings of regurgitation assessed using only the aortogram with LVOT-AR.
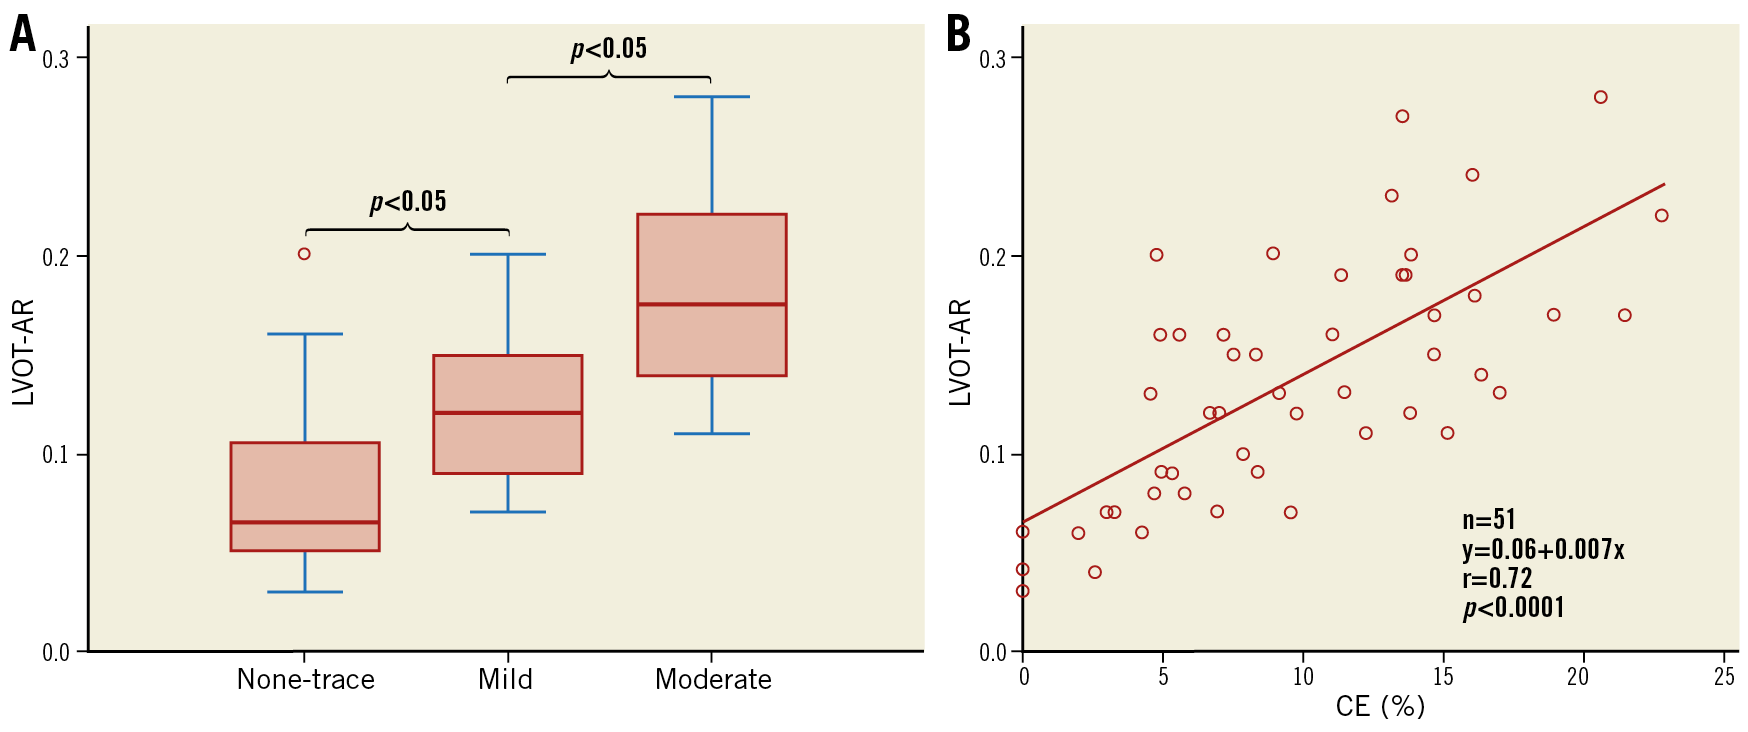
Figure 16. Relationship between LVOT-AR and transoesophageal echocardiographic severity of regurgitation. A) LVOT-AR according to echocardiographic post-TAVI aortic regurgitation as defined by percentage of circumferential extent (CE) on intraprocedural transoesophageal echocardiography (n=51). B) Scatter plot of the continuous assessment of CE (%) and LVOT-AR. Reproduced with permission from Tateishi et al15.
CARDIAC MAGNETIC RESONANCE
Following the validation of videodensitometry (LVOT-AR) with both TTE and TEE, Abdel-Wahab et al used the videodensitometry technique to compare its results with the findings of the quantitative and reproducible assessment of regurgitation with cardiac magnetic resonance (CMR)9. The investigators used a subset of 135 patients who underwent a TAVI procedure and in whom CMR was performed after the procedure. CMR data were analysed by two independent observers experienced in imaging. The aortic regurgitation fraction by CMR (CMR-RF) was evaluated as a percentage value as follows: regurgitant volume divided by the total forward volume. Comparing the two continuous assessments of quantitative regurgitation (LVOT-AR and CMR-RF) the investigators found a reasonable correlation (Pearson statistics r=0.78, p<0.001) (Figure 17). Taken together with the findings of LVOT-AR validated against echocardiography, these results showed a good correlation of LVOT-AR with both categorical (TTE and TEE) and continuous (CMR) classification of regurgitation. Following this publication, Kapadia et al wrote a nice editorial about the paper entitled “The pursuit of perfection”, referring to the implementation of VD to assess regurgitation post TAVI49. A brief comparison of the methods for assessing regurgitation after TAVI is shown in Table 3.
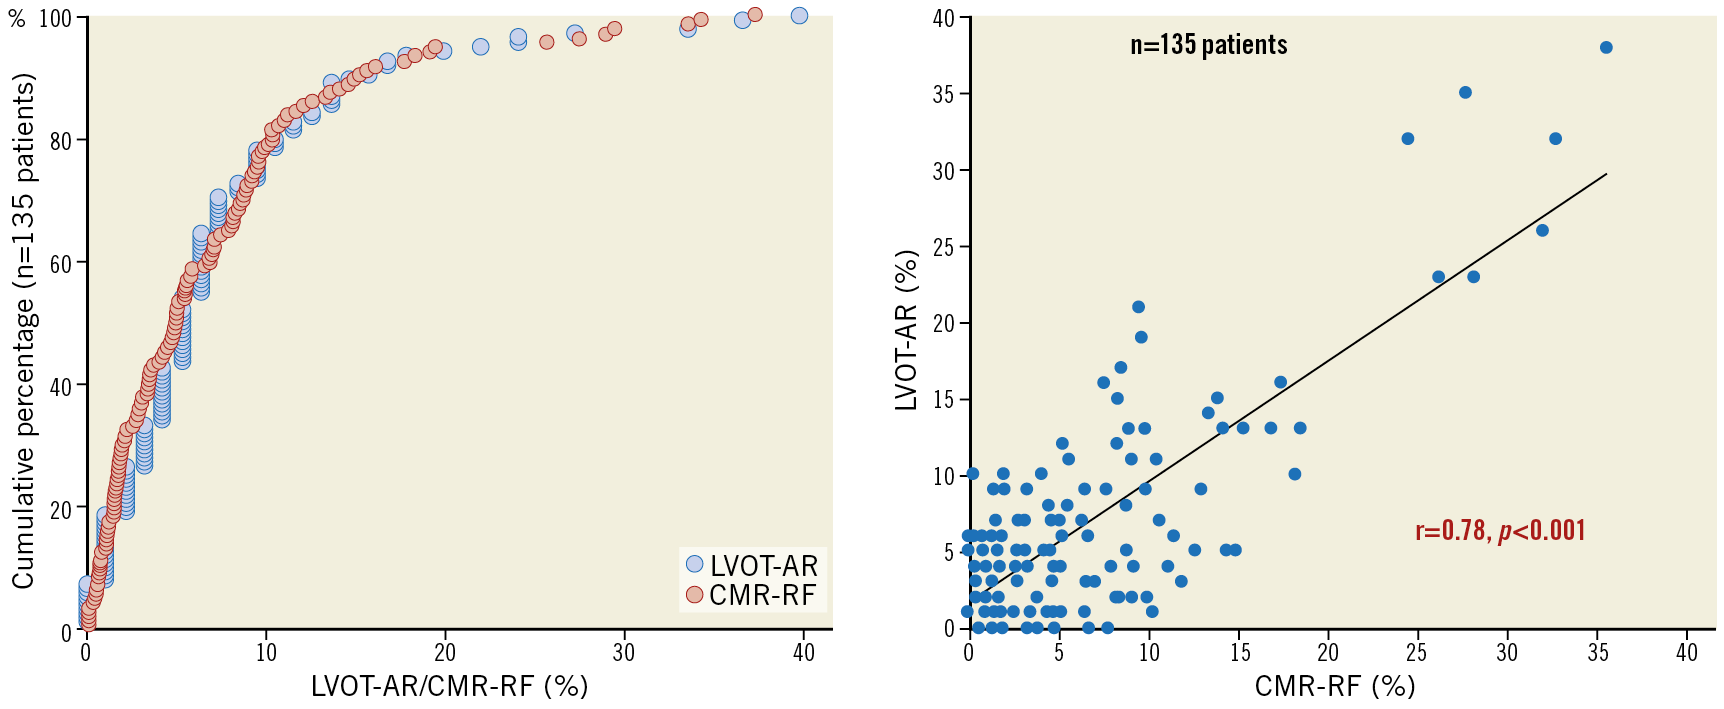
Figure 17. Correlation of LVOT-AR with magnetic resonance imaging. The left panel shows the cumulative frequency distribution curves for both LVOT-AR results (blue) and CMR-RF (red) in 135 patients. The right panel shows a scatter plot with a linear relationship between LVOT-AR and CMR-RF result for regurgitation after TAVI. Reproduced with permission from Abdel-Wahab et al9.

APPLICATION IN CLINICAL TRIALS AND CLINICAL PRACTICE
USE OF LVOT-AR IN CLINICAL TRIALS
Following its extensive validation (i) in vitro, (ii) with echocardiography, and (iii) with CMR, LVOT-AR assessment was applied in the context of a major clinical study. Modolo et al conducted a post hoc analysis of 472 unselected patients of the multicentre RESPOND (Repositionable Lotus Valve System – Post-Market Evaluation of Real-World Clinical Outcomes) study13. Evaluations of both echocardiograms and LVOT-AR were performed by an independent academic core laboratory, blinded to the other method of analysis, making these results unbiased for observational interferences. The investigators showed that there was a significant LVOT-AR difference across the different strata of PVR by transthoracic echocardiography (2.0% [0.0% to 4.0%] vs 3.0% [1.0% to 7.0%] vs 3.0% [1.75% to 9.25%] vs 7.0%; p<0.001) for none, trace, mild, and moderate PVR, respectively, as no severe regurgitation was observed. Its use in a major clinical study reinforced the previous findings and showed the feasibility of using it in the context of major clinical trials on TAVI. A previous work by Miyazaki and Modolo et al has already shown the difference in quantitative regurgitation on different valve types (first versus second generation)50 (Figure 18).
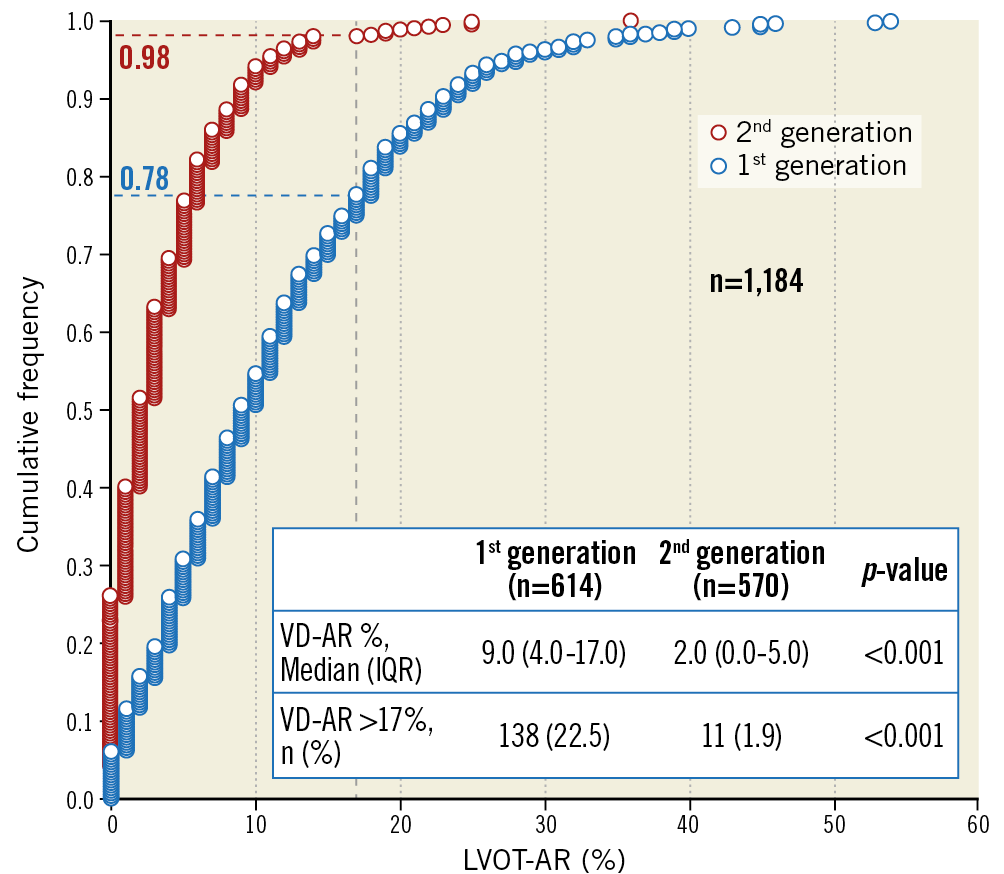
Figure 18. Cumulative frequency curves of LVOT-AR assessment in 1,184 patients receiving first-generation (blue) or second-generation (red) transcatheter aortic valves. The quantitative regurgitation is higher in patients after first-generation TAVI, and the number of patients with a regurgitation above 17% is also higher among those receiving first-generation aortic valves. Reproduced with permission from Miyazaki and Modolo et al50.
POSSIBLE USE FOR GUIDANCE OF POST-DILATATION
Although newer-generation and new commercially available valves are designed with better paravalvular sealing features, balloon post-dilatation is still performed in up to 17% of TAVI procedures51,52. However, with the minimalist approach for TAVI, without an intraprocedural echocardiogram, the evaluation of PVR needs to be performed using the angiogram. Miyazaki et al evaluated the quantitative changes in PVR resulting from post-dilatation of the valves assessed by VD (LVOT-AR)53.
Analysis of 61 patients from the Brazilian TAVI Registry – in whom balloon post-dilatation was performed – showed an improvement in LVOT-AR from 24% (18%-30.5%) to 12% (5.5%-19%), p<0.001. Despite the small sample size, there was a clear numerical difference in four-year all-cause mortality between those with final LVOT-AR >17% (34%) and those with LVOT-AR <17% (19%), p=0.11 (Figure 19). This study evidenced the potential role of quantitative assessment of regurgitation with VD in evaluating the need for balloon post-dilatation after TAVI. Although the present “Insight” document has focused on quantitative aortography for the assessment of regurgitation post TAVI, the technique is also feasible in patients who have undergone surgical implantation of aortic valves. Recently, Teixeirense et al demonstrated the feasibility of performing the analysis in a patient with a late PVR more than 10 years after surgical aortic valve replacement. The authors showed a decrease in the regurgitation from 16% to 1% immediately after the closure of the paravalvular tunnel with a plug7.
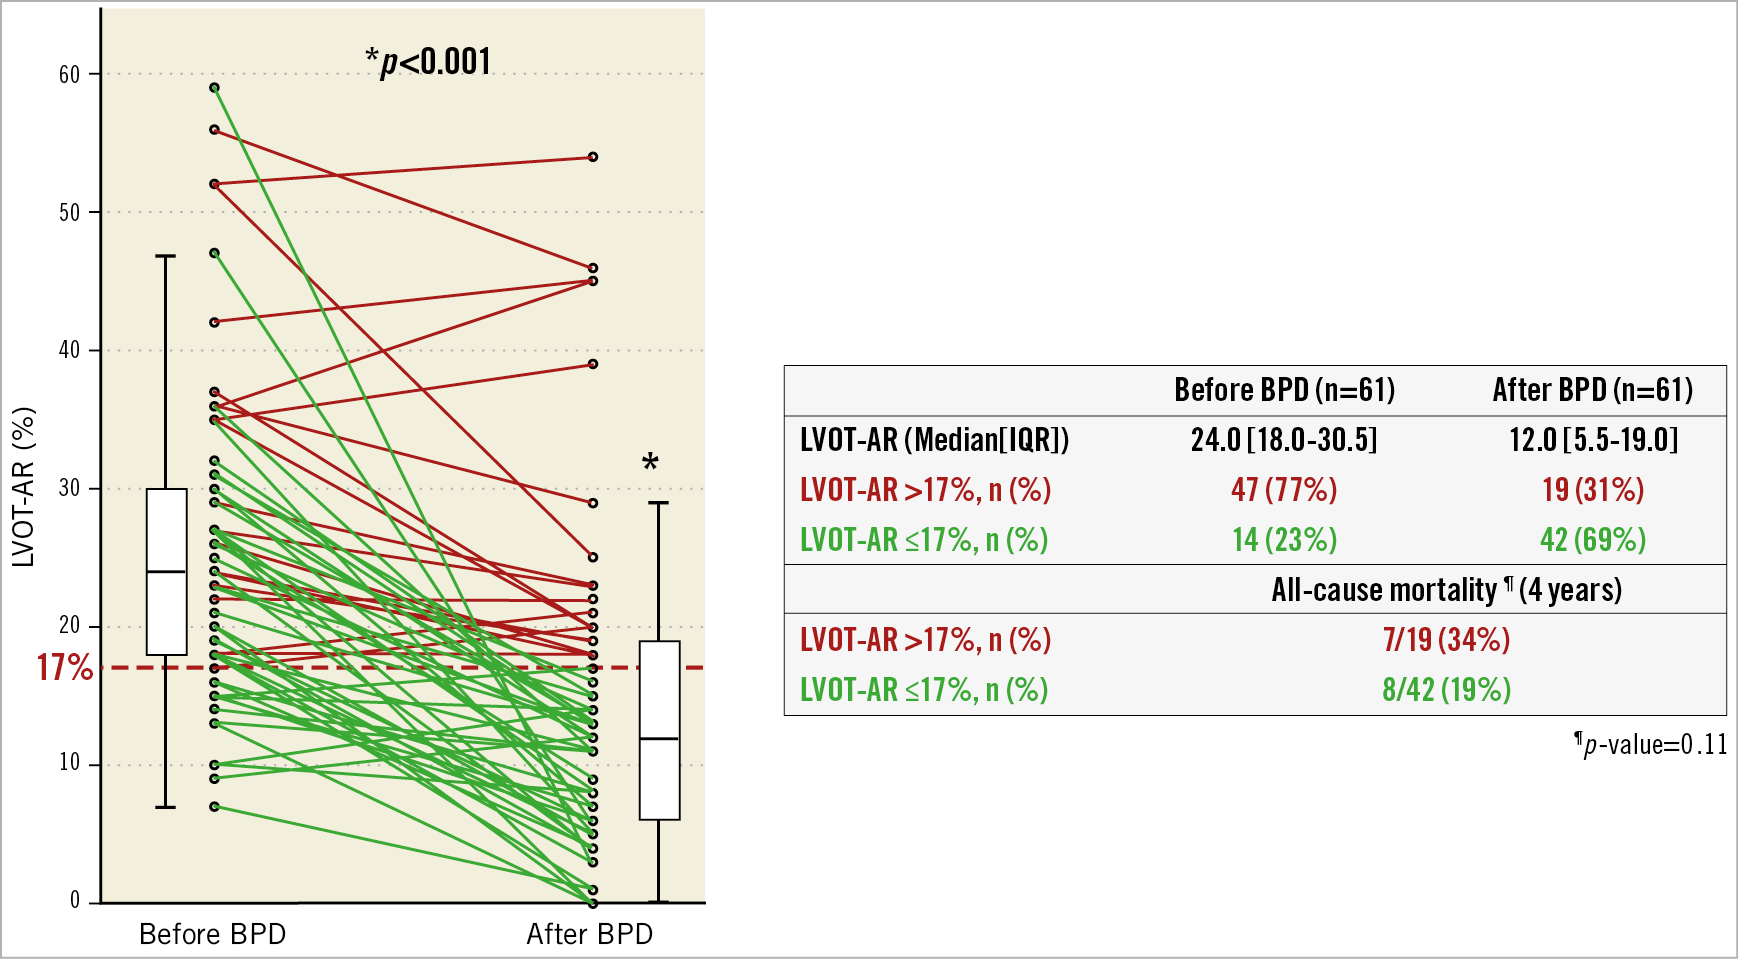
Figure 19. Serial changes of the LVOT-AR. Individual serial changes before and after balloon post-dilatation are shown (left panel). In patients with LVOT‑AR >17%, seven deaths (34%) occurred, whereas, in patients with VD-AR ≤17%, eight deaths (19%) were observed. Reproduced and adapted with permission from Miyazaki et al53.
Of course, the evaluation of regurgitation after TAVI should not rely solely on VD, but on the consistency of multimodality assessment, such as visual angiographic assessment, echocardiography (when feasible and available, with an experienced operator) and even haemodynamic assessment.
THE FEASIBILITY CAVEATS
The evolution of the VD assessment of AR, going from the analysis of the entire LV (qRA) to the analysis of only the left ventricle outflow tract (LVOT-AR) increased the feasibility of analysis, but did not solve the issue. Recent studies have shown that the retrospective analysability of LVOT-AR is still moderate (still with overlap of the descending aorta with the LVOT), thus compromising the evaluation of the entire studied population. For example, the feasibility of analysis in the major RESPOND study was 57.5%. To overcome this issue, the investigators sought to determine whether a simple protocol for image acquisition would eliminate the overlapping of the region of interest (LVOT) and reference area (aortic root) with other contrasted segments such as the descending aorta (Figure 20).
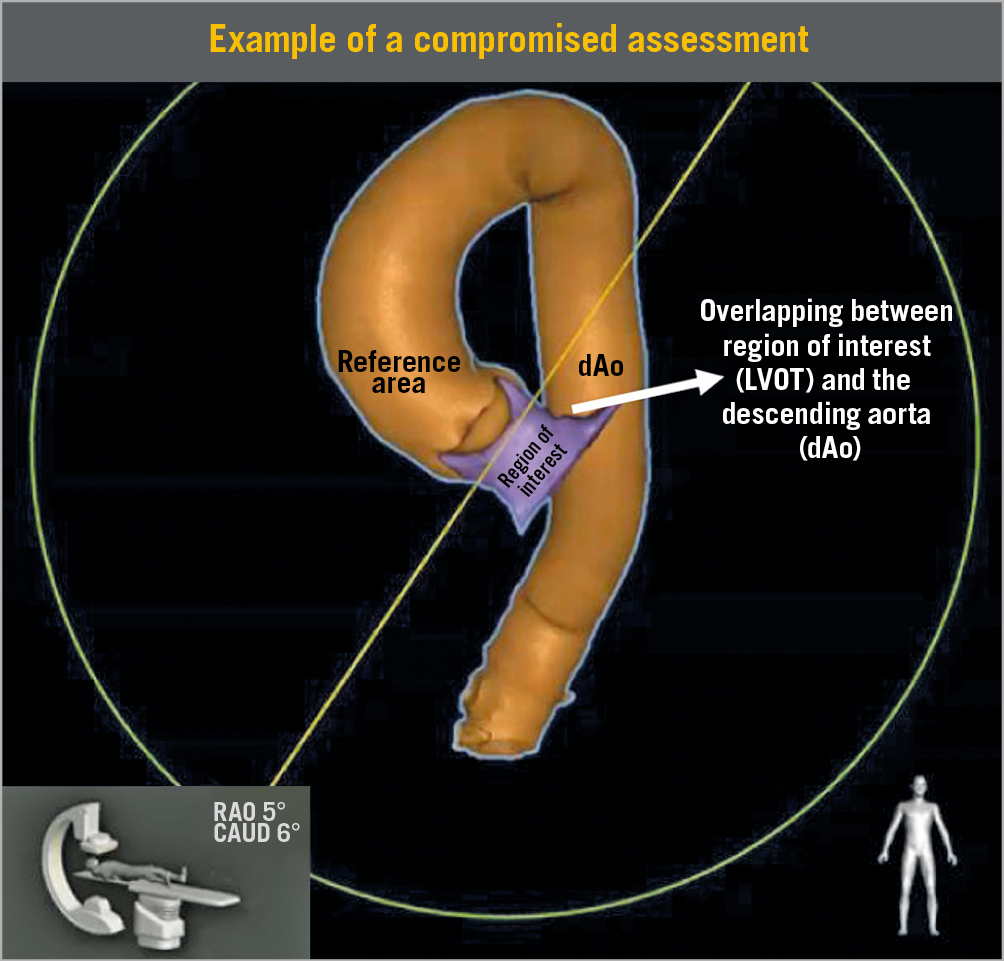
Figure 20. Three-dimensional CT reconstruction of the aorta (ascending and descending – in orange) and the LVOT (purple) - HeartNavigator (Philips Medical Systems). In this image we can see the location of the reference area (aortic root) and of the ROI (LVOT). In the left corner is a demonstration of the C-arm position and the angulation and rotation for this image acquisition during angiography. In this particular case, there is overlapping of the ROI with the descending aorta, thus making this projection unfeasible for a proper evaluation of LVOT-AR. Reproduced with permission from Modolo et al13. CAUD: caudal; dAo: descending aorta; LVOT: left ventricle outflow tract; RAO: right anterior oblique; ROI: region of interest
Recently, a single-centre experience showed that the retrospective feasibility of analysis improved from 57% to 100% after the implementation of a protocol for acquisition guided by preprocedural computed tomography54 (Figure 21). Subsequently, Modolo et al conducted a multicentre registry to determine the feasibility of analysis with a predefined protocol of acquisition (ASSESS-REGURGE55). The selection of the best projection for acquisition could be determined either from computed tomography, or based on a simple visual estimation of the position of the descending aorta made traceable by the radiopaque presence of the delivery system in the descending aorta – the so-called Teng’s rule56. After enrolment of 354 consecutive patients, the investigators identified a high feasibility of analysis of 95.5% (95% CI: 93.2% to 97.5%). This showed that a simple acquisition protocol based on different pre-planning techniques (either CT or visual estimation) yielded a high feasibility of analysis (close to 100%), in a multicentre experience.
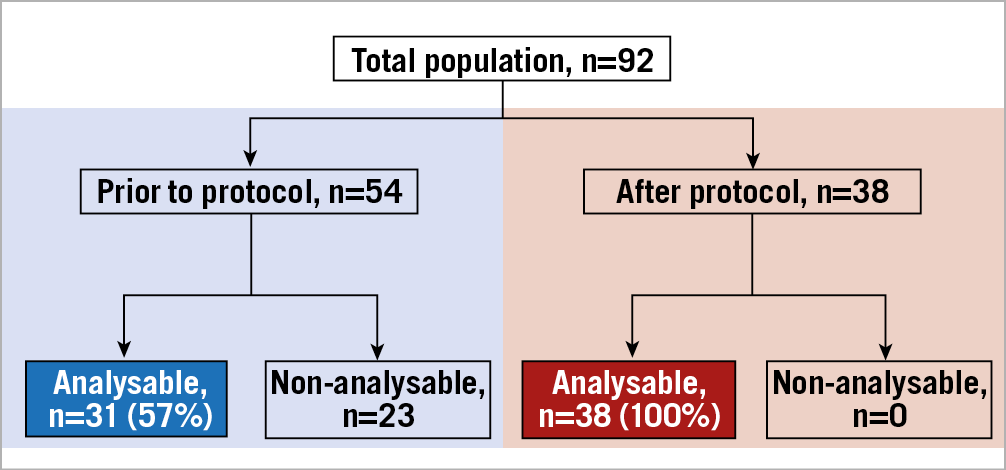
Figure 21. Single-centre experience showing the impact of implementation of a protocol for image acquisition on LVOT-AR feasibility of analysis. Reproduced with permission from Tateishi et al54.
FUTURE PERSPECTIVES
The VD technique for analysing AR was introduced more than 50 years ago, but only recently found its relevant application in the clinical arena. After intense validation both in vitro and in the clinical field, the next step will be to show its feasibility in the cath lab, and not only as a retrospective core laboratory tool. With that goal in mind, we are currently conducting the OVAL (Online Videodensitometric Assessment of Aortic Regurgitation in the Cath-Lab) study (NCT04047082), which is evaluating the feasibility of online assessment. The assessment is performed in real time (online) with the procedure, and the results will be compared with the results from the offline core laboratory experienced examiner (R. Modolo). The results from the OVAL study are eagerly awaited since they may usher VD into daily clinical practice for TAVI procedures. Together with the clinical practice implications, VD could also be applied in major clinical trials for objective comparison of the sealing feature devices of newer-generation valves. In addition, it could be an adjunctive tool for assessing regurgitation in TAVI: (i) for AR patients, (ii) for novel bioengineered or biorestorative leaflets, and (iii) for bicuspid aortic valve patients. Besides Amsterdam, other centres are implementing the online system in their cath labs, such as Toulouse, France, and Galway, Ireland. The installation of the software for offline analysis is simple, and a trained technician or an operator can perform the analysis in two to three minutes on average.
Ongoing work is aiming to validate the same technology for application in the mitral field, which is increasing after the development and introduction of novel devices for mitral regurgitation in interventional cardiology57 (Figure 22).
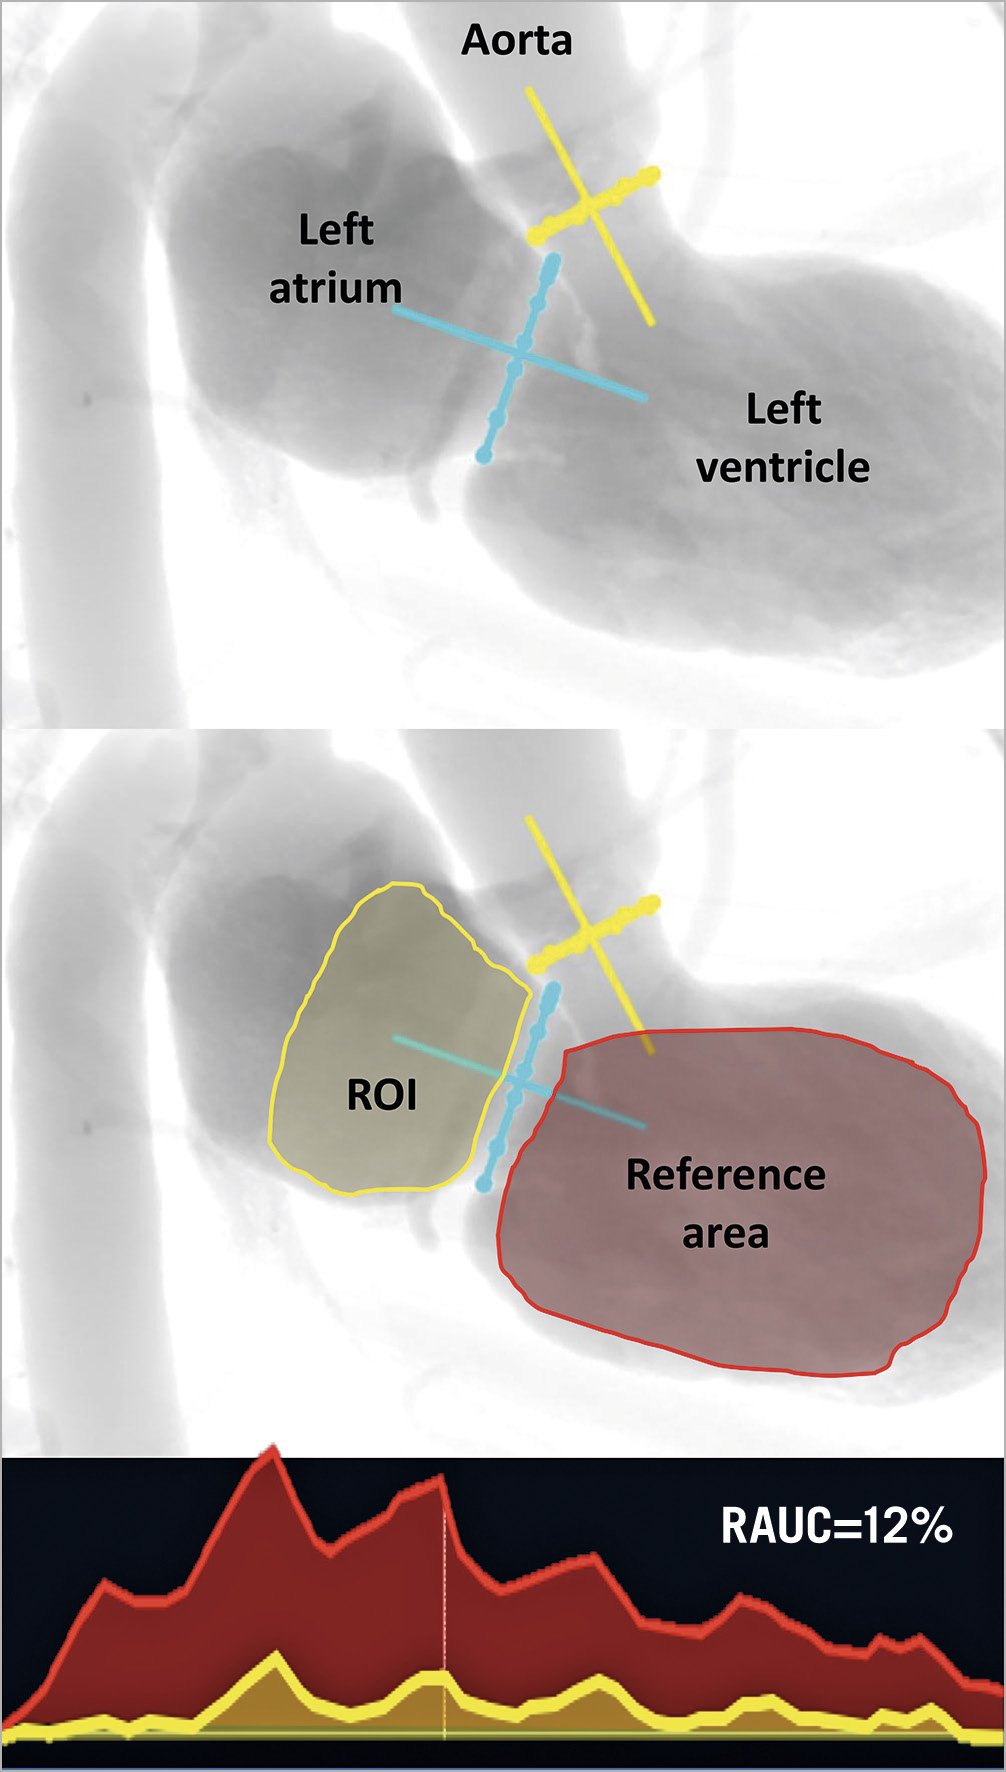
Figure 22. Left ventricle angiographic model showing the tracing of the region of interest (left atrium) and the reference area (left ventricle). Similar to the quantitative assessment of aortic regurgitation using aortography, the figure shows the quantitative assessment of mitral regurgitation using LV-gram. The appropriate angiographic view was selected from a prior computed tomography view as described by Pighi et al59. LA: left atrium; LV: left ventricle; RAUC: ratio area under the curve
Guest Editor
This paper was guest edited by Alec Vahanian, MD, PhD; Department of Cardiology, Hôpital Bichat-Claude Bernard, and University Paris VII, Paris, France.
Conflict of interest statement
R. Modolo has received research grants from Biosensors and SMT outside the submitted work. C.J. Schultz has received research grants and honoraria from Abbott Vascular unrelated to this work. J-P. Aben is an employee of Pie Medical Imaging B.V. F.S. de Brito Jr is a proctor for Medtronic and Edwards Lifesciences. C. Sayoun is a full-time employee of Philips Medical Systems. N.M. Van Mieghem has received institutional research grants from Abbott, ACIST, Boston Scientific, Medtronic, Edwards and PulseCath BV, and has received advisory fees from Abbott, ACIST, Boston Scientific, Medtronic, and PulseCath BV. P.W. Serruys reports personal fees from Abbott Laboratories, AstraZeneca, Biotronik, Cardialysis, GLG Research, Medtronic, Sino Medical Sciences Technology, Société Europa Digital & Publishing, Stentys France, Svelte Medical Systems, Philips/Volcano, St. Jude Medical, Qualimed, and Xeltis, outside the submitted work. The other authors have no conflicts of interest to declare. The Guest Editor is a consultant for Edwards Lifesciences.
Supplementary data
To read the full content of this article, please download the PDF.
