Abstract
Aims: Quantitative aortography using videodensitometry is a valuable tool for quantifying paravalvular regurgitation after TAVI, especially in the minimalist approach – without general anaesthesia. However, retrospective assessment of aortograms showed moderate feasibility of assessment. We sought to determine the prospective feasibility of quantitative aortography after a protocol of acquisition.
Methods and results: This was a multicentre registry in Japan, Canada, the Netherlands and Germany including consecutive patients with Heart Team indication to undergo TAVI over a median period of 12 months. Operators performed final aortograms according to a pre-planned projection (either by CT or visually – Teng’s rule). An independent core laboratory (Cardialysis) analysed all images for feasibility and for regurgitation assessment. From the four centres included in the present analysis, a total of 354 patients underwent TAVI following the acquisition protocol and all the aortograms were analysed by the core lab. The analyses were feasible in 95.5% (95% confidence interval [CI]: 93.2% to 97.5%) of the cases. This rate of analysable assessment was significantly higher than the feasibility in previous validation studies, such as in the RESPOND population (95.5% vs. 57.5%, p<0.0001). No differences were observed among different planning strategies (CT 96.5% vs. Teng’s rule 93%, p=0.159; or Circle 98.5% vs. 3mensio 95.8% vs. Teng’s rule 93%, p=0.247).
Conclusions: ASSESS-REGURGE showed a high feasibility of assessment of regurgitation with quantitative aortography with protocoled acquisition. This may be of great importance for quantifying regurgitation in TAVI procedures (optimisation, guidance of post-dilatation), and in future clinical trials, in order to address sealing features of novel devices for TAVI objectively. ClinicalTrials.gov Identifier: NCT03644784
Introduction
Indications for transcatheter aortic valve implantation (TAVI) have been continuously expanding, spreading worldwide. It has already proven its safety and efficacy, even in intermediate and low surgical risk aortic stenosis patients1,2,3. Ageing of the population along with the expansion of TAVI indications will increase the number of TAVI procedures around the world in the coming years. Hence, there will be a continuous need for a simplified, cost-effective, safe and straightforward procedure to cope with this growing medical burden. This simplifying approach is dubbed the minimalist TAVI approach and is already a reality4.
In this minimally invasive TAVI procedure, precluding general anaesthesia, the use of transoesophageal echocardiography during the procedure becomes at least restricted, if not excluded. However, in order to keep the procedure safe, a proper evaluation of post-implantation regurgitation is warranted, since this complication has a major impact on short- and long-term clinical outcomes5,6 and can be corrected during the procedure (e.g., with a valve-in-valve implant, balloon post-dilatation or even snaring). Thus, aortography (re-)emerges as a valuable tool for periprocedural aortic regurgitation (AR) assessment.
The low reproducibility of a subjective method, such as the visual angiographic assessment of regurgitation proposed by Sellers more than 50 years ago, begets the use of an objective and precise quantification of AR7,8. Quantitative aortography for proper evaluation of regurgitation post TAVI using videodensitometry has been validated in vitro and in vivo, evaluated with respect to transthoracic and transoesophageal echocardiography and magnetic resonance imaging and applied in clinical trial populations9,10,11,12,13. This objective method, which relies on aortography, can accurately and with great reproducibility quantify the regurgitation or paravalvular leak (PVL). However, due to the retrospective nature of the analyses so far, feasibility was not optimal, leaving a proportion of patients without evaluation10,12,14,15,16.
We sought to determine the prospective feasibility of analyses of quantitative aortograms using a protocol for planning the best projection either based on different cardiac computed tomography (CT) imaging or simply using a visual method – the so-called Teng’s rule17.
Methods
STUDY POPULATION
The present study is a multicentre, multicontinental registry including consecutive patients with Heart Team indication to undergo TAVI. Centres included in the study were Amsterdam, Bad Segeberg, Montreal, Rotterdam and Yamaguchi. Each participating institution was responsible for the selection, inclusion and TAVI indication of the patient. A list of participating centres, investigators, collaborators and numbers of patients included is provided in Supplementary Table 1.
QUANTITATIVE AORTOGRAPHY
Quantitative aortography was performed using the videodensitometry technique, previously described7, and refined afterwards for simplicity and focus on the left ventricle outflow tract (LVOT) for the quantification of the regurgitant fraction9,16. In brief, this technique uses solely the image of the aortogram, taking into account the density of contrast media that is regurgitated to the left ventricle with regard to the total density of contrast that is released in the aortic root. A software package (CAAS A-valve 2.0.2 –research mode; Pie Medical Imaging, Maastricht, the Netherlands) is used to calculate the regurgitant fraction. Two time-density curves are constructed relating to the reference area (aortic root) and to the region of interest (ROI), the LVOT. The quantitative regurgitation is the ratio of the areas under these curves (AUCregion of interest/ AUCreference area), given in percentage value (Figure 1, Moving image 1). The aortogram analysed was always the last one performed after the end of the procedure, meaning that, if there was a balloon post-dilatation, the aortogram assessed was the final one. Contrast volume, type, and rate of injection were left to the discretion of each centre’s operator and based on the clinical characteristics of each patient. Nevertheless, it has already been shown in vitro that, injecting either only 8 mL of contrast (with synchronised injection) or 20 mL of contrast (non-synchronised conventional injection) in the aortogram, the quantitative aortography results are similar18.
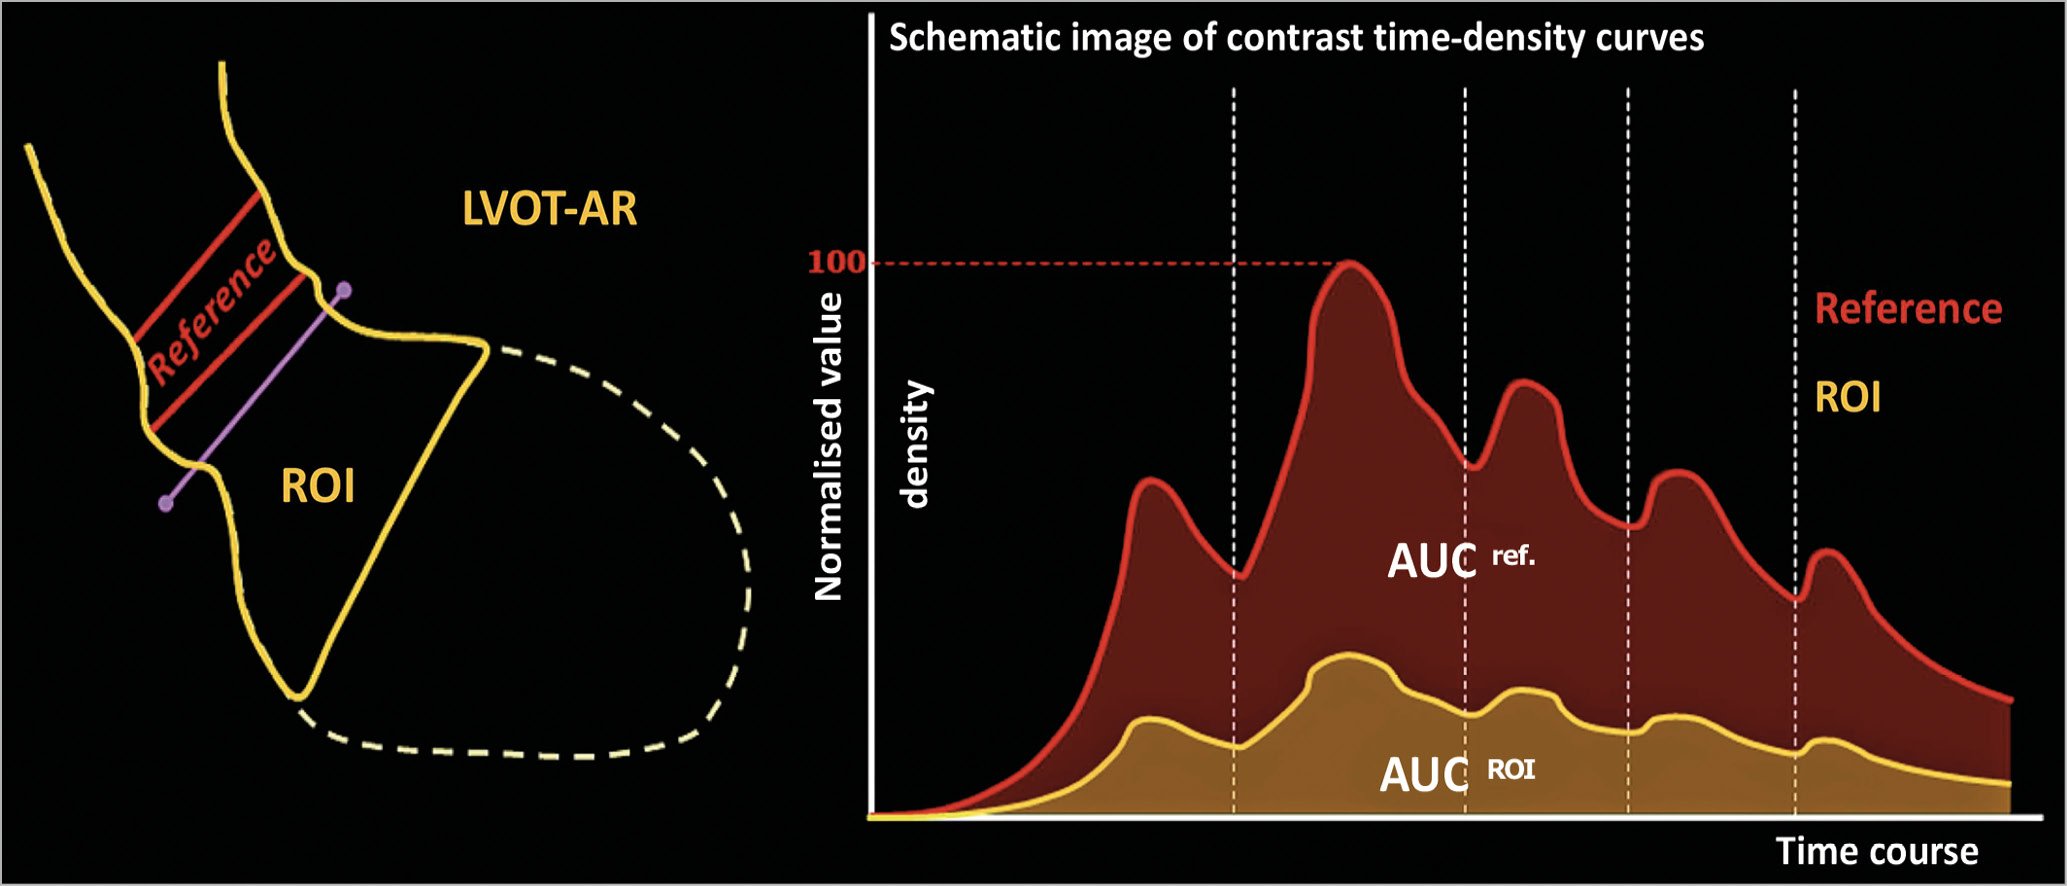
Figure 1. Schematic representation of the quantitative aortogram calculation of regurgitation with videodensitometry. On the left panel we can see the representation of the LVOT as the ROI in yellow and the aortic root as the reference in red. On the right panel two time-density curves constructed according to the increase in density (y-axis) for the reference area (red) and the ROI (yellow). The ratio of the area under both curves represents the result of quantitative regurgitation (LVOT-AR). AUC: area under the curve; LV: left ventricle; ROI: region of interest
MODERATE FEASIBILITY OF A RETROSPECTIVE ASSESSMENT
So far, retrospective assessment of regurgitation has been modest in previous reports: 57.14% in the Brazilian TAVI Registry14,16, 57.5% in the RESPOND study population10 and 57.41% at Yamaguchi University (prior to the prospective protocol of the Protocoled Quantitative ASSESSment of Aortic Regurgitation Using Videodensitometry in a Multicontinental Trial in Rotterdam, MontrEal, YamaGUchi, SegebeRG and AmstErdam [ASSESS-REGURGE] study)15.
PROCEDURAL PRE-PLANNING
The major issue impacting on the feasibility of LVOT-AR assessment is the overlapping of the descending aorta with either the ROI (LVOT) or the reference area (aortic root). The software analyses the density changes over time in both these regions, thus any other change in density provoked by contrast passing through the descending aorta overlapping with these regions would impact on the final result (Figure 2). Although the analyses are still technically possible in these situations, the results would not reflect the true regurgitation; therefore, they are considered non-analysable cases. The projection planning for the final aortogram acquisition in ASSESS-REGURGE was made based on either CT three-dimensional reconstruction of the aorta and LVOT, or simply on visual assessment, as previously described for this purpose17 – the so-called Teng’s rule. The imaging software for planning was as follows: Yamaguchi and Rotterdam used 3mensio Structural Heart (Pie Medical Imaging, Maastricht, the Netherlands), Amsterdam used the HeartNavigator (Philips Healthcare, Best, the Netherlands) and Montreal used the cvi42 software (Circle Cardiovascular Imaging Inc., Calgary, Canada). Briefly, before starting the procedure, the operators or technicians performed a reconstruction of the aorta and LVOT to plan the best projection to avoid overlapping of dense structures (Moving image 2). The Bad Segeberg investigators based their projection decisions on Teng’s rule.
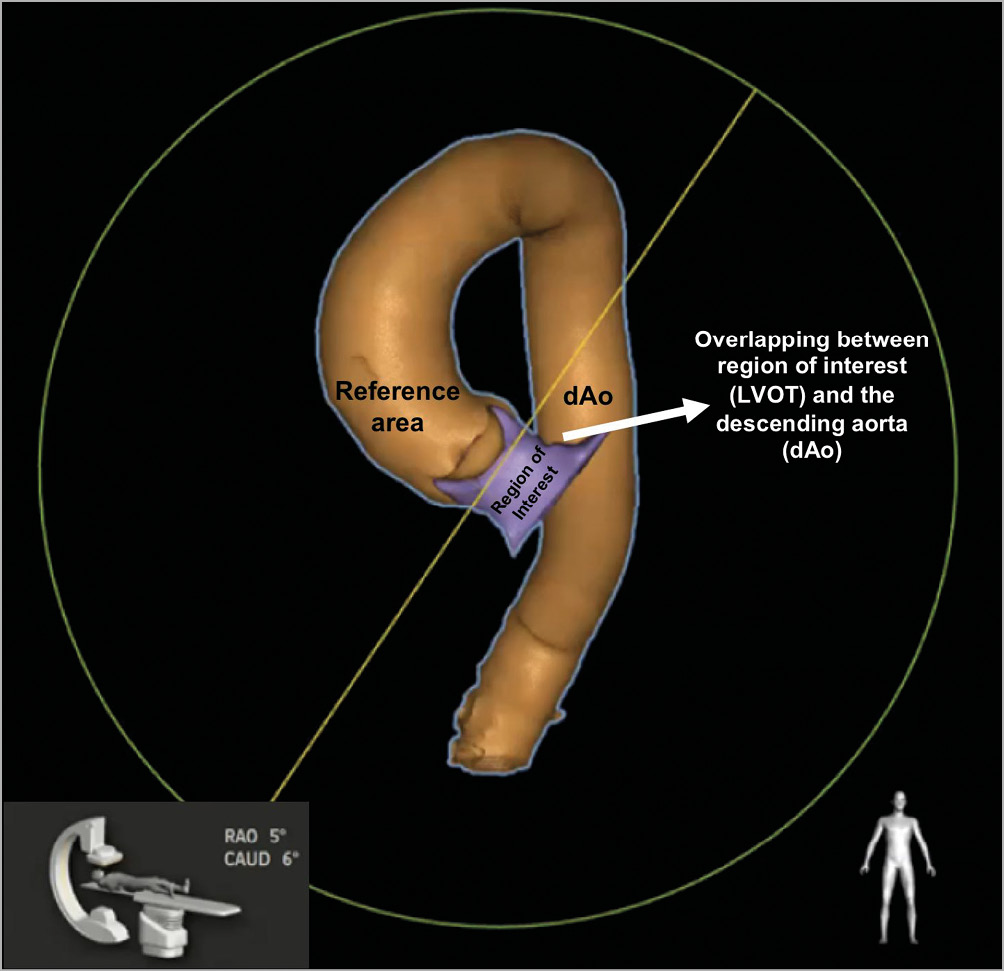
Figure 2. Three-dimensional CT reconstruction of the aorta (ascending and descending – in orange) and the LVOT (purple). In this image we can see the location of the reference area (aortic root) and of the ROI (LVOT). In the left corner is a demonstration of the C-arm position and the angulation and rotation for this image acquisition during angiography. In this particular case, there is overlapping of the ROI with the descending aorta, thus making this projection unfeasible for a proper evaluation of LVOT-AR. CAUD: caudal; dAo: descending aorta; LVOT: left ventricle outflow tract; RAO: right anterior oblique; ROI: region of interest. Modified from the presentation by Sahyoun at EuroPCR 2017, Paris, France. Image courtesy of Dr Cherif Sahyoun.
ENDPOINTS AND DEFINITIONS
The primary endpoint of the present analysis was the feasibility of analysis (percentage of analysable images) assessed by the core lab (Cardialysis, Rotterdam, the Netherlands). Secondary endpoints comprised: (i) the comparison of feasibility in previous studies with the rate of analysability in ASSESS-REGURGE, and (ii) differences of feasibility of analysis between visual and CT planning of image acquisition projections.
STATISTICAL ANALYSIS
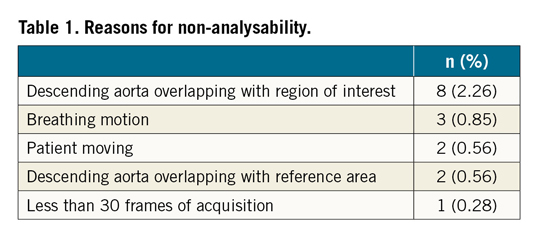
All analyses were performed in the entire population with pre-planned image acquisition in an intention-to-treat fashion. Aortograms of consecutive patients were evaluated by the core laboratory for feasibility, taking into account the reasons for non-analysability provided in Supplementary Table 2. The primary endpoint was calculated as a percentage of analysable quantitative aortograms. Confidence intervals were determined by simple bootstrapping for 1,000 samples. Comparison between feasibility rates (of the present cohort and of the previous RESPOND study population, and among different planning strategies) was performed with the chi-square test or Fisher’s exact test, as appropriate. Data are presented as percentages and 95% confidence intervals. A two-sided p-value of 0.05 was considered indicative of statistical significance. All statistical analyses were performed with SPSS software, Version 22.0 (IBM Corp., Armonk, NY, USA).
Results
QUANTITATIVE AORTOGRAM POPULATION
Of the five participating centres, one centre (Amsterdam) was simultaneously enrolling patients in the OVAL (Online Video-densitometric Assessment of Aortic Regurgitation in the Cath-Lab) project. The OVAL project consists of on-line assessment of quantitative aortograms. Since in this centre the assessment is on-line, a new acquisition could be made if the first one was not performed properly, thus reaching a virtual feasibility of 100%. Therefore, the investigators opted to exclude Amsterdam from the main analysis of ASSESS-REGURGE in order to identify the true feasibility by pre-planning. A total of 354 consecutive TAVI procedures were performed in the four recruiting centres in a median period of 12 months. The totality of aortograms (354) were evaluated for feasibility by the core lab (Supplementary Table 1). The aortic bioprostheses implanted in the procedures are shown in Figure 3 – the majority were contemporary valves (Evolut™ R [Medtronic, Minneapolis, MN, USA]: 38.4% and SAPIEN 3 [Edwards -Lifesciences, Irvine, CA, USA]: 36.4%).
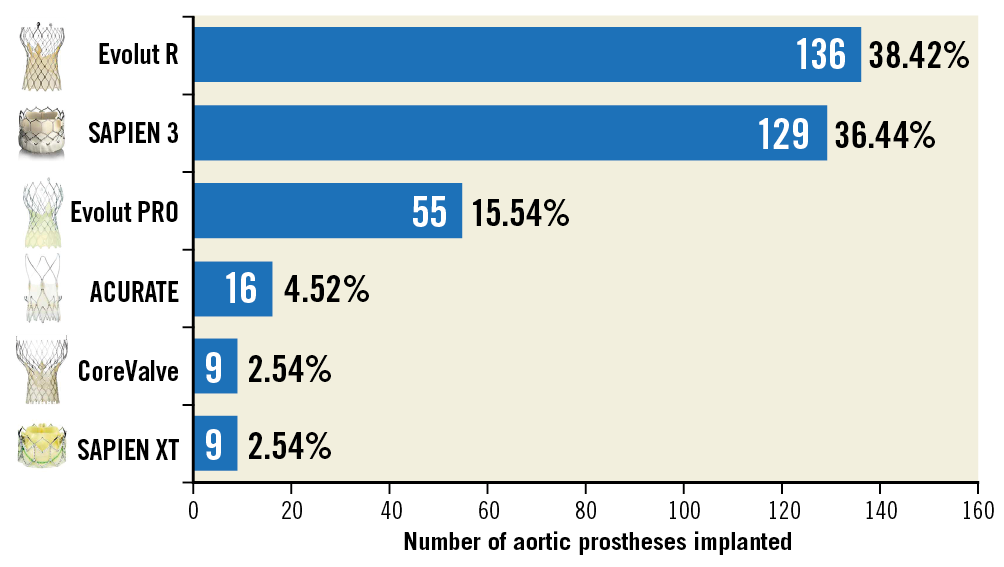
Figure 3. Number of different types of aortic bioprosthesis implanted in the patients of ASSESS-REGURGE.
PRIMARY ENDPOINT – FEASIBILITY OF ANALYSES
The quantitative aortogram analyses were feasible in 338 patients, corresponding to 95.5% (95% CI: 93.2% to 97.5%). The reasons for non-analysability are shown in Table 1. The most common causes of non-analysability of the images were overlapping of the descending aorta with the ROI (LVOT) and with the reference area (aortic root) (Figure 2).
SECONDARY ENDPOINTS
The comparison between ASSESS-REGURGE feasibility and that observed by the same core laboratory in the retrospective analysis of the RESPOND study10,19 showed significantly higher feasibility in ASSESS-REGURGE (95.5% vs. 57.5%, p<0.0001) (Figure 4). The previous feasibility assessment in RESPOND is shown in detail in Supplementary Figure 1.
When comparing feasibility between the different methods of pre-planning (CT vs. Teng’s rule), there was no significant difference (Figure 5). The overall median LVOT-AR result was 7.5% (interquartile range from 3% to 12%) (Figure 6). Detailed results of LVOT-AR per valve implanted are shown in Supplementary Table 3 and Supplementary Figure 2.
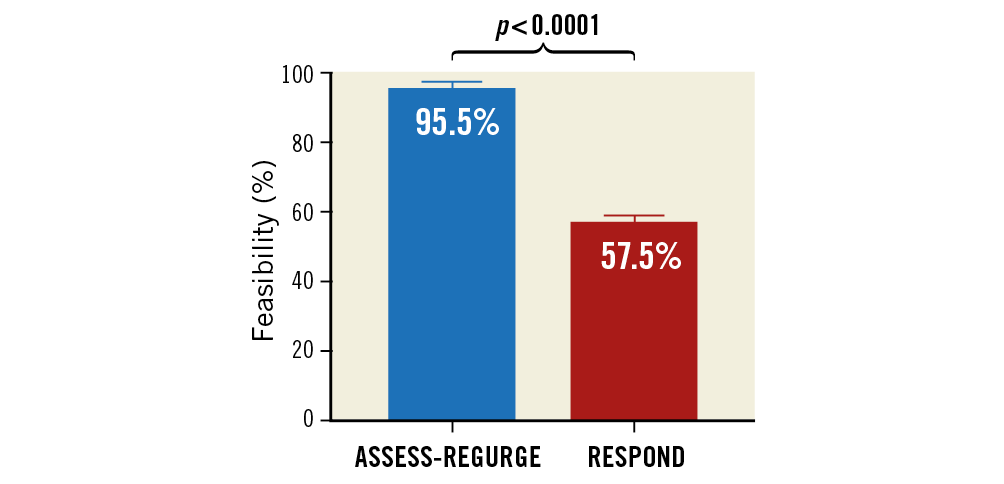
Figure 4. Comparison of feasibility of analysis using quantitative aortography in ASSESS-REGURGE (blue bar) and in RESPOND (red bar).
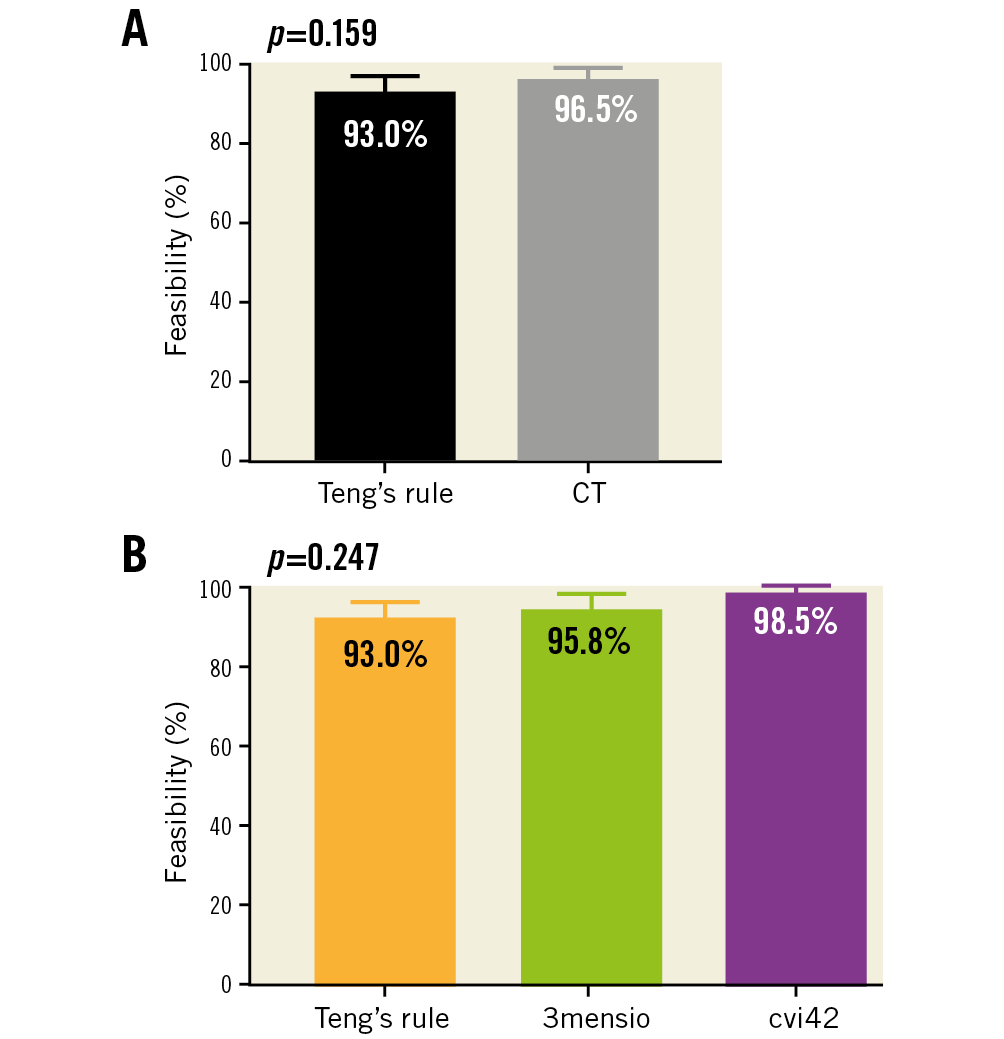
Figure 5. Comparison of feasibility of analysis using quantitative aortography in ASSESS-REGURGE with regard to different planning strategies. A) Comparison of planning with CT versus visual planning (Teng’s rule). B) Comparison among the different CT software and Teng’s rule. CT: computed tomography
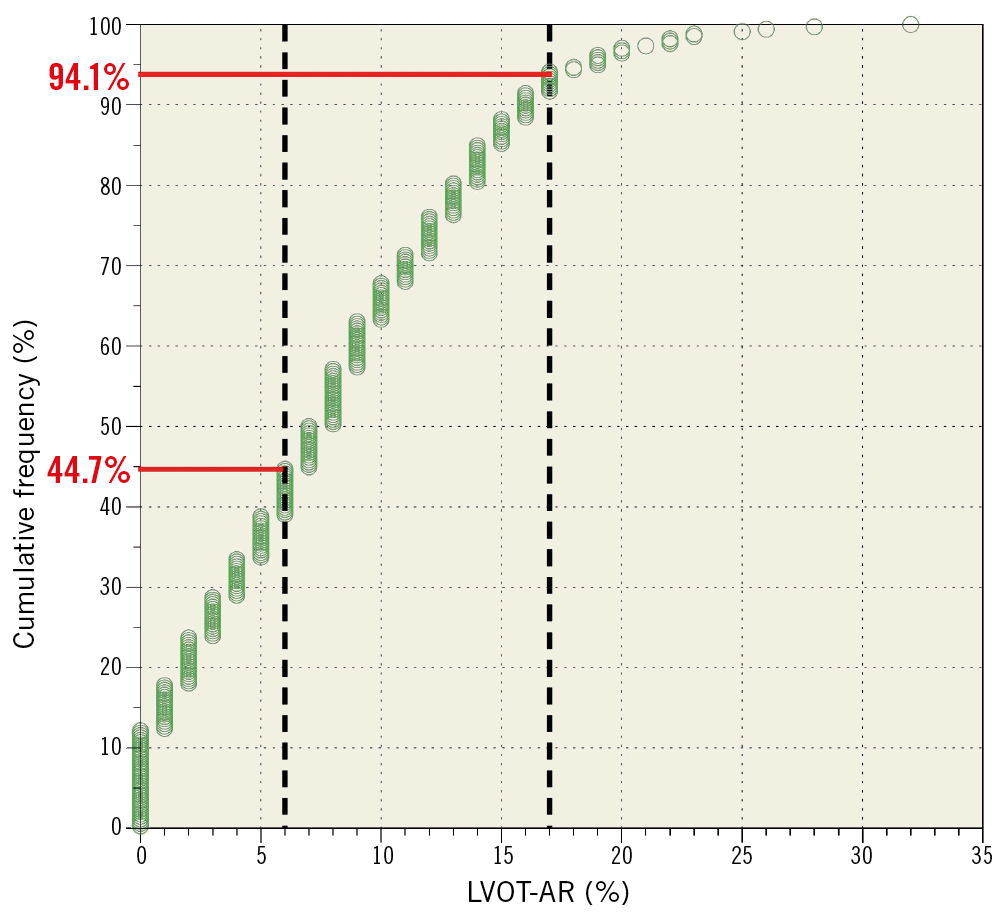
Figure 6. Cumulative frequency curve of the quantitative aortography results in ASSESS-REGURGE. The dotted black vertical lines delimit the transition from trace to mild regurgitation (6%)10 and from mild to moderate regurgitation (17%)16.
Discussion
The main finding of the present study is the high feasibility of prospective quantitative assessment of regurgitation with aortography by applying a protocol for image acquisition (based either on computed tomography or on visual estimation). Secondary findings are the similar high feasibility with the use of different methods for planning the acquisition images.
Recently, two major trials have shown that TAVI could be considered the preferred strategy for treating symptomatic aortic stenosis patients even those with low surgical risk (STS <4%)1,2. This swift expansion of indication will increase the number of TAVI procedures around the globe. The evolution and consolidation of the minimalist approach for TAVI (without general anaesthesia, thus restricting the use of intraprocedural transoesophageal echocardiography) beget simplification – without prejudice to efficacy – of paravalvular leak assessment after valve implantation. This simplified approach is the rationale and foundation of quantitative aortography in TAVI procedures, which was shown in the present study to be highly feasible after pre-planning of final aortogram acquisition.
Preprocedural imaging planning for TAVI has significantly improved over the last decade. Currently, multidetector CT is considered the “gold standard” imaging assessment pre-TAVI, not only to evaluate the aortic valve, aorta and surrounding structures, but also to judge the possible vascular access routes4 and the severity of a concomitant coronary artery disease. Therefore, its use for planning the best projection for aortogram acquisition with the purpose of applying the quantitative aortogram would not add additional technology to the standardised approach to TAVI. From our findings it may be inferred that a simple visual estimation of projection proposed by Teng would suffice, if pre-planning with CT is not possible.
With regard to the ordinal assessment of regurgitation, even mild amounts of paravalvular regurgitation are associated with poor outcomes and higher mortality20,21. Therefore, a more granular approach, such as the quantitative method given in percentage of regurgitant fraction, can be of great assistance for the clinician and for decision making within the procedure.
Not only anatomical aspects contribute to the non-analysability of LVOT-AR but, for example, breathing motion and table/patient movement have great impact on the feasibility of analysis (Supplementary Table 2, Supplementary Figure 1). Nonetheless, this is a characteristic of time-density analysis, since motion and overlap were the most common technical exclusions for calculating the time-density curves of myocardial blush in the TAPAS trial22, similar to the observation made in the present study.
Currently, clinical trials evaluating aortic bioprostheses for TAVI use echocardiography to determine the degree of paravalvular regurgitation. However, it has already been shown that this method is only moderately reproducible. A recent study showed that a consortium of echocardiography core laboratory directors had a weak agreement with the core lab for the PARTNER trial using the four-class scale (weighted k statistic=0.481) and using the seven-class scale for PVL grading (weighted k statistic=0.517)23. Thus, with the development and constant release of newer commercially available devices for TAVI, a more reproducible method for PVL assessment and comparison – such as quantitative aortography – is needed. In addition, newer and improved models of aortic bioprostheses exist with a very low incidence of moderate/severe PVL 30 days after TAVI1,2. However, the prognostic impact of mild regurgitation assessed by echocardiography present in a great number of patients is still a matter of debate and uncertainty. Thus, a more discriminative approach for assessing regurgitation as a continuous variable, i.e., a method that can within a low stratum of regurgitation (mild) be more discriminant using a quantitative continuous measurement, is essential.
In the present report, the parameters of contrast injection, such as contrast media volume and rate of injection, were left to the discretion of the operators. Nonetheless, our endpoint was the feasibility of the assessment, not the quantitative regurgitation itself. In addition, LVOT-AR is a relative measurement based on a ratio of densitometry; it has been demonstrated in vitro that a low contrast volume injection (median of 8.1 mL) has a substantial correlation to quantitative regurgitation results when compared with a high contrast volume injection (median of 19.4 mL), with a Spearman’s rho ranging from 0.968 to 0.99118. Thus, the difference in injection parameters would not interfere with the results. Nevertheless, for the purpose of a clinical trial comparing PVL of different devices, a standardised injection would be preferred.
The feasibility of analysis was demonstrated to be high. Nonetheless, the accuracy of regurgitation assessment was not tested in this study. The accuracy of analysis has already been demonstrated previously in vitro and in a clinical setting, evaluating quantitative aortograms with respect to echocardiography (both transoesophageal and transthoracic) and magnetic resonance9,10,11,12,13. Permanent radiopaque structures, such as mitral annulus calcification, presence of calcium at the LVOT and pacemaker catheter, are digitally subtracted in every frame and only the relative change in videodensity due to the angiography contrast medium is quantified, thus not interfering with LVOT-AR results. Further study is currently being performed to evaluate the mismatch between the aorta and left ventricle (i.e., large LVOT with narrow ascending aorta or dilated aortic root with small LVOT), since theoretical calculation could not unequivocally resolve the issue.
Limitations
Some limitations must be acknowledged. First, this is a single-arm registry, not randomising patients for the protocoled versus non-planning strategy; the feasibility was thus compared with a historical cohort of quantitative aortogram feasibility. Second, although the purpose of the current study was to assess feasibility of assessment, it is still performed outside the cath lab, by a core laboratory. Data with on-line assessment (within the procedure) are needed and are expected with the report of the OVAL study, anticipated before the end of 2019. Nonetheless, the feasibility of on-line assessment is assumed to be even higher, once the inappropriateness of the acquisition can be immediately perceived and a prompt second improved acquisition can be made. A limitation of the method is that, although quantitative and validated, it does not differentiate between valvular and paravalvular regurgitation, which can impact on the corrective measure. However, significant transvalvular aortic regurgitation post TAVI is 10 times less frequent than significant PVL24 in first-generation valves and absent in a contemporary TAVI trial1.
Conclusions
Quantitative aortogram analysis using the videodensitometry technique has a high feasibility of analysis after implementation of an image acquisition protocol. This high feasibility is independent of the strategy used to plan the image acquisition, being either with prior computed tomography or with a simple periprocedural visual assessment (Teng’s rule). These results may pave the way for adequate protocols for clinical practice and also for TAVI clinical trials, in order to obtain quantitative assessment of regurgitation.
|
Impact on daily practice With the increase in TAVI indications and the adoption of the minimalist approach, an objective, periprocedural, practical and reproducible assessment of regurgitation post valve implantation becomes clinically relevant. Prospectively, after implementation of an acquisition protocol, quantitative aortography was shown to have high feasibility of assessment, making this method a good tool for assessment in clinical practice and also in clinical trials of TAVI, comparing regurgitation among the devices in an objective way. |
Guest Editor
This paper was guest edited by Alec Vahanian, MD, PhD; Department of Cardiology, Hôpital Bichat, and University Paris VII, Paris, France.
Conflict of interest statement
R. Modolo received a research grant from the Sao Paulo Research Foundation (FAPESP – grant number 2017/22013-8). P.W. Serruys reports personal fees from Abbott, Biosensors, Cardialysis, Heartflow, Medtronic, Sinomed, Société Europa Digital & Publishing, Philips/Volcano, St. Jude Medical, Qualimed, and Xeltis, outside the submitted work. N. Piazza has served as a consultant to HighLife, MicroPort, Boston Scientific, and Medtronic. Y. Onuma is an advisory board member of Abbott Vascular. The other authors have no conflicts of interest to declare. The Guest Editor is a consultant for Edwards Lifesciences.
Supplementary data
To read the full content of this article, please download the PDF.
Moving image 1. Example of LVOT-AR with colour-coded ROI.
Moving image 2. Use of CT 3D reconstruction to plan the best projection to avoid overlap of the ROI (LVOT) and aortic root with the descending aorta. The LVOT is seen in purple and the rotation and angulation can be seen in the left bottom corner of the image.