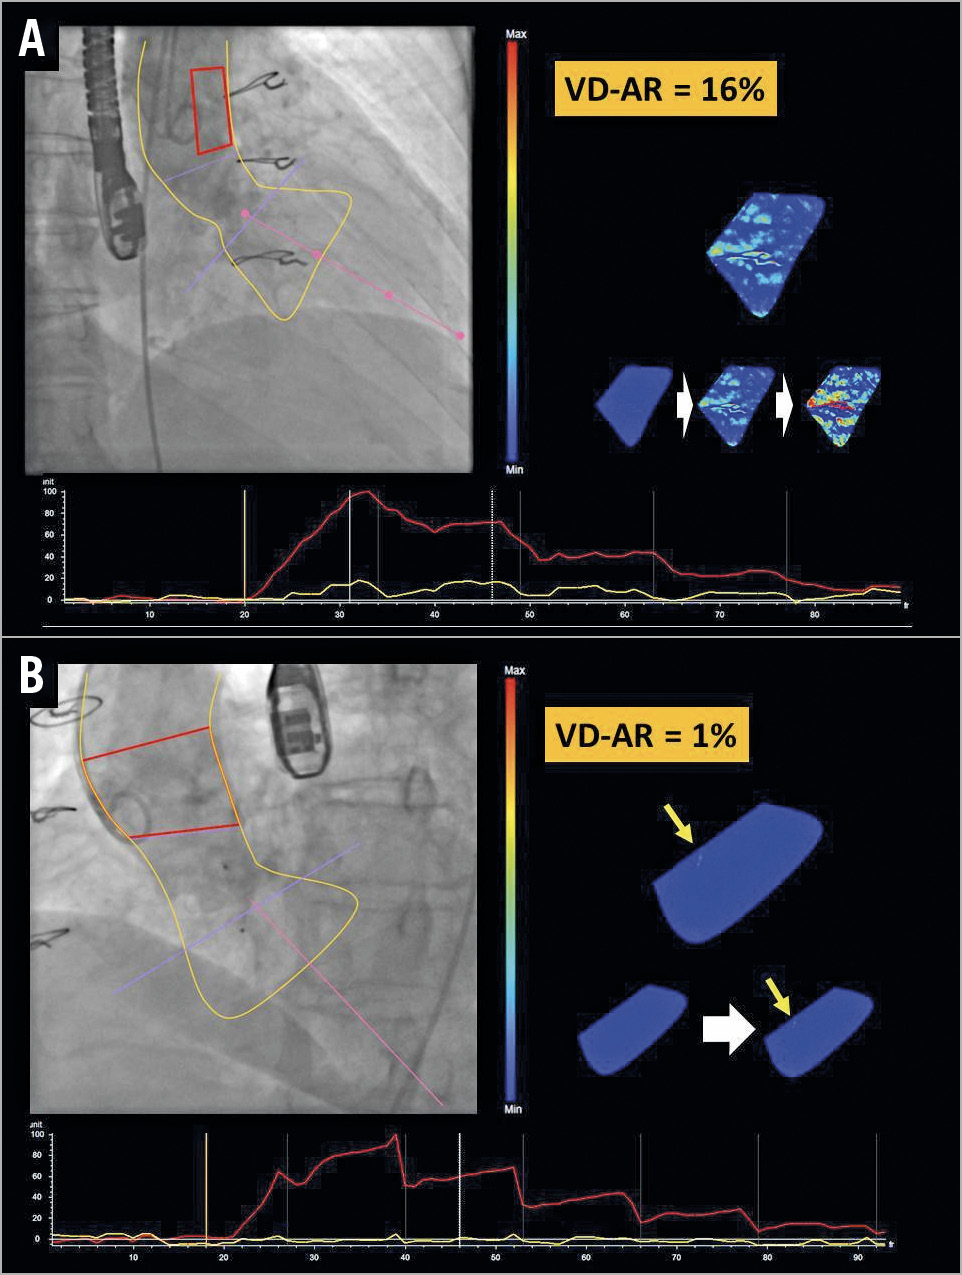
Figure 1. Pre-procedure (A) and post-procedure (B) aortograms and videodensitometry assessment of regurgitation. The right panels show the colour-coded left ventricular outflow tract (LVOT) with the representation of the regurgitating contrast. Underneath are the time-density curves of the aortic root (red curve) and LVOT (yellow curve). The ratio of these curves represents the result of VD-AR assessment in percentage form. The yellow arrows in panel B show the residual central small regurgitation after closure of the PVL.
Quantitative assessment of regurgitation with videodensitometry is a well validated tool in the setting of transcatheter aortic valve implantation (TAVI). It has been validated in vivo and in vitro. It has also been compared with echocardiography and cardiac magnetic resonance with good correlation1,2; currently, it is being studied for mitral interventions. However, its applicability has never been tested in the setting of aortic interventions other than TAVI. We sought to determine the feasibility of using this technique to assess the amount of paravalvular leakage (PVL) through a surgically implanted aortic valve pre and post percutaneous closure of the PVL.
We retrospectively assessed the aortograms performed prior to and immediately after a procedure of PVL tunnel closure. The procedure was performed in a 70-year-old woman who had a 15-year-old surgically implanted bioprosthesis (Biocor®, 23 mm; St. Jude Medical, St. Paul, MN, USA) in the aortic position. She had progressive heart failure (NYHA Class III) due to a severe PVL diagnosed at clinical follow-up by transthoracic echocardiography. Briefly, an 8 mm AMPLATZER™ Vascular Plug II (St. Jude Medical) was successfully placed with no residual shunt detected by transoesophageal echocardiography after the procedure.
Quantitative assessment of the PVL was performed using the videodensitometry technique with the CAAS A-valve 2.0.2 software (Pie Medical Imaging, Maastricht, the Netherlands). The results of the assessment prior to and immediately after the procedure are shown in Figure 1A and Figure 1B. The regurgitation was 16% and fell drastically to 1% after the procedure, showing the success of the percutaneous closure. Interestingly, after the implant of the plug, the paravalvular leak disappeared and a small central regurgitation was perceived on videodensitometry (yellow arrow, Figure 1B). Quantitative assessment of aortic regurgitation is a practical tool and its use in aortic valve interventions other than TAVI might be feasible, as shown, providing a quantitative result of regurgitation.
Acknowledgement
We thank Luiz Antonio Gubolino and Maximiliano Otero Lacoste for their technical support, conception and performance of transoesophageal echocardiograms.
Guest Editor
This paper was guest edited by Alec Vahanian, MD, PhD; Department of Cardiology, Hôpital Bichat-Claude Bernard, and University Paris VII, Paris, France.
Conflict of interest statement
P.W. Serruys reports personal fees from Abbott Laboratories, AstraZeneca, Biotronik, Cardialysis, GLG Research, Medtronic, Sino Medical Sciences Technology, Société Europa Digital & Publishing, Stentys France, Svelte Medical Systems, Philips/Volcano, St. Jude Medical, Qualimed, and Xeltis, outside the submitted work. The other authors have no conflicts of interest to declare. The Guest Editor is a consultant for Edwards Lifesciences.
Supplementary data
To read the full content of this article, please download the PDF.