Abstract
Aims: The composition of CTO lesions changes significantly as they age. These changes may adversely affect PCI outcome. We present a robust ex vivo technique to measure the force required to puncture the proximal cap of CTOs, and to determine whether the puncture force differs according occlusion age to examine the effects of compositional changes over time on lesion stiffness.
Methods and results: Occlusions were created in 44 rabbit femoral arteries by thrombin injection. Between two and 15 weeks following induction, vessels were harvested and tested in a custom setup to determine the force required to puncture the proximal cap. The puncture force mean values at 2, 6, 12, and 15 weeks were 0.61N, 0.78N, 1.21N and 1.52N, respectively. The puncture force required in occlusions of ≤6 weeks was significantly lower those ≥12 weeks (0.72±0.10N versus 1.45±0.13N, p<0.01). Using a cutoff point of 1N, 86% of lesions ≤6 weeks of age required <1N compared to 30% of those ≥12 weeks.
Conclusions: We have shown an objective and reproducible testing system for measuring CTO puncture force. Puncture force is correlated with occlusion age. This technique would be useful to evaluate therapies that alter CTO composition/compliance, as well as guidewire testing.
Introduction
Chronic total occlusions (CTOs), defined as arteries with TIMI (Thrombolysis In Myocardial Infarction) 0 or 1 flow that have been known to have been completely occluded for ≥6 weeks duration1,2, represent a major challenge for revascularisation by percutaneous coronary interventions (PCI) due primarily to two problems: 1) difficulties in navigation due to inadequate visualisation and 2) inability to physically cross the lesions with currently available equipment, including guidewires and crossing devices. There are numerous obstacles preventing successful navigation of guidewires due to the heterogeneous composition of CTOs3.
Advancing age of the CTO has long been recognised as an important predictor of failure to cross the CTO with a guidewire during PCI4. Early occlusions (<6 weeks old) tend to contain thrombus, proteoglycans and/or lipid-rich tissue, which are easier to cross with softer guidewires5. However, as lesions age, the softer components are replaced by dense fibrous tissue and calcification, and consequently are much more difficult to cross. This necessitates the use of stiffer specialty guidewires and crossing devices, which results in an increase in complication rates due to dissections and even vessel perforation.
Recently we reported on the compositional changes occurring during maturation of a rabbit model of CTOs6. This study showed that collagen-rich fibrotic tissue increases with age of the CTO and replaces tissue containing predominantly proteoglycans and thrombus remnants that predominate at early stages of occlusions. In addition, we also identified a specific geographic site at the entrance of the CTO where a particularly densely-packed type of collagen is deposited. This location, known as the proximal fibrous cap (PFC), has long been recognised as a major barrier to guidewire crossing in clinical angioplasty, although the exact physical structure had not previously been shown.
To further understand the physical properties of the lesions that would affect the ability of guidewires to successfully cross the CTO, we have developed a novel methodology to reproducibly quantify the force required to puncture the fibrous cap in an ex vivo setting. This measurement can be used to further characterise CTO age and composition and could conceivably provide important information to assess therapies to enhance guidewire crossing in percutaneous interventions of CTOs.
Materials and methods
All animal care and handling were performed in accordance with the guidelines specified by the Canadian Council on Animal Care (CCAC) for the Care and Use of Laboratory Animals and were approved by the Institutional Animal Care and Use Committee.
CTO model
Animal experiments conformed to the “Position of the American Heart Association on Research Animal Use”. Approval for experiments was obtained from St Michael’s and Sunnybrook Hospital Animal Care Committees. Arterial occlusions were created and successfully tested in 44 arteries from 31 male New Zealand white rabbits (Charles River Canada, St Constant, Quebec, Canada) weighing 3.0 to 3.5 kg, by injection of thrombin solution (100 IU, Millipore catalogue # 82-036-3, Kankakee, IL, USA) into an isolated femoral artery segment, as previously described6,7. Ligatures were maintained up to 60 minutes to ensure a persistent occlusion. Animals were then returned to their cages and fed a regular diet. Animals were sacrificed at 2, 6, 12 or 15 weeks [n=6, 8, 7, 23, respectively] following creation of the CTO. Presence of occlusions was verified sonographically at two weeks.
Removal of CTO for ex vivo testing
Prior to sacrifice, animals were anaesthetised and an angiogram was performed to verify persistence of the occlusion, and to assess lesion location and characteristics. To assist mounting of the arterial segment on the apparatus (see below), a balloon-mounted stent was deployed in the patent artery immediately adjacent to the proximal end of the CTO. Following sacrifice with euthanyl, the CTO vessel was carefully excised with the stent in place for proper positioning in the apparatus (see below). The vessel was kept in 0.9% saline and immediately used for puncture force testing.
Puncture force testing
In order to give a reliable measurement of the PFC puncture force, a custom setup was built (Figures 1 and 2).
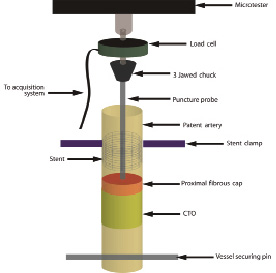
Figure 1. Puncture force measurement setup schematic. The stent at the proximal end is clamped and the vessel is secured at the distal end using the vessel securing pin. The puncture probe is placed just above the proximal fibrous cap and clamped into the 3 jawed chuck. The microtester arm is slowly lowered such that the probe advances into the PFC. As the probe moves into the cap, the force pushing back increases until the PFC is punctured, at which point the force drops precipitously. The force-displacement information is read from the load cell and stored electronically.
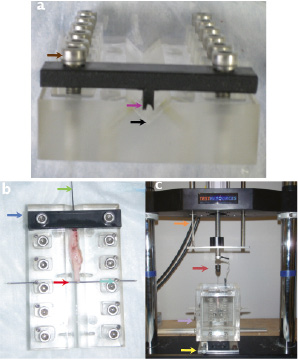
Figure 2. Photographs of the puncture test setup. Panel a) shows a front view of the sample holder. The V-shaped groove where the vessel is placed is shown (black arrow). The stent is held using the stent clamp (magenta arrow). The clamp is tightened using the clamp adjustment screws (brown arrow). Panel b) shows a photograph of the specimen holder from a top view. The vessel is laid flat in the V-groove and the stent is clamped (blue arrow). A 20G needle is used to hold the tautly pulled vessel (red arrow) and secured with set screws (turquoise arrow). The puncture needle is gently placed into the stent (green arrow). Panel c) shows a photograph of the entire setup. The microtester arm (orange arrow) is lowered slowly so that the probe assembly (maroon arrow) is advanced into the vessel held in the fluid tank (purple arrow). Position is controlled by 2 axis stage (yellow arrow).
The sample was laid flat in a V-shaped channel running throughout the length of the sample holder. The stent was carefully clamped at the proximal end using a custom machined holder, as shown in Figure 2. The vessel was gently stretched to approximate in situ vessel length and to ensure that the stent remained secure in the clamp. The distal end of the vessel was secured by a 20G needle that ensured that the vessel was kept taut. The puncture probe was then carefully advanced through the patent portion of the artery that contained the stent until it reached the site of the proximal entrance of the occlusion. The probe used was the inner mandrel from an 18G spinal needle and was chosen for the rigidity of its shaft, its ease of use, and its ability to enter the tapered entrance of the CTO due to its bevelled profile (Figure 3).
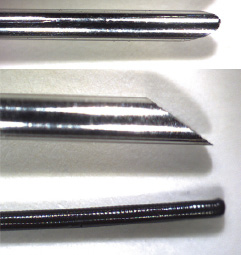
Figure 3. PFC puncture probe and guidewire. The probe used to puncture the PFC is shown in two views (top and middle) next to a 0.014» guidewire. The bevel cut probe is of similar profile to a 0.014» guidewire (bottom) in one plane, while remaining completely rigid along the shaft.
The probe had an outer diameter of 700 µm along the shaft, which was tapered to approximately 100 µm at the distal tip.
The sample holder was then mounted into a fluid chamber filled with saline heated to 37°C. The chamber was attached to a servo-electric uniaxial materials testing system The microtester used was Model #800LE (TestResources Inc., Shakopee, MN, USA) with a 25N load cell Model #WMC-5F (TestResources Inc., Shakopee, MN, USA) with a high degree of positional accuracy, load sensitivity and motion control. The sample container was positioned on the 800LE system using a 2-axis stage, which was used to position the vessel directly below the linear actuator to ensure direct vertical motion of the probe with respect to the specimen. The probe was attached to the actuator via a 3- jawed chuck so that the probe tip was located just above and not in contact with the PFC. The load cell was zeroed in this position to account for the weight of the chuck and the clamped puncture probe.
The actuator was lowered in displacement control at a constant rate of 0.05 mm/s into the occlusion. The rate was chosen such that it was lower than the slowest rate seen in literature8 to ensure adequate time for tissue to respond to probe displacement. As the probe slowly advances into the occlusion, the load begins to increase as the vessel and proximal fibrous cap both begin to stretch. The load eventually reaches a peak value at maximal stretch, followed by a rapid drop-off when puncture has occurred. Load and displacement data is collected at a sampling rate of 4 Hz. A sample curve showing a punctured occlusion at the six week time point is presented in Figure 4. The first peak on the force-displacement curve is defined as the puncture point.
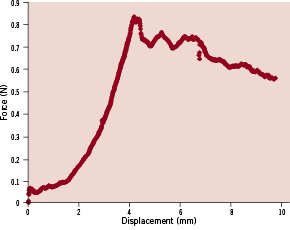
Figure 4. Sample force displacement curve of puncture from a six week old CTO. Force rises to peak prior to puncture (~0.85N), followed by drop off afterwards.
Histology
After the puncture test was completed, selected vessels were removed from the apparatus and processed for histology to determine the exact pathway taken by the probe. Samples were stored for two weeks in 10% formalin with the puncture probe embedded within the tissue to preserve the path of the probe. After careful removal of the probe, the vessel was embedded in paraffin for longitudinal sectioning. The blocks were serially cut at every 100 µm and every 4th slide was stained with Movat-pentachrome stain. If necessary, intermediate slides were also stained.
Statistics analysis
Data are expressed as mean±SEM. To compare the puncture forces at each time point, a two sample t-test was used. A p-value of less than 0.01 was considered to be statistically significant.
Results
The puncture test was successfully performed in 44 occlusions. A longitudinal histology section of a 12 week old punctured PFC is shown in Figure 5, showing the path of the puncture probe and the residual PFC.
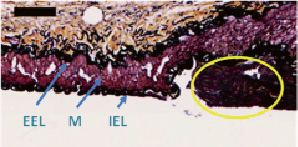
Figure 5. Longitudinal section of a punctured vessel stained with Movat pentachrome. The trajectory of the puncture probe is seen as the void in this longitudinal section of the proximal fibrous cap of a CTO. Residual PFC shown in yellow ellipse. IEL: internal elastic lamina; EEL: external elastic lamina; and M: media. Bar=100 µm.
In this longitudinal section, the disruption in the PFC can be seen as a void of equivalent size to the puncture probe due to the fact that the vessel was formalin fixed with the probe embedded. The layers of the artery are left intact (IEL, Media, and EEL), and residual PFC along the vessel wall can be seen. The PFC has been sheared off from the puncture and has fallen out during processing. In six cases, puncture data could not be used due to technical issues such as: stent deployment (side branch rather than main vessel in one case, incomplete stent deployment in one case, inadvertent crossing of soft occlusions with the guidewire during stent placement in two cases (at two weeks and at six weeks); misalignment of the puncture probe in one case (resulting in vessel wall perforation), and in one case, manual dissection of the vessel prior to puncture test caused damage distal to the stent. Data from these cases was excluded.
The mean puncture forces for early occlusive lesions (≤6 weeks) compared to late occlusions (≥12 weeks) is shown in Figure 6.
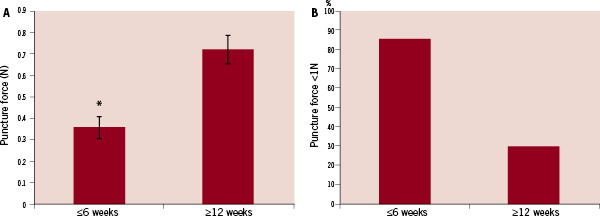
Figure 6. Summary of puncture force tests comparing early occlusive lesions (≤6 weeks) and later occlusions (≥12 weeks). Panel A) shows a comparison of mean puncture force values. There is a significant increase in the mean puncture force value at ≥12 week time points compared to early occlusions (≤6 weeks). Panel B) shows the percentage of lesions in each group with a puncture force below a cutoff of 1N. * -p<0.01 vs. ≥12 weeks.
There was a statistically significant increase in puncture force at the two later time points with a mean value of 1.45N compared to the early time points puncture force of 0.72N. When a cutpoint of 1N was used to represent the threshold between a “soft” lesion and a “stiff” lesion, we see that, 86% of the early time point lesions were below 1N, compared to only 30% from the late time points.
There was a trend of increasing puncture force with increasing occlusion age (Figure 7).
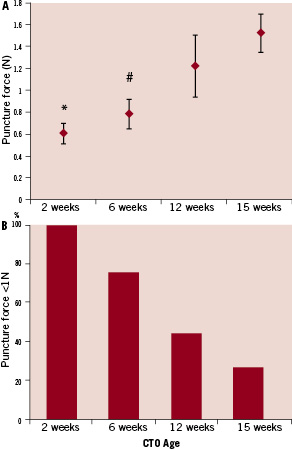
Figure 7. Mean puncture forces at different time points. Panel A) shows that there is a trend towards increasing puncture force with increasing age of the occlusion. Panel B) shows the percentage of lesions that require <1N of force for puncture at each time point.
* –p<0.001 vs 15 week. # –p<0.01 vs. 15 week.
A Spearman’s rank test shows a correlation factor of 0.55, indicating that there is a trend towards increasing puncture force with age. The mean values for puncture forces at 2, 6, 12, and 15 weeks were 0.61N, 0.78N, 1.21N and 1.52N, respectively. There was a statistically significant difference between the 2-week lesions and 15-week lesions, as well as between the 6-week lesions and 15-week lesions. Using a cutoff point of 1N to delineate stiff lesions from soft lesions, there were significant differences in samples below the 1N value as follows: 100% at two weeks, 75% at six weeks, 43% at 12 weeks and 26% at 15 weeks.
Discussion
There are two important observations in this study. First, we have shown the utility of a systematic, reliable technique to quantify the force required to puncture the proximal fibrous cap of CTOs in an ex vivo setting. Second, the results indicate that there are significant differences in the amount of force required to puncture CTOs of different ages, which corresponds to previously published differences in occlusion composition. Specifically the force required to puncture the proximal fibrous cap increases significantly in response to occlusion age.
It has been shown in several biologic systems that a burst or puncture point can be determined by examining a force-displacement curve. Schober et al8 studied the force-displacement curve in a burst testing setup to show the relationship between the use of different probe profiles and discussed the interpretation of the force-displacement curve while examining foetal membranes. Saito et al9 studied the use of a needle setup to automate needle puncture in rabbit ear veins for blood sampling.
The data clearly shows for the first time that there is an increase in the amount of force required to puncture occlusions according to the occlusion age. Specifically, this change in puncture force was apparent as CTO age increased from six weeks to 12 weeks. Both lower time points (two weeks and six weeks) had similar values, although it was previously shown that there are differences in composition at these time points. The two week time point still contains mainly thrombotic tissue with some proteoglycan-rich areas present within the occlusion. These substances are known to be soft, which is confirmed by the low puncture force. At six weeks, the microvessel pattern is at its peak, and the tissue still contains large amounts of proteoglycan-rich material with very small amounts of collagen present within the CTO. However at 12 weeks and beyond, there is a marked involution of the microvascular network within the CTO, accompanied by increases in collagen and regression of the proteoglycan material. Thus, the 12-week-old CTO (and later time points) are characterised by avascular, fibrotic tissue, particularly at the proximal fibrous cap. This is also precisely the time period where success rates in crossing the CTO have been shown to precipitously decline. With this new technique to measure puncture force, we now have a mechanical correlate to the histologic changes previously described in this model. This technique provides an objective means to quantify the difficulty in crossing CTOs and potentially an assay to assess interventions to alter the CTO composition. In our model, it appears that 1N is an appropriate cut-off point to distinguish between soft early stage occlusions and the harder later time points, although this will require further validation in future studies. Further studies are required to determine whether interventions can alter the puncture forces in older CTOs and whether, calcification, which is not characteristic of this model, would substantially increase the puncture force.
Although this technique appears to be a very promising tool for CTO research, there are still some caveats. The degree of variation at each time point is one issue. There are several possible explanations. First, there is the possibility of heterogeneity either due to the composition or the morphology of the lesions. It has been shown that most lesions in this model of CTO have a tapered entrance to the CTO and the angle of entry may play a role in the resultant puncture force. Secondly, there may be some variability in the rate at which fibrosis develops, such that some lesions develop a fibrous cap much earlier than others. Furthermore, it has been suggested10 that the presence of longitudinal micro channels may provide a path for guidewire crossing. This could be due to providing a direct path through the lesion (in very large micro channels), or that perivascular tissues adjacent to the micro channel would be more compliant than those in the fibrotic areas. In both instances, this could provide a softer path across the entrance of the CTO instead of the stiff proximal fibrous cap. This would imply that it may be more useful to classify lesion-crossing difficulty on the basis of composition and morphology and mechanical properties (such as puncture force) rather than on age alone. This will require further validation, particularly with in vivo diagnostic imaging and mechanical interrogation systems.
Potential applications
The ability to study the force-displacement curves and to determine both the forces to puncture the proximal fibrous cap as well as the characteristics of the curves beyond that point for determining tissue compliance could be useful in a number of relevant applications. Since it is desirable to use conventional softer guidewires rather than stiffer specialty guidewires or crossing devices to cross a CTO, agents that could affect the compliance of CTOs, and particularly, the proximal fibrous cap, are under investigation. Strauss et al have had success using a localised delivery of collagenase to digest and soften the collagen rich proximal fibrous cap7,11. A second approach is to increase the vascular network at the proximal end of lesions by promoting the growth of microvasculature, which will in turn lead to increased crossability due to the proliferation of softer tissues and possible low resistance pathways. While the vascularity of a lesion can be assessed using imaging tools, the mechanical properties of increased vasculature on facilitating guidewire crossing cannot currently be directly measured using imaging techniques. In both of the above applications, the ability to measure puncture force allows for a simple and direct way to measure the efficacy of the treatments and required doses.
While the present study used a bevel cut needle as the puncture probe, any arbitrary probe that could be mounted into the 3-jawed chuck could be used. A future study of various guidewires with different tip profiles and compositions in a similar setup could prove useful in studying the interactions of different guidewires with not only the proximal fibrous cap, but also other geographic locations, including the body of the CTO and the distal fibrous cap. There also exists the possibility of coupling a guidewire in series with a load cell to measure puncture forces in an in vivo situation.
Conclusions
This study demonstrates a novel technique for quantitatively measuring the amount of force required to puncture the proximal fibrous cap of CTOs in a systematic, repeatable way. This technique provides the first objective evidence of the increased puncture forces required to cross the proximal fibrous cap with increasing occlusion age. This technique could be useful for assessment of therapeutic manipulations of CTOs such as collagenase. Moreover, it could be used to test the characteristics of various guidewires and their interactions with CTOs. Finally, it could be potentially adapted to provide in vivo assessment of crossing characteristics of the proximal fibrous cap during percutaneous interventions.