Abstract
Aims: To determine the relation between electromechanical endocardial mapping (EEM) and cardiac magnetic resonance (CMR) derived functional and viability parameters in patients with a large myocardial infarction.
Methods and results: Forty-two patients with a large ST-elevation myocardial infarction underwent both EEM and CMR four months after primary percutaneous coronary intervention. EEM was performed to assess linear local shortening (LLS), unipolar voltage (UV) and bipolar voltage (BV). CMR cine imaging was performed to determine left ventricular global volumes, ejection fraction and regional function. Late gadolinium enhancement was used to assess size and transmural extent of infarction. Average LLS, UV and BV differed significantly between normal and dysfunctional segments (9.8 vs. 7.3, 11.8 vs. 9.7 and 3.3 vs. 2.8 for LLS, UV and BV respectively; p<0.001 for LLS and UV, p=0.006 for BV). In addition, average LLS, UV and BV, differed significantly between non-, subendocardial and transmural enhanced segments (10.8 vs. 8.8 vs. 5.0, 12.3 vs. 10.5 vs. 9.5 and 3.5 vs. 3.0 vs. 2.3 for LLS, UV and BV, respectively, p<0.001 for all variables). Although regional EEM data showed reasonable correlation with CMR, specific cut-off values for EEM parameters could not be established.
Conclusions: EEM may be helpful in determining both the regional function and the transmural extent of infarction in patients with a large myocardial infarction. However, correlation with CMR parameters was moderate and exact cut-off values for EEM parameters could not be established. Further development of this potentially very useful modality is needed before it can be advocated for exact border-zone endocardial injection.
Introduction
Currently there is much innovation in the field of percutaneous strategies with progenitor cells, genes or pharmaceuticals being delivered directly in the heart in order to combat heart failure after primary PCI (PPCI) for ST-elevation myocardial infarction (STEMI)1-3.
Various routes and methods have been used for cell, gene or pharmaceutical delivery (e.g., intracoronary and retrograde coronary venous injection or direct intramyocardial injection by surgical or percutaneous approaches), each with their own potential benefits and disadvantages. At the present time, intracoronary administration is the most commonly applied method because of its minimally invasive characteristics. However, there are indications that intravascular injection (i.e., intracoronary) is associated with low rates of retention4. Since direct injection is only a reasonable option as adjuvant to cardiac surgery, the percutaneous route is the logical option for intramyocardial injection for all other patients. Direct injection with only fluoroscopic guidance would require unacceptably high doses of radiation and would not lead to an even distribution of cell injections. Commercially available non-fluoroscopic electromechanical endocardial mapping systems (EEM), that measure both wall motion and electrical activity, could aid the interventional cardiologist by providing online information regarding left ventricular (LV) function and viability without excessive radiation exposure. In addition, these systems can be fitted with dedicated (cell) injection catheters. This technique has proved to be safe and feasible both in the cell, and gene delivery setting1;5-7. It was hypothesised that besides facilitating delivery, the generated maps could provide information on both regional and global LV function as well as on viability, which can be used to monitor the potential effects of the applied therapy. Although previous studies have focused on the identification of viable myocardium with EEM8-12, only one study has validated the accuracy of EEM parameters to detect viable myocardium so far13, but this study has not validated functional EEM parameters.
The purpose of this study was to evaluate the assessment of global and regional left ventricular function, and size and transmural extent of infarction by EEM, validated against cardiovascular magnetic resonance (CMR), which is considered the gold standard for assessment of LV function14,15 and (extent of) infarction.14-17
Materials and methods
Patients
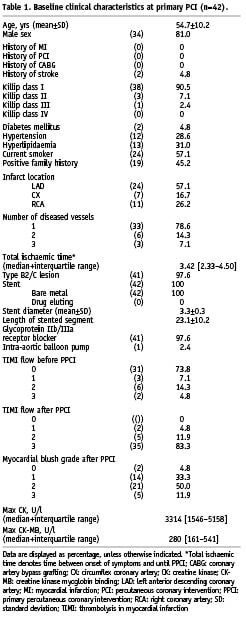
The present study was conducted at the University Medical Centre Groningen, The Netherlands. As part of a multicentre randomised controlled trial evaluating the effect of intracoronary infusion of autologous bone marrow derived cells following PPCI for STEMI, all patients underwent both CMR and re-catheterisation four months after PPCI18. Due to the specific inclusion and exclusion criteria only patients with a relatively large myocardial infarction were enrolled in the study. All baseline clinical and procedural data were entered in a database. All patients gave written informed consent for participation in the trial.
Electromechanical mapping procedure
EEM maps were obtained as previously described7. In short, the mapping NOGA/CARTO system (Biosense Webster, Diamond Bar, CA, USA) comprises a miniature passive magnetic field sensor, an external ultralow magnetic field emitter (location pad), and a processing unit. The catheter tip incorporates standard electrodes that allow recording of unipolar or bipolar signals and the location sensor. The mapping catheter was introduced through an 8 Fr or 9 Fr femoral sheath and placed in the left ventricle. Another reference catheter, also with a tip sensor, was taped securely to the patient’s back. The apex, the inflow and outflow tract were identified to form the first three-dimensional image of the ventricle. After that, the remaining points were measured without fluoroscopy. The stability of the catheter-to-wall contact was evaluated at every site in real time, and points were deleted from the map if one of the following criteria was met: (1) a premature beat or a beat after a premature beat; (2) location stability, defined as a difference of >5 mm in end-diastolic location of the catheter at two sequential heartbeats; (3) loop stability, defined as an average distance of >5 mm between the location of the catheter at two consecutive beats at corresponding time intervals in the cardiac cycle; (4) cycle length that deviated >10% from the median cycle length; (5) different morphologies of the local ECG at two consecutive beats; (6) local activation time differences of >5 ms between two consecutive beats; and (7) different QRS morphologies of the body surface ECG. On average around 100 points were measured evenly distributed throughout the left ventricle in order to complete a representative 3D image. Fluoroscopy was used for approximately three minutes during the beginning of the procedure. An example of an EEM reconstruction is shown in Figure 1.
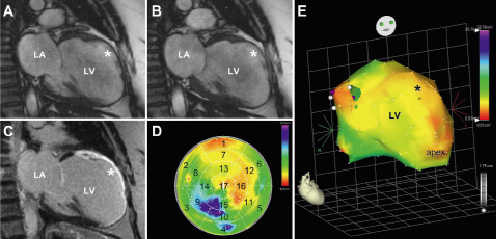
Figure 1. Example of cine (A: diastole & B: systole) and late gadolinium enhanced (C) images and corresponding bipolar voltage endocardial electromechanical map (D: bull’s eye map & E: 3D reconstruction) of a patient with a large anterior myocardial infarction. Asterisk indicates akinetic anterior wall on the cine images (A & B) and transmural extent of infarction on the late gadolinium enhanced image (C). The endocardial electromechanical 3D map displays a low amplitude (<0.06 mV) in the infarct region (E), which is also seen on the bull’s eye map (D) in the anterior segments 1, 7 and 13. LA: left atrium; LV: left ventricle
Cardiovascular magnetic resonance
CMR was performed on a 1.5-T clinical scanner (Sonata; Siemens, Erlangen, Germany) using a phased array cardiac receiver coil, at four months after primary PCI. Electrocardiogram-gated images were acquired during repeated breath-holds of approximately 10 seconds. LV function was determined with cine imaging, using a segmented steady state free precession pulse sequence in multiple short axis views, every 10 mm, covering the entire left ventricle. Typical in plane resolution was 1.6x1.9 mm2, with slice thickness of 6.0 mm (repetition time/echo time=3.2/1.6 ms, flip angle 60°, matrix 256x156, temporal resolution 35-50 ms). Late gadolinium-enhanced (LGE) images were acquired to determine infarct size and transmural extent of infarction. A 2D segmented inversion recovery gradient-echo pulse sequence was used, 15 minutes after administration of a gadolinium-based contrast agent (Dotarem; Guerbet, Roissy, France) (0.2 mmol/kg), with slice locations identical to the cine images. Typical in plane resolution was 1.4x1.8 mm2, with slice thickness of 6.0 mm (repetition time/echo time=9.6/4.4 ms, flip angle 25°, matrix 256x166, triggering to every other heart beat). The inversion time was set to null the signal of viable myocardium, and typically ranged from 260 to 350 ms.
Data analysis and definitions
Extraction of the contractility data and conversion to a 17-segment bull’s-eye maps for EEM parameters were performed off-line (Figure 1). End-diastolic volumes, end-systolic volumes, and the surface area for UV (with a transmurality threshold of 6.9 mV13) expressed as percentage of total surface, were calculated for each EEM map. When an EEM segment had less than four contact points within its boundaries that segment was excluded from regional analysis. One value per segment was calculated for all three variables.
All CMR data were analysed on a separate workstation using dedicated software (Mass version 2006beta; Medis, Leiden, The Netherlands). Cine and LGE images were acquired during the same imaging session, and therefore matched by using slice position. On all short axis cine slices, the endocardial and epicardial borders were outlined manually on end-diastolic and end-systolic images. LV volumes and LVEF were calculated. Segment location was defined on cine and LGE images according to the 17-segment model. Segmental wall thickening was calculated by subtracting end-diastolic wall thickness from end-systolic wall thickness, and expressed as percentage of end-diastolic wall thickness. Segments were considered dysfunctional if there was less than 33 percent wall thickening during systole. Total infarct size was calculated by summation of all slice volumes of hyper enhancement, using a standardised and predefined definition (signal intensity >5 SD above the mean signal intensity of remote myocardium)19, and expressed as percentage of LV mass. The transmural extent of infarction was calculated by dividing the hyperenhanced area by the total area of the predefined segment (%).
To assess the agreement of the segmental data between EEM and CMR all data were first converted to standard 17-segment bull’s-eye maps20. Per individual segment three EEM parameters (LLS, UV and BV) and two CMR parameters were available (regional wall thickening and transmural extent of infarction). For analysis of segmental function and transmural extent of infarction, the apex-segment (segment 17) was excluded, due to the partial volume effect of the short axis oriented data acquisition of CMR. All EEM and CMR images were analysed by two observers who were blinded to the patient data and clinical status.
Statistical analysis
Analyses were performed with the commercially available package SPSS version 12.0.1 (SPSS Inc., Chicago, IL, USA). Continuous data were expressed as mean ±standard deviation (SD). Categorical data were expressed as median with corresponding interquartile range. The method of Bland and Altman was used to display the average difference and limits of agreement between the reference values of CMR and the functional parameters of EEM21. Pearson’s correlation coefficient was calculated to assess the correlation between CMR and EEM. Mean LLS, UV and BV values for normal segments, segments with subendocardial LGE and segments with transmural LGE were compared using ANOVA. In addition, Mean LLS, UV and BV values for normal segments and dysfunctional segments were compared using ANOVA. All statistical tests were two-sided with a significance level of p≤0.05.
Results
Forty-two consecutive patients underwent EEM mapping and CMR assessment of both global and regional left ventricular function parameters. Demographic and procedural characteristics are provided in Table 1. From the EEM maps 557 from the 672 segments were included in the analyses. Global and regional functional CMR data were available from all 42 patients. LGE CMR data were available from 41 patients.
Global parameters
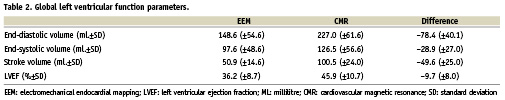
The average LVEF measured by EEM was 36.2 % (±8.7 %-point). Compared to the average LVEF measurement by CMR of 45.9 % (±10.5 %-point), there was an average underestimation of 9.7 %-point (p<0.001). Figure 2 represents the Bland-Altman analysis of the differences between both EEM and CMR measurements of LVEF. The Pearson’s correlation coefficient for LVEF was 0.66 (p<0.001). All functional global parameters are provided in Table 2.
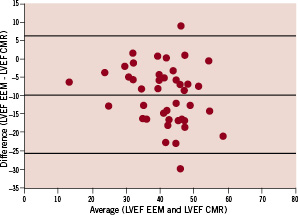
Figure 2. Bland-Altman plot of left ventricular ejection fraction derived from endocardial electromechanical mapping and cardiovascular magnetic resonance.
Average infarct size measured by CMR was 11.8±7.2 %. The EEM surface area with a UV cut off value of <6.9 mV, expressed as percentage of the total surface area, correlated well with LGE CMR infarct size (R=0.578, p<0.001) (Figures 3 and 4).
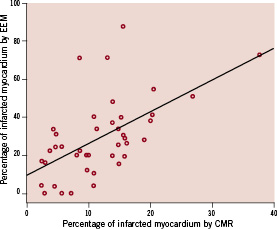
Figure 3. Relation between infarct size assessment by EEM and CMR, expressed as percentage of the total left ventricular myocardial mass.
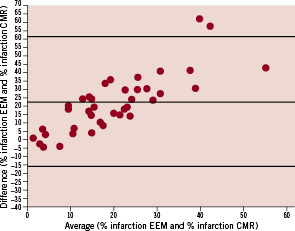
Figure 4. Receiver operator characteristic analysis for the identification of (A) viable myocardium, defined as segmental transmural extent of <50% and (B) non-viable myocardium, defined as segmental transmural extent of ≥50%, at late gadolinium enhancement CMR, using endocardial electromechanical mapping parameters. LLS: linear local shortening; UV: unipolar voltage; BV: bipolar voltage
Regional parameters
All three EEM parameters, LLS, UV and BV differed significantly between normal and dysfunctional segments (9.8 vs. 7.3, 11.8 vs. 9.7 and 3.3 vs. 2.8 for LLS, UV and BV, respectively; p<0.001 for LLS and UV, p=0.006 for BV). Furthermore, average LLS, UV and BV differed significantly between normal segments, segments with subendocardial LGE and segments with transmural LGE (10.8 vs. 8.8 vs. 5.0, 12.3 vs. 10.5 vs. 9.5 and 3.5 vs. 3.0 vs. 2.3 for LLS, UV and BV, respectively; p<0.001 for all variables).
The receiver operator characteristic curves (ROC) for LLS, UV and BV for the identification of subendocardial infarction on CMR are shown in Figure 5A. The area under the curve for LLS, UV and BV was 0.589, 0.619 and 0.594, respectively. The ROC-curves for LLS, UV and BV for the identification of transmural infarction on CMR are shown in Figure 5B. The area under the curve for LLS, UV and BV was 0.725, 0.698 and 0.713, respectively. Although a large inter-patient variability in terms of maximum and minimum values for all three EEM parameters was noted, normalisation of the segmental values (EEM parameters expressed as percentage of maximum, average or minimum value of that particular map) did not significantly alter the ROC-curves.
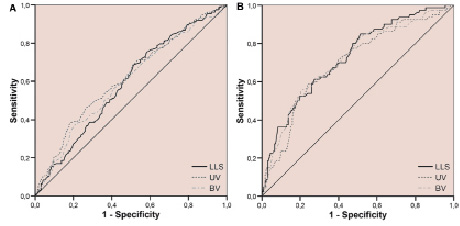
Figure 5. Receiver operator characteristic analysis for the identification of (A) viable myocardium, defined as segmental transmural extent of <50% and (B) non-viable myocardium, defined as segmental transmural extent of ≥50%, at late gadolinium enhancement CMR, using endocardial electromechanical mapping parameters. LLS: linear local shortening; UV: unipolar voltage; BV: bipolar voltage
Discussion
In the present study, we evaluated the value and limitations of EEM in the assessment of global and regional left ventricular function, and size and transmural extent of infarction, in comparison with CMR. Our results demonstrate that, despite a large underestimation of LVEF assessment, EEM may be helpful in determining both regional function and transmural extent of infarction in patients with a large myocardial infarction. However, our data indicate that exact pinpointing of myocardial area’s which could potentially benefit from locally injected therapeutics remains questionable.
Numerous studies have compared EEM with other imaging modalities and although electromechanical cardiac mapping measurements are quantitative, no generally accepted cut-off values for EEM parameters have been identified9;22-26. At the present time only one other study comparing EEM to CMR in post-STEMI patients has been published13. In this study 15 patients underwent both EEM and CMR with LGE. Perin et al found a cut-off value of 6.9 mV for differentiation between normal and transmural myocardial infarction using ROC analyses (area 0.94, sensitivity 93%, specificity 88%). Although the ROC analyses were less convincing in the present study, it was noted that there was a reasonable correlation between the percentage of the surface area of the EEM maps with an UV <6.9 mV and the extent of LGE, expressed as percentage of the total myocardial mass. When bearing in mind that myocardial damage from STEMI originates from the endocardial surface with variable penetration to the epicardium, the Pearson’s correlation coefficient of 0.578 may be partly attributed to the nature of the physical data-acquisition (endocardial detection for EEM vs. whole-myocardium LGE in CMR). In this light, it could be argued that the trabecularisation of the left ventricle may partly explain the overall lower ventricular volumes measured by EEM in comparison with CMR, in which all trabecularisation and papillary muscle mass are considered part of the left ventricular cavity. An earlier study comparing global LV function measured by EEM to bi-plane LV angiography also showed a considerable underestimation of these parameters by EEM.27
It was noted that there were large inter-patient differences in terms of maximal and minimal values of the EEM parameters. This was unexpected since the patient population was rather uniform, due to the tight in- and exclusion criteria of the trial in which all patients were enrolled. However, normalisation of the EEM parameters for either minimal or maximal values did not improve or weaken the discriminative power of EEM for extent of LGE or regional function, indicating that there may be another factor explaining these variations. It could be argued that additional local ischaemia is responsible for this effect. However, the present study was not designed to elucidate this effect.
Although we found statistically significant differences between the infarcted and non-infarcted myocardial tissue, the exact location of the border zone of the myocardial infarction, which is arguably the area benefiting most from direct injection of progenitor cells or other therapeutics remained uncertain in individual patients. Combining the EEM technique with other imaging modalities as CMR, computed tomography or nuclear imaging may eventually overcome this problem by fusing the image on-line with the EEM-map. This technique is already implemented for electrophysiological interventions of the atria.
Limitations
The present study was performed in a selected patient-cohort with a known large MI. Furthermore, with the use of a 17-segment bull’s-eye maps for data assessment there is a risk of “segmental shift” in which areas of myocardial tissue are projected in different segments, creating a mismatch. This approach could also have caused some “smearing” of the infarcted areas, since multiple individual measurements were used to form one variable per segment. In this study, two pairs of measurements were compared that have slightly different biomechanical and physiological backgrounds. This could have been responsible for some mismatching. Furthermore, we excluded 17% of the EEM segments in the segmental analyses. It could be hypothesised this has negatively influenced the segmental analyses. However, the majority of the excluded segments were excluded because there were less than four contact points within the segmental border and were mostly located in non-infarcted myocardial areas.
Conclusion
In conclusion, although large differences in global left ventricular functional parameters between EEM and CMR were found, there was a reasonable correlation between the surface area of the EEM-map with a UV below 6.9 mV and LGE infarct size. Segmental analyses showed that EEM may be helpful in determining both regional function and extent of infarction in patients with a large myocardial infarction, however, convincing cut-off values for EEM-parameters could not established. Therefore the value of EEM for pinpointing myocardial areas benefiting from direct injection of therapeutics at present remains limited. Further development of this potentially very useful modality is needed before it can be advocated for exact border-zone endocardial injection.
Acknowledgements
All authors have contributed significantly to this paper:
P.A. van der Vleuten made substantial contributions to the intellectual content of the paper in terms of conception and design, acquisition of data, analysis and interpretation of data, drafting of the manuscript and statistical analysis. R. Nijveldt made substantial contributions to the intellectual content of the paper in terms of acquisition of data and critical revision of the manuscript for important intellectual content Eng-Shiong Tan made substantial contributions to the intellectual content of the paper in terms of acquisition of data and critical revision of the manuscript for important intellectual content. R.A. Tio made substantial contributions to the intellectual content of the paper in terms of conception and design, critical revision of the manuscript for important intellectual content and statistical analysis. A.C. van Rossum made substantial contributions to the intellectual content of the paper in terms of conception and design, critical revision of the manuscript for important intellectual content and supervision. F. Zijlstra made substantial contributions to the intellectual content of the paper in terms of conception and design, critical revision of the manuscript for important intellectual content and supervision.
P.A. van der Vleuten had full access to all of the data in the study and takes responsibility for the integrity of the data and the accuracy of the data analysis.