Background
Clustered data are common in the field of interventional cardiology. Often multiple lesions are examined within the same patient and intravascular imaging modalities - such as intravascular ultrasound (IVUS) or optical coherence tomography (OCT) - result in multiple measurements from the same vessel segment. Multiple observations from one patient are likely to be correlated, which has implications for the statistical approach used to analyse the data.
The approach taken in the statistical analysis should be based on the study objectives. If we study the effect of medication versus no medication, the level of analysis should be the patient. If we study the effect of stent implantation, the level of analysis could be the stented segment. One patient can have multiple stented segments and these are likely to be correlated. Ignoring this correlation in the analysis leads to a too strong statistical inference. Specifically, misleadingly small standard errors (and thus p-values and confidence intervals) will be found when all observations are considered as independent. This wrongly inflates statistical power. Thus, analyses of data that include multiple observations per patient require some form of adjustment to account for the correlation between observations. This is common knowledge in the statistical literature (for example, Molenberghs1). In the medical literature, however, clustered data are often analysed without taking the within-cluster correlation into account2.
The aim of this paper is to review the current analytical approach to clustered data in the field of interventional cardiology; to present and illustrate statistical methods that take into account possible correlation within clusters. We provide syntax for different statistical packages to allow researchers to apply these methods.
Current practice
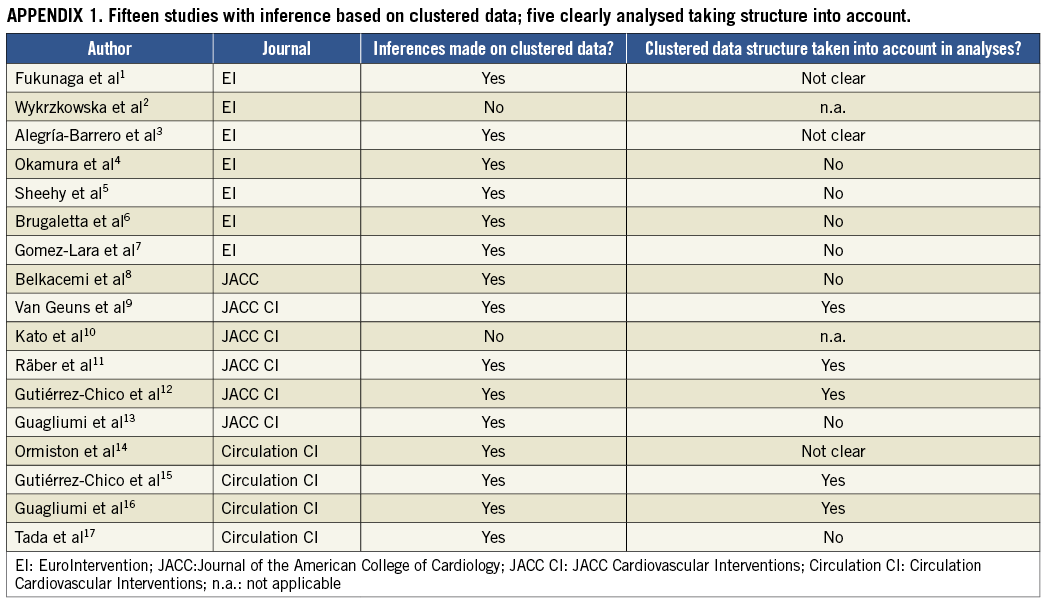
We conducted a systematic review to gain insight in the current statistical approaches to clustered data in the field of interventional cardiology and focused on studies on optical coherence tomography (OCT), since this technique results in large numbers of observations per patient. We conducted a PubMed literature search for original studies published between January 1, 2012 and December 31, 2012 in six important (interventional) cardiology journals: Circulation, Circulation Cardiovascular Interventions, EuroIntervention, European Heart Journal, Journal of the American College of Cardiology (JACC) and JACC Cardiovascular Interventions. The search string “optical coherence tomography” yielded 25 potentially eligible studies. These were reviewed by two independent reviewers where, in case of disagreement, a third reviewer was consulted. Case reports, reviews and editorials were excluded, leaving 17 studies (Online Appendix 1) all reporting data derived from multiple observations per patient. In 15 (88%) of the 17 studies, inferences made from these multiple observations per patient were reported. Of those 15 studies, only five (33%) took the clustered nature of the data clearly into account in the statistical analysis. In three (20%) studies it was not clear whether the clustering was taken into account. In seven (46%) studies it was clear that the clustering within patients was not taken into account. In these studies t-tests were mostly conducted, which assume that all observations are independent.
Methods to analyse clustered data
We illustrate the use of different statistical methods with data from a study that evaluated late recoil of a novel bioabsorbable everolimus-eluting coronary scaffold (BVS)3. The study consisted of 16 patients who were treated with elective BVS implantation. All patients underwent an IVUS examination post-procedure and at six-month follow-up. A total of 484 paired cross-sectional areas (CSAs) were acquired, on average over 30 per patient. Late absolute stent recoil was defined as stent area at post-procedure minus stent area at follow-up. In each CSA, plaque morphology was assessed qualitatively and classified as calcific, fibronecrotic, or fibrocellular plaque.
In these data we address two research questions with different methods in line with the reviewed literature.
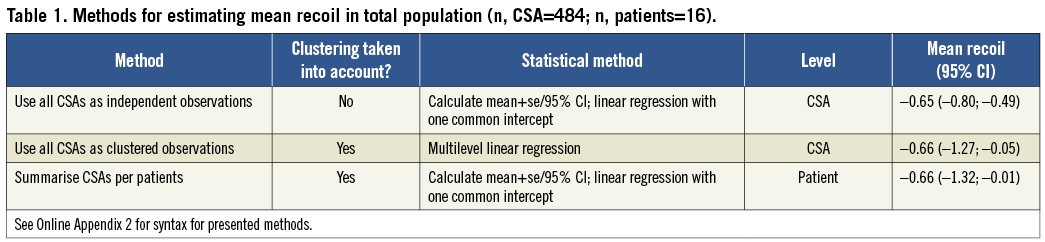
Research question 1: What is the stent recoil in this population? We can hereto provide a mean with a 95% confidence interval (CI).
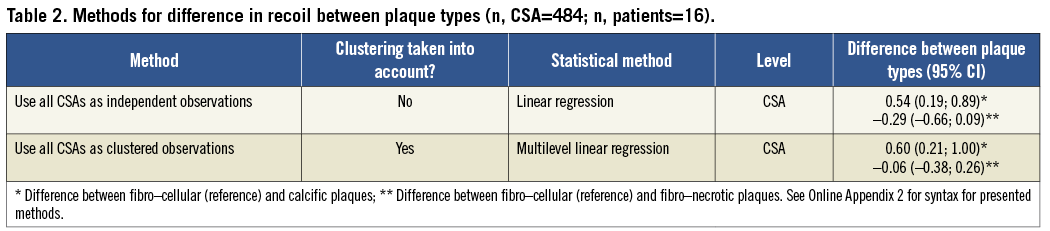
Research question 2: What is the difference in stent recoil between the three different plaque types? We can hereto provide differences between plaque types with 95% CI.
METHOD 1: INDEPENDENT OBSERVATIONS
The simplest method is to analyse the data at CSA level, without taking into account the clustering within patients. Formally this approach assumes that each observation is statistically independent, i.e., that there is no correlation between different CSAs from the same patient. We calculate mean absolute recoil and 95% confidence interval (95% CI) based on all 484 CSAs. Alternatively, the mean and 95% CI can be obtained from a linear regression model without any covariates. In this model only the intercept is estimated which equals the mean recoil. To estimate the differences between plaque types, a linear regression model with plaque type as a categorical covariate can be fitted. The linear models estimate unconditional effects, i.e., the average difference between plaque types in the population.
METHOD 2: CLUSTERED OBSERVATIONS
In contrast to the first approach, we can take the correlations between recoil values within patients into account. We can thereto use a linear multilevel model, also called random effects, mixed, or hierarchical model. The multilevel model contains two levels: patient and CSA. The patient is included in the model as a random effect, which allows estimation of patient-specific recoil values. The estimated intercept equals the mean recoil, with clustering taken into account.
To estimate the differences between plaque types we used a linear multilevel model with a random intercept for patient and plaque type as a categorical covariate.
The interpretation of the differences between plaque types is somewhat different than in method 1. In method 1, we estimate differences within and across patients, while in method 2, we strictly estimate differences within patients.
METHOD 3: PATIENT LEVEL
Another approach simply averages the recoil values per patient. These means are saved. In a second step, the means are averaged to obtain an overall mean over all observations.
Results
All three methods estimated a very similar mean absolute recoil of about 0.65 to 0.66 mm2 (Table 1). As expected, the 95% confidence interval of the absolute recoil was smallest (–0.80; –0.49) when all CSAs were analysed as independent observations and largest (–1.32; –0.01) when the CSAs were first summarised per patient. When the CSAs were analysed as clustered observations with a multilevel model, the 95% CI was –1.27 mm2 to –0.05 mm2, which is clearly larger than the 95% CI obtained with method 1, and close to the width obtained with method 3.
When estimated with a naïve linear model, ignoring clustering, the mean recoil per plaque type was –0.74 mm2 in fibro-cellular, –0.20 mm2 in calcific, and –1.03 in fibro-necrotic plaques. The corresponding differences (95% confidence interval) were 0.54 mm2 (0.19; 0.89) for fibro-cellular vs. calcific plaques and –0.29 mm2 (–0.66; 0.09) for fibro-cellular vs. fibro-necrotic plaques (Table 2). When clustering was taken into account in the multilevel model, the differences were 0.60 mm2 (0.21; 1.00) and –0.06 mm2 (–0.38; 0.26), respectively. This difference could be explained by the fact that the multilevel model estimates conditional, or within patient differences. When all CSAs are considered independent, fibro-necrotic plaques have 0.29 mm2 less recoil than fibro-cellular plaques. However, when we acknowledge that CSAs are clustered within patients, this difference almost disappeared (0.06 mm2 less recoil). In this example the 29 mm2 absolute recoil difference is contributed to a high or low recoil level in some patients, instead of to the plaque type itself. Within a patient, fibro-cellular plaques appear to give no more recoil than calcific plaques.
In this particular example the estimated mean recoil in the overall population was not largely affected by using a multilevel model; only the confidence interval increased. The estimated difference between plaque types was however affected. The difference between fibro-cellular and calcific plaques was only borderline significant in the multilevel model.
In general, the change in point estimates between naïve models and multilevel models will be influenced by the correlation within patients, and the difference in number of observations between patients. When both are small, point estimates are likely to be very similar between the methods. However, the standard error and confidence intervals will generally increase, and corresponding p-values decrease when using a multilevel model. Ignoring clustering using naïve models will exaggerate statistical significance.
Conclusion and recommendations
According to literature review, the current analytical approach to clustered data in the field of interventional cardiology, specifically OCT, is suboptimal. A large number of studies ignored the clustered nature of their data, or it was unclear which statistical methods were used. If we assume that observations within one patient are correlated, ignoring clustering may lead to wrong conclusions.
Our data example shows that indeed misleadingly small confidence intervals can be estimated with standard linear regression. The third method –summarising CSAs per patient– is statistically correct when analyses on patient level are performed, but inefficient.
When observations within patients are not correlated, the clustering can theoretically be ignored. However, this is clinically unlikely and, in the absence of correlation, the results from standard and multilevel analysis will be the same. We therefore recommend to always use multilevel models when analysing multiple observations per patient, to make correct statistical inferences and not inflate statistical power. These models are now widely available in statistical software, and syntax is provided in Online Appendix 2.
Conflict of interest statement
The authors have no conflicts of interest to declare.
APPENDIX 2. Syntax code for the performed analyses in SPSS, SAS and R.
SPSS
* Import data
GET DATA
/TYPE=XLS
/FILE=’V:\UserData\MyPaper\data.xls’
/SHEET=name ‘recoil and plaque characteristi’
/CELLRANGE=full
/READNAMES=on
/ASSUMEDSTRWIDTH=32767.
EXECUTE.
DATASET NAME DataSet1 WINDOW=FRONT.
* RQ 1, method 1
EXAMINE VARIABLES=Recoil
/PLOT NONE
/STATISTICS DESCRIPTIVES
/CINTERVAL 95
/MISSING LISTWISE
/NOTOTAL.
COMPUTE constant = 1.
EXECUTE.
REGRESSION
/MISSING LISTWISE
/STATISTICS COEFF OUTS CI(95) R ANOVA
/CRITERIA=PIN(.05) POUT(.10)
/ORIGIN
/DEPENDENT Recoil
/METHOD=ENTER constant.
* RQ 1, method 2
MIXED Recoil WITH constant
/CRITERIA=CIN(95) MXITER(100) MXSTEP(10) SCORING(1) SINGULAR(0.000000000001) HCONVERGE(0,
ABSOLUTE) LCONVERGE(0, ABSOLUTE) PCONVERGE(0.000001, ABSOLUTE)
/FIXED= constant | SSTYPE(3)
/METHOD=ML
/PRINT=SOLUTION
/RANDOM=INTERCEPT | SUBJECT(Patient) COVTYPE(VC).
* RQ 1, method 3
AGGREGATE
/OUTFILE=’V:\UserData\521825\Paper Eurointervention\aggr.sav’
/BREAK=Patient
/Recoil_mean=MEAN(Recoil).
GET
FILE=’V:\UserData\521825\Paper Eurointervention\aggr.sav’.
DATASET NAME DataSet2 WINDOW=FRONT.
EXAMINE VARIABLES=Recoil_mean
/PLOT NONE
/STATISTICS DESCRIPTIVES
/CINTERVAL 95
/MISSING LISTWISE
/NOTOTAL.
*RQ 2, method 1
GET DATA
/TYPE=XLS
/FILE=’V:\UserData\521825\Paper Eurointervention\recoil and plaque characteristics data for Ron and Nico 08.04.22.xls’
/SHEET=name ‘recoil and plaque characteristi’
/CELLRANGE=full
/READNAMES=on
/ASSUMEDSTRWIDTH=32767.
EXECUTE.
DATASET NAME DataSet1 WINDOW=FRONT.
COMPUTE x1=0 .
IF Plaque = 1 x1 = 1.
EXECUTE.
COMPUTE x2=0 .
IF Plaque = 2 x2 = 1.
EXECUTE.
REGRESSION
/MISSING LISTWISE
/STATISTICS COEFF OUTS CI(95) R ANOVA
/CRITERIA=PIN(.05) POUT(.10)
/NOORIGIN
/DEPENDENT Recoil
/METHOD=ENTER x1 x2.
* RQ 2, method 2
MIXED Recoil WITH x1 x2
/CRITERIA=CIN(95) MXITER(100) MXSTEP(10) SCORING(1) SINGULAR(0.000000000001) HCONVERGE(0,
ABSOLUTE) LCONVERGE(0, ABSOLUTE) PCONVERGE(0.000001, ABSOLUTE)
/FIXED= x1 x2 | SSTYPE(3)
/METHOD=ML
/PRINT=SOLUTION
/RANDOM=INTERCEPT | SUBJECT(Patient) COVTYPE(VC).
SAS
proc import
out=a
datafile=”V:\UserData\MyPaper\data.csv”
dbms=csv
replace;
getnames=yes;
datarow=2;
run;
title1 ‘Research Question 1’;
title2 ‘Method 1’;
title3 ‘First simply calculate overall mean and s.e.’;
proc univariate data=a;
var Recoil;
run;
title3 ‘Then calculate overall mean and s.e. using linear regression’;
proc reg data=a;
model Recoil = ;
run;
title2 ‘Method 2’;
title3 ‘Calculate overall mean and s.e. using multilevel model’;
proc mixed data=a;
class Patient;
model Recoil = / solution cl;
random int / subject=Patient solution;
run;
title2 ‘Method 3’;
title3 ‘First calculate means per patient’;
proc means data=a;
var Recoil;
output out=b mean=PatAvg;
by Patient;
run;
title3 ‘Then average the calculated means’;
proc univariate data=b;
var PatAvg;
run;
title1 ‘Research Question 2’;
title2 ‘First a general linear model with Plaque as discrete predictor’;
proc glm data=a;
class Plaque Patient;
model Recoil = Plaque / solution;
run;
title2 ‘Then a mixed model with Plaque as discrete predictor’;
proc mixed data=a;
class Plaque Patient;
model Recoil = Plaque / solution cl;
random int / subject=Patient solution;
run;
R
#load libraries
library(Hmisc)
library(rms)
library(foreign)
library(lme4)
#import data
data <- as.data.frame(read.table(file= ‘V:\\UserData\\MyPaper\\data. csv’,header=T,sep= “,”))
names(data)
nrow(data)
attach(data)
#RQ 1, method 1a
mean1b <- mean(Recoil)
sd1b <- sd(Recoil)
n1b <- nrow(data)
se1b <- sd1b / sqrt(n1b)
cil1b <- mean1b - 1.96*se1b
ciu1b <- mean1b + 1.96*se1b
#RQ 1, method 1b
rq1mod1 <- lm(Recoil~1)
mean1a <- coef(summary(rq1mod1))[1,1]
se1a <- coef(summary(rq1mod1))[1,2]
cil1a <- mean1a - 1.96*se1a
ciu1a <- mean1a + 1.96*se1a
rq1method1a <- cbind(‘1a’, round(mean1a,2), round(cil1a,2), round(ciu1a,2))
rq1method1b <- cbind(‘1b’, round(mean1b,2), round(cil1b,2), round(ciu1b,2))
#RQ 1, method 2
rq1mod2 <- lmer (Recoil~1 + 1|Patient)
mean2 <- coef(summary(rq1mod2))[1,1]
se2 <-coef(summary(rq1mod2))[1,2]
cil2 <- mean2 - 1.96*se2
ciu2 <- mean2 + 1.96*se2
rq1method2 <- cbind(‘2’, round(mean2,2), round(cil2,2), round(ciu2,2))
#RQ 1, method 3
meanRecoil <- tapply(Recoil, Patient, mean)
mean3 <- mean(meanRecoil)
sd3 <- sd(meanRecoil)
n3 <- length(meanRecoil)
se3 <- sd3 / sqrt(n3)
cil3 <- mean3 - 1.96*se3
ciu3 <- mean3 + 1.96*se3
rq1method3 <- cbind(‘3’, round(mean3,2), round(cil3,2), round(ciu3,2))
summaryRQ1 <-rbind(rq1method1a, rq1method1b, rq1method2, rq1method3)
colnames(summaryRQ1) <- c(‘method’,’mean’, ‘lower 95% CI’, ‘upper 95% CI’)
summaryRQ1
# RQ 2, method 1
rq2mod1 <- lm(Recoil~as.factor(Plaque))
beta1cat1 <- coef(summary(rq2mod1))[2,1]
beta1cat2 <- coef(summary(rq2mod1))[3,1]
se1cat1 <- coef(summary(rq2mod1))[2,2]
se1cat2 <- coef(summary(rq2mod1))[3,2]
cil1cat1 <- beta1cat1 - (1.96*se1cat1)
ciu1cat1 <- beta1cat1 + (1.96*se1cat1)
cil1cat2 <- beta1cat2 - (1.96*se1cat2)
ciu1cat2 <- beta1cat2 + (1.96*se1cat2)
rq2method1 <- cbind(‘1’, round(beta1cat1,2), round(cil1cat1,2), round(ciu1cat1,2),round(beta1cat2,2), round(cil1cat2,2), round(ciu1cat2,2))
#RQ 2, method 2
rq2mod2 <- lmer (Recoil~ as.factor(Plaque) + (1|Patient))
beta2cat1 <- coef(summary(rq2mod2))[2,1]
beta2cat2 <- coef(summary(rq2mod2))[3,1]
se2cat1 <- coef(summary(rq2mod2))[2,2]
se2cat2 <- coef(summary(rq2mod2))[3,2]
cil2cat1 <- beta2cat1 - (1.96*se2cat1)
ciu2cat1 <- beta2cat1 + (1.96*se2cat1)
cil2cat2 <- beta2cat2 - (1.96*se2cat2)
ciu2cat2 <- beta2cat2 + (1.96*se2cat2)
rq2method2 <- cbind(‘2’, round(beta2cat1,2), round(cil2cat1,2), round(ciu2cat1,2),round(beta2cat2,2), round(cil2cat2,2), round(ciu2cat2,2))
summaryRQ2 <-rbind(rq2method1, rq2method2)
colnames(summaryRQ2) <- c(‘method’,’beta1’, ‘lower 95% CI’, ‘upper 95% CI’,’beta2’,’lower 95% CI’, ‘upper 95% CI’)
summaryRQ2
#save data
save.image(“V:\\UserData\\MyPaper\\Ranalysis.RData”)