Abstract
Aims: Graphical Statistical Process Control (SPC) tools have been shown to promptly identify significant variations in clinical outcomes in a range of health care settings, but as yet have not been widely applied to performance monitoring in percutaneous coronary intervention (PCI). We explored the application of these techniques to a prospective PCI registry at a single site.
Methods and results: Baseline clinical and procedural data along with one and twelve month major adverse cardiac event (MACE) details were prospectively collected in relation to 2,697 consecutive PCI procedures (2,417 patients) performed between the 1st January 2003 and the 31st December 2007. We investigated outcome measures which were both clinically relevant and occurred at a sufficient frequency (> 1%) to allow valid application of SPC techniques, and found procedural and lesion failure, major postprocedural complications, and one and 12 month MACE to be suitable endpoints. Cumulative Sum (CUSUM) charts, Variable Life-Adjusted Display (VLAD) charts and Funnel Plots were employed in combination to evaluate both group and individual performance on a near “real time” basis. We found that the use of these charts provided complimentary prospective audit of clinical performance to identify variations in group and individual operator performance and to clarify these as either systemic or individual operator-related. We propose a system of integrating SPC tools as a component of the audit function of a PCI unit.
Conclusions: SPC tools have the potential to provide near “real-time” performance monitoring and may allow early detection and intervention in altered performance for both the group and the individual operator. A clinically-integrated system of SPC tools may thus complement and enhance effectiveness of the traditional case-based morbidity and mortality audit.
Introduction
The 1999 United States (US) Institute of Medicine’s publication, “To Err is Human: Building a Safer Health System”1 raised significant concerns with the extent and cost of errors in the US health care system and called for health care providers, government, consumers, and others to strive to achieve a substantial reduction in the rate of adverse events. The identification of systemic failings leading to unacceptable clinical performance was also the subject of the 2001 Bristol Royal Infirmary Inquiry2 in the United Kingdom and the 2005 Queensland Public Hospitals Commission of Inquiry3 in Australia. As a result of the publicity generated from these reports and reviews there has been an increased emphasis on the establishment of systems to ensure the delivery of clinical services is of an acceptable quality. However, interest in the quality of health care is not limited to dealing only with the detection and reduction of medical errors and unacceptable clinical performance. In 2003 the Centres for Medicare & Medicaid Services4 went further by instituting a rule that required hospitals to develop quality assessment and performance improvement programs.
Scientifically based quality improvement tools, such as statistical process control (SPC) charts, have been used in manufacturing since the 1920s and have a proven history of success in quality monitoring and improvement. Although the translation from industry to health care has taken some time, the power of these techniques to display adverse clinical performance trends well in advance of other methods of detection5 sees them now finding widespread acceptance in a variety of clinical applications6-14. To date, however, their application to performance monitoring in interventional cardiology has not been extensively explored. Recent work by Kunadian et al15 and Matheny et al16 provide examples of how SPC can be used to monitor specific performance measures associated with percutaneous coronary intervention (PCI), including in-hospital major adverse cardiovascular and cerebrovascular events and in-hospital mortality. Historically, PCI is also associated with additional adverse events post hospital discharge including important complications such as restenosis and stent thrombosis, which may require repeat angiography and revascularisation procedures and also result in additional morbidity and mortality. The primary purpose of this paper is to propose a system of SPC tools to monitor both total institutional and individual clinician performance in the delivery of PCI services within a single clinical site, inclusive of outcomes up to 12 months post procedure. These tools are proposed as an adjunct to the traditional case based review processes commonly used to deal with major adverse events. We therefore investigated appropriate parameters to monitor not only in-hospital outcomes but also outcomes at 30 days and 12 months. Our secondary purpose was to explore the role of these techniques in developing a system of feedback to clinical teams in a clinician driven model of quality improvement.
Methods
Data collection
Ethical approval was gained to undertake collection of data from patients undergoing PCI procedures at St Andrew’s War Memorial Hospital (SAWMH), as part of an ongoing performance monitoring process.
For each patient, demographic and co-morbidity data along with angiographic findings and outcomes from the hospital admission for PCI were collected. Patients were contacted at 30 days and 12 months post procedure and data on a number of outcomes were collected. All data were entered prospectively into a purpose-designed database.
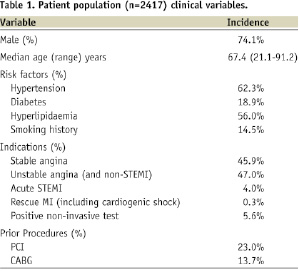
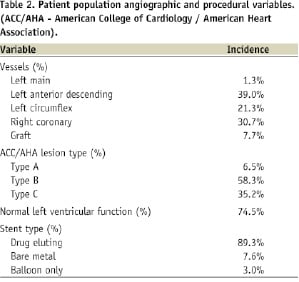
Data for this study were drawn from 2,697 consecutive procedures performed in the cardiac catheterisation theatres at SAWMH between the 1st January 2003 and the 31st December 2007. The procedures involved 2,417 patients (74.1% male) with a median age of 67.1 years (range: 21.1 to 91.2 years). Follow-up of eligible procedures at 30 days was 90.2% and at 12 months was 87.9%. A description of the patient population characteristics is provided in Table 1 while angiographic and procedural details are summarised in Table 2.
Performance measures
In establishing a quality monitoring system, the choice of suitable quality measures to monitor is the subject of substantial debate. Questions have been raised concerning the relative merits of using measures of outcomes (e.g., those experienced by the patient) vs. measures of process/structure (those inherent in the system delivering care)17,18. Based on the principles identified by the Shahian et al18 the measures selected should:
– monitor all relevant temporal domains of a patient’s encounter (including long-term measures of outcome),
– satisfy multiple criteria for validity, that is, they must appear
- reasonable for their intended purpose,
- encompass all relevant aspects of the function being monitored,
- accurately reflect the performance they are designed to measure,
- adequately reflect the quality of care, and
– be easily interpretable and actionable by providers.
In addition to these criteria, frequency of occurrence and likelihood of evidence of measurement and monitoring have also been used to assess the applicability of indices for inclusion in a program for monitoring surgical performance19. In regard to this criterion the application of statistical process control techniques to monitor performance places particular limitations on the selection of measurements. For example the event rate has to be high enough to meaningfully monitor and have a known, stable distribution. Webster20 has suggested that event rates should be in excess of at least 1%.
The measures commonly used to assess performance in PCI21-23 were reviewed and compared to measures collected as part of the existing hospital based quality monitoring program. Through this process a range of appropriate measures was identified and these were assessed against the selection criteria for their suitability for inclusion in a performance monitoring program. These measures relate to in-hospital procedural and post procedural complications and outcomes and extend into the post discharge period with data collection at 30 days and 12 months.
The range of potential performance measures identified from the hospital’s PCI database along with their event rates is provided in Table 3.
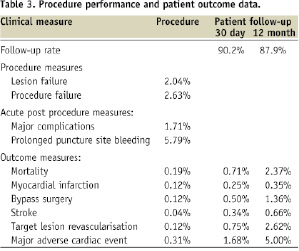
This table includes both individual and aggregated performance measures covering the procedural, acute post-procedural and post discharge phases of care.
We selected the following performance measures based on their clinical relevance, applicability to a monitoring program and event rate (> 1%):
Procedural measures of service delivery:
– Lesion failure: failure to successfully re-establish a final residual stenosis of less than 50% as determined by visual estimation,
– Procedural failure: failure to achieve a success in all lesions intended to treat.
Acute post procedure outcome measures (pre-discharge):
– Major post procedural complications: any instance of major events such as mortality, myocardial infarction (MI), emergency coronary artery bypass graft (CABG) surgery, intra-aortic balloon pump use, transfusion, tamponade, repeat angioplasty, ventilation, arrhythmia or shock.
– Puncture site complications excess puncture site bleeding defined as instances of where nursing intervention for the management of bleeding exceeded two hours.
Follow-up outcomes (30 days and 12 months):
– Target lesion revascularisation (TLR): any repeat PCI or CABG on the target lesion in the follow-up period.
– Major adverse cardiac event (MACE): any mortality, MI or TLR event.
For the purposes of this project, mortality has been defined as being due to any cause. At our facility the procedural mortality rate is 0.19% and reflects a relatively low proportion of acute MI and cardiogenic shock patients. At this event rate the application of SPC techniques is not recommended and therefore mortality has not been used as an isolated performance indicator. In other institutions dealing with a more acute patient population, however, mortality may be of a sufficient rate (>1.0%) that would make it suitable to monitor as an isolated measure using SPC techniques.
Choice of SPC methods
Many types of statistical process control charts have been used in clinical performance monitoring applications including Shewhart charts, CUSUM charts (and variants such as the Sequential Probability Ratio Test and Sets Method or Grass Plot), Cumulative Expected Observed Minus Expected (O-E) charts (or VLAD and CRAM charts), Funnel Plots and Exponentially Weighted Moving Average charts. Most authors propose a selection of charts to optimise the monitoring process6,24. CUSUM and SPRT charts provide a more statistically robust analysis of performance6 while VLAD and CRAM plots provide a more intuitive overview of variation in performance that is easier to interpret from a “lay” perspective. A strength of sequential monitoring using these charts is the ability to construct a system that senses changes in outcome on a “near real time” basis (provided data are entered and analysed promptly). As such they are suitable for use in an “alarm” or “early warning” system. Funnel Plots provide analysis of individual operator performance and can often clarify whether performance variation relates to individual or systemic variations. The following outline provides a more detailed explanation of the different charts and a rationale for their use in this study.
Cumulative sum (CUSUM Charts): The use of CUSUM charts has been demonstrated in applications ranging from cardiac surgery6-9, intensive care10 and infection control25. This form of chart has the advantage over the conventional Shewhart type control chart that it is quick to detect small persistent shifts in a process. The charts used in this study follow the methodology proposed by Steiner et al26, and are based on the cumulative sum of the log likelihood ratio. The resultant sum is compared to a predefined decision threshold (‘h’) and is said to signal when the threshold is crossed. After a signal the CUSUM is reset to zero and monitoring continued. The method proposed in this study involves the use of double sided CUSUM charts that simultaneously test the hypotheses that the odds of an event occurring has increased or decreased (commonly factors of 2x and 0.5x are used). Establishment of the decision threshold ‘h’ for these charts is a balance between the need to rapidly signal a shift in performance against the rate of false alarms that arise due to chance.
Cumulative Observed Minus Expected (O-E) charts: The cumulative O-E chart is the inverted version of the Variable Life Adjusted Display (VLAD)27 or Cumulative Risk Adjusted Morbidity (CRAM)28 charts. Confidence limits can be calculated and plotted on this type of chart while Sherlaw-Johnson et al29 has proposed a scheme for applying CUSUM derived control limits onto the VLAD. This chart can be used with binary and count data and is good for visual inspection as it shows how many events more or less have been observed compared to that expected. The main advantage of the VLAD/CRAM over the CUSUM is its ease in interpretation; however, the use of both charts is proposed as the CUSUM contributes the more definitive statistical analysis. In this project, this type of chart (in the form of the VLAD/ CRAM) has been used for institution wide monitoring and when required, to review individual cardiologist performance.
Funnel Plots: The application of Funnel Plots to monitor performance quality in health care has been described by Speigelhalter30,31 and their application to interventional cardiology has been demonstrated by Kunadian et al15. Funnel Plots are a useful technique for comparison across a number of time periods, operators or institutions. The graph is constructed by plotting the measure of performance (numerator) for each unit in this application under review, against the number of cases performed (denominator), expressed as a percentage. The performance benchmark and exact binomial limits are calculated and plotted for all possible values for the number of cases and used to create the familiar Funnel Plot appearance. This chart was used for individual cardiologist review. Cardiologist performance is deemed as being consistent with the benchmark when their result falls within the “funnel”. Results below the “funnel” relate to performance that is significantly under the defined benchmark while results above the “funnel” indicate performance significantly above the benchmark.
Chart design
With all SPC charts, the choice of design parameters (e.g., benchmark rates, ‘h’ values, confidence limits etc.) is established in consultation with the users and after careful consideration of the actions to be taken should an alarm be signalled. In this study, performance benchmarks for each chart were based on the group performance for the period 2003 to 2006 for the analysis of 2007 performance while the 12 month follow-up analysis used outcomes for patients treated between 2003 and 2005 as a reference. Data relating to patients lost to follow-up have been omitted from the charts of post discharge outcomes. For the CUSUM charts, a false alarm every five years was considered acceptable and this was used to determine the ‘h’ value for the respective charts.
Results
As the number of charts generated in this review totals more than 30 discrete plots (including additional plots to review questions arising from the main analysis) we have provided an illustrative example of graphs relating to 12 month MACE. Figure 1 is the group CUSUM plot, Figure 2 the group VLAD plot and Figure 3 the individual clinician Funnel Plot.
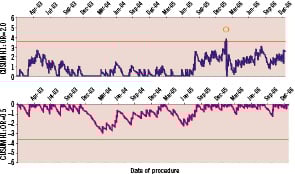
Figure 1. CUSUM for monitoring the occurrence of major adverse cardiac events at 12 months. The upper and lower graphs have been designed to detect a doubling and a halving of the odds of MACE with ‘h’ values of 3.6 (ARL0 ~ 2,500, ARL1 ~ 200) and –3.6 (ARL0 ~ 2,500, ARL1 ~ 450) respectively. The chart indicates that the MACE rate steadily increased from July 2005 and eventually signalled in February 2006.

Figure 2. Cumulative Expected - Observed (O-E) chart for monitoring the occurrence of major adverse cardiac events (MACE) at 12 months chart includes 95% confidence intervals. The expected event rate for the chart was set to the average rate for the period from the 1st January 2003 to the 31st December 2005 (4.1%). The chart demonstrates that the MACE rate has been increasing since July 2005 and at present indicates that the unit has recorded approximately 15 events more than expected.
The CUSUM and VLAD plots monitoring MACE at 12 months (Figure 1 and 2) have been configured using a benchmark expected rate of 4.1% (the average rate across the period from 1st January 2003 to 31st December 2006). The graphs indicate that the rate of events declined noticeably from December 2003 until April 2004 (although no signal resulted on the CUSUM). From April 2004 until August 2005 the MACE rate appears to settle to around the benchmark rate (the VLAD suggests that the cumulative outcome at this time is around six events less than expected). From August 2005 until February 2006 the graphs indicate that the rate of events steadily increased before a cluster of events resulted in a signal on the CUSUM indicating the odds of an event was well above the benchmark rate. The nature of the graphs in Figures 1 and 2 tend to indicate that the event rate from March 2006 is above the benchmark rate (the VLAD showing a steady negative slope) with an analysis of this data suggesting the rate is greater than 7%. It is important to note that as the trend seen in the VLAD may be due to a sequence of chance events, it emphasises the importance of supporting the qualitative information provided by this type of chart with an objective, statistically defined signal process such as the CUSUM. By the end of December 2006, the VLAD suggests that cumulative outcomes were at 15 events more than expected (a marked turnaround from July 2005). The Funnel Plot (Figure 3) comparing the MACE rate for 2006 with the expected benchmark indicates that no individual cardiologists’ performance can be identified as substantively different from the others with respect to this outcome.
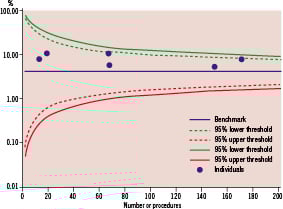
Figure 3. Funnel Plot comparing the 2006 12 month MACE rates associated with individual cardiologists to the overall average performance for the from the 1st January 2003 to the 31st December 2005 (4.1%). The chart demonstrates that the MACE rate for all clinicians is greater than the benchmark level but no clinician’s performance was in excess of the 99% upper threshold (taken to indicate performance significantly different to the benchmark).
This suggests that it is likely that the increase in MACE is attributable to a systemic change rather than a deviation in performance by an individual clinician. In this specific instance, a review suggested that a reduction in use of drug-eluting stents by the whole cardiology group may have been responsible for the deterioration in MACE.
Figure 4 shows the result of the simulation to determine the value of ‘h’ used in the CUSUM of Figure 1.

Figure 4. Graph depicting the relationship between Average Run Length (ARL), ‘h’ (left side of the graph) and odds ratio shift (right side of the graph) for the double sided CUSUM (benchmark MACE rate of 4.1%). A ‘h’ value of 3.6 provides an ARL0 of ~2500 (or a false alarm on average every 5 years) and ARL1 values of ~200 and ~450 for odds shifts of x2 and x0.5 respectively (as shown in the curve on the right that links run lengths to odds shift).
From this graph an ‘h’ value of 3.6 delivers an in-control average run length (ARL0) of ~ 2,400 procedures (or a false alarm every five years) while the out of control average run length (ARL1) for a doubling in the odds of MACE is ~ 200 procedures. Use of the same ‘h’ value in the chart monitoring for a halving in the odds of MACE results in an ARL1 for this process of ~450 procedures. Also shown in Figure 4 is the relationship between the change in odds ratio and the rate at which the CUSUM will respond.
Discussion
The introduction of SPC systems to monitor the clinical performance of individual practitioners and clinical services has been brought about through public demand for transparency in health care. A common thread in reviews into quality failings has been the absence of systems to actively and appropriately monitor performance. The role of performance monitoring, however, should not be the sole domain of government authorities charged with maintaining professional standards. Appropriately run institution centred programs, used as an adjunct to the more traditional case based mortality and morbidity review processes for major adverse events19, can enhance these broader based programs by removing the delays imposed in the reporting of data off site for analysis and review. The opportunity also exists for clinician led teams to leverage these tools for optimising clinical performance rather than simply demonstrating minimum acceptable standards of performance. This has the benefit of improving the link between changes in clinical practice and defined outcome measures.
To this end we have applied SPC retrospectively to a prospectively collected database to begin to develop a system for performance monitoring of PCI outcomes. In establishing this system three main issues were considered. These comprised:
1. The selection of measures appropriate to the task of monitoring variations in quality of the service,
2. The design and establishment of a set of tools with the sensitivity to detect meaningful variations in performance, and
3. The establishment and empowerment of a governance structure to influence design of the tools and manage performance issues (both good and poor) arising from the monitoring program.
Performance measures
In assessing the available performance measures, consideration was given not only to whether the measures were clinically meaningful (fulfilling the criteria defined by Shahian et al18) but also whether they occurred at a sufficient frequency to be useful for inclusion in a control chart based clinical performance monitoring scheme. For example, in our database, procedural mortality is a low frequency event (occurring at a rate of 0.19% across the period under review). This rate most likely reflects the low number of cardiogenic shock32 presentations in our current practice. Consequently, for our institution, monitoring procedural mortality is best dealt with via a more traditional mortality review process as SPC tools are technically suited to event rates >1%. In other facilities having a higher rate of acute ST elevation myocardial infarction and cardiogenic shock, the procedural mortality rate may be high enough to enable independent monitoring of this outcome with SPC techniques.
In our application, we found procedural failure (event rate 2.63%) to be a more readily useful marker of “in-hospital” performance. Similarly, we found TLR and MACE to be better measures of performance variation at 30 days and 12 months, rather than isolated measures of mortality, MI and target lesion CABG or PCI. Although the choice of measures (individual and aggregated) for inclusion in a performance monitoring program at our facility has been limited by event rate to mainly aggregated measures, use of these parameters might not be the sole options when these charting techniques are applied to a database which incorporates patients who are at high risk for adverse outcomes.
However, one of the challenges in extending data capture and monitoring into the post discharge period is the issue of incomplete patient follow-up. This is particularly an issue for a supra-regional tertiary referral hospital where patients may return to remote rural and regional location and are not routinely followed up by the treating cardiologists at 12 months post discharge from the hospital. The facility under study currently runs at an overall follow-up rate at 12 months of 87.9%. A consequence of incomplete follow-up is that signals (positive and negative) arising from charts monitoring this phase of a patient’s recovery may be due to bias in data capture rather than actual changes in patient outcomes. A solution to this would be to monitor and potentially correct for this bias in the characteristics of patients captured in the follow-up period. The methodology for achieving this is the subject of current research which will draw upon the experience gained by others in dealing with incomplete follow-up data sets associated with, for example, longitudinal studies33,34.
Whilst it may be attractive to establish a seemingly comprehensive system of control charts to track all available parameters to monitor technical and clinical performance, developers of these systems must be aware of the issue of multiple testing35. Put simply, the more comparisons applied to testing a hypothesis, the more likely at least one of the tests will result in a significant finding. A balance must therefore be struck between the desire to implement a broad based monitoring program and the increased likelihood of falsely signalling a change in performance through over testing. Investigation of appropriate techniques for dealing with control charts monitoring processes involving multiple (correlated) measures of performance is an area of active research which will draw upon methods developed for industrial applications36 and surveillance37.
Governance issues
As shown in Figures 1-3, for each parameter monitored, CUSUM charts (for their statistical analysis) and VLAD charts (for their intuitive feedback), were constructed to review group performance over time. Funnel Plots and VLAD charts were constructed to monitor outcomes linked to individual clinicians. This combination of charts has been decided upon due to the relatively low event rates associated with these procedures and the modest procedural volumes of some of the individual operators.
As the intent of this paper is to primarily demonstrate the viability of the use of SPC to monitor the delivery of PCI services, we do not intend to provide a critical review of any significant variations in individual clinician or group performance. It is important, however, to discuss the broader issues associated with the implementation of this type of system.
In any performance review of individuals, the process of monitoring must be associated with a process of engagement of the individuals themselves, in this case clinicians, such that there is an agreement to participate in a monitoring process. This engagement is important for two reasons. Firstly, the choice of parameters to monitor and the fundamental design specifications of the monitoring process (magnitude of parameter change to detect and tolerance to false signals) should be predetermined through consultation with the physicians themselves with a clear understanding of the actions to be taken in the event a signal arises (these clinically based decisions will then be used to inform the technical design of the charts). Secondly, cooperative participation of physicians should be with an understanding that the results will not only be part of an accreditation audit process but will also provide helpful educational feedback for all concerned. If used in such a manner, SPC might complement traditional “mortality and morbidity” reviews, which are by their nature retrospective, with the potential for SPC to provide near “real-time” analysis of performance.
We would suggest the following clinician led algorithm (based broadly on the approach described by Mohammed et al38) for action in response to a chart “signal”:
1. Audit of accuracy of data collection which led to the signal “event”. A limitation of our study, and of any registry study, is that a number of the measures are sensitive to data collection completeness, interpretation and accuracy, and therefore, a critical part of the process concerns both the relevance and utility of the database fields and the accuracy of prospective data collection.
2. Examination of risk parameters for the patient population over the time leading up to the signal to determine if an adverse outcome has arisen due to a marked change in the underlying risk factors of the patients being monitored. An appropriately calibrated risk adjustment tool for the population could be incorporated into the various charting schemes to reduce this effect.
3. Feedback report of any valid signal (not attributable to data error or variation in risk) to the clinical group or individual operator and the institution clinical quality control body. A system might include more than one ‘h’ level to indicate varying degrees of certainty associated with performance changes.
Use of this algorithm would provide clinicians with prompt notification of a change in outcomes associated with variations in performance or changes (intended or otherwise) to clinical practice.
Risk adjustment could also be incorporated into the charts proposed in this paper. It is highly desirable that common-cause sources of variation should be taken into account in this manner, to allow focus on special-cause variation only. Outcome is dependant on pre-procedural risk variables and a number of risk models39-45 have been developed for PCI, although the majority of these relate to “in hospital” risk rather than to the 30 days and 12 months outcome. To be effective, however, the risk adjustment used must be well calibrated to the population being monitored as poorly calibrated risk adjustment can render the use of SPC techniques unreliable. For the purposes of this paper, we note that the demographics for our study population and the known measure of procedure complexity were relatively stable through the period of observation and include a population which is at relatively low risk for adverse PCI outcomes, according to current risk models. Hence risk adjustment of our population is not as critical as it would be in a population with high risk features or significant risk variations. We are exploring the incorporation of prospective risk models into the database and this may further refine our ability to discriminate performance quality variations, including not only “in hospital” outcomes but also the 30 days and 12 months outcomes.
Medical informatics and decision support can play an important role in outcomes monitoring and quality improvement in the delivery of healthcare services, particularly through the provision of rapid feedback of accurate and reliable SPC information to those working at the patient. We have developed and are implementing a statistical process control based system to monitor clinical performance and patient outcomes in hospital, at 30 days and at 12 months. The ability to critically evaluate variations in patient outcomes at 12 months is particularly relevant for patients undergoing PCI. The system we propose has the potential to promptly detect and signal real changes in clinical performance relating to PCI procedures within an institution. Strengthening the link between changes in clinical practice and patient outcomes via a rapid and sensitive feedback system, combined with a structured management system at both clinical and institutional levels, can contribute to significantly enhanced patient care.