Abstract
Aims: There is a lack of a reliable technique to quantify coronary artery calcification (CAC). Hence, we used optical coherence tomography (OCT) to quantitate three-dimensional CAC volume to examine its association with plaque characteristics.
Methods and results: A total of 250 patients with stable angina undergoing OCT imaging before PCI were included. CAC volume was calculated from every frame of the culprit lesion and divided into tertiles (low, intermediate and high). Quantitative calcium characteristics were assessed in 107 patients who underwent both OCT and IVUS. Increase in CAC volume was associated with reduced lipid volume index, lipid length and number of lipid plaques. Diabetes and LDL cholesterol predicted less coronary calcification whereas age and prior MI predicted increased CAC after adjusting for all clinical factors. Lipid volume index (ρ=–0.001 [–0.003 to –0.00003]; p=0.04) and mean calcium depth (ρ=–0.02 [–0.02 to –0.01]; p=0.000) were inversely related to CAC volume after adjusting for all OCT characteristics, whereas cap thickness increased with increase in CAC volume (ρ=0.01 [0.002-0.03]; p=0.02) only in unadjusted analysis. Regression analysis demonstrated a significant correlation between calcium length (ρ=0.83; p<0.001) and calcium arc (ρ=0.86; p<0.001) measured by IVUS and OCT.
Conclusions: Target lesions with high CAC volume are characterised by reduced plaque lipid content and calcium closer to the luminal border. Fibrous cap thickness increased with increase in calcium volume.
Abbreviations
ACS: acute coronary syndrome
ANOVA: one-way analysis of variance
CAC: coronary artery calcification
CSA: cross-sectional area
IVUS: intravascular ultrasound
OCT: optical coherence tomography
PCI: percutaneous coronary intervention
QCA: quantitative coronary angiography
TCFA: thin-cap fibroatheroma
Introduction
Despite advances in diagnosis and management, acute coronary syndrome (ACS) still remains the leading cause of mortality and morbidity in the USA and worldwide1. Our understanding of the pathophysiology of ACS has evolved tremendously and involves a delicate balance between endothelial dysfunction, thrombogenicity of the blood and activation of inflammatory biomarkers through different cascades2. Acute thrombosis and plaque rupture remain the most common reasons for sudden cardiac death and acute myocardial infarction3. Although the progression of an atherosclerotic lesion is unpredictable, certain morphological features including fibrous cap thickness of atheroma, necrotic core size and degree of inflammation play a key role in determining plaque stability and rendering the plaque vulnerable4. Coronary artery calcification (CAC) is a feature of advanced atherosclerosis5. Its clinical implications in and around the region of an atheroma are still unclear6. It may influence biomechanical stress and plaque stability when present close to or within the lesion7. The fact that there are no reliable techniques to quantify the extent of CAC in vivo poses an additional challenge to the study of the relationship between coronary calcification and plaque morphology. Intravascular ultrasound (IVUS) has been used to study CAC8 and differing patterns of calcification in ACS, namely ST-segment elevation myocardial infarction (STEMI), non-ST-segment elevation myocardial infarction (NSTEMI) and unstable angina9, but has limited ability due to poor spatial resolution and high reflection. Kataoka et al analysed the relation between spotty calcification and plaque vulnerability in vivo using optical coherence tomography (OCT)10. However, volumetric analysis of CAC, a more accurate measure of coronary calcium, has not been performed using OCT. Hence, in this study we used OCT to estimate the three-dimensional CAC volume in vivo to examine the association of CAC volume with plaque characteristics and clinical profile.
Methods
STUDY POPULATION
We performed a retrospective analysis of prospectively collected data of 250 consecutive patients from the institutional review board-approved clinical and imaging database with stable coronary artery disease (CAD) referred to the Mount Sinai Cardiac catheterisation lab from 2012 to 2014 and who also underwent OCT imaging prior to percutaneous coronary intervention (PCI). All lesions represented de novo atherosclerosis. Analysis was restricted to the target vessel. Patients with renal failure (serum creatinine >1.5 mg/dl), haemodynamic compromise, contrast allergy, and aorto-ostial coronary artery lesions were excluded. Subset analysis comparing CAC assessments within the same lesion was performed in patients who underwent both OCT and IVUS examination (n=107).
OCT IMAGE ACQUISITION
OCT image acquisition was performed with a commercially available OCT intravascular imaging system (C7 Dragonfly™; St. Jude Medical, St. Paul, MN, USA). The catheter was placed at least 10 mm distally to the imaging target lesion with continuous intracoronary contrast injection (Visipaque™; GE Healthcare, Chicago, IL, USA), total volume 12-16 ml injected at 3-4 ml/sec) and simultaneous OCT catheter pullback at 20 mm/s.
OCT IMAGE ANALYSIS
Images were analysed at 1 mm intervals as validated before using the St. Jude Medical Offline Review Workstation11-13. The smallest cross-sectional area (CSA), reference CSA, and percent lumen area stenosis were calculated for each lesion. OCT reference lumen CSA was estimated as the average value of proximal and distal references defined as the largest lumen proximal or distal to a stenosis but within the same segment. Lipid arc was measured at 1 mm intervals through the entire length of the lesion and lipid length was measured on longitudinal view. Lipid volume index was calculated as the averaged lipid arc multiplied by lipid length14. Fibrous cap thickness was estimated by measuring the thinnest signal-rich zone separating the lipid content from the vessel lumen in the entire stenosis. OCT thin-cap fibroatheroma (OCT-TCFA) was defined as a plaque with lipid arc >90° and fibrous cap thickness <65 µm. Plaque rupture was defined as the presence of discontinuity in the fibrous cap leading to a communication between the inner (necrotic) core of the plaque and the lumen11,15. Three different OCT analysts reviewed OCT pullbacks independently at intervals of at least two weeks by the first observer to assess for interobserver variability.
CALCIUM ANALYSIS
Each frame of the OCT images was analysed for coronary calcification as previously validated16,17 using the St. Jude Medical Offline Review Workstation. Areas with poor signal and well-defined borders were classified as calcified plaques. The degree of circumferential extent of calcification was quantified, and average and maximal calcification arc was calculated for each lesion. Calcification length was calculated by multiplying the number of consecutive cross-sections containing calcification by slice thickness. Calcium depth was defined as the minimal distance between the luminal border of the calcific plaque and the lumen contour; mean and minimal calcium-lumen distance was calculated for each calcification. Calcium volume was calculated by Simpson’s rule and by area measurements from every single frame (Figure 1). Calcified plaques seen by OCT were separated into two groups according to the ability to identify the abluminal calcium border (group A) (Figure 2) or requirement to interpolate tracings in cases where the abluminal border was not visualised (group B) (Figure 3). An independent observer performed CAC volume assessment in 50 OCT pullbacks to assess reproducibility.
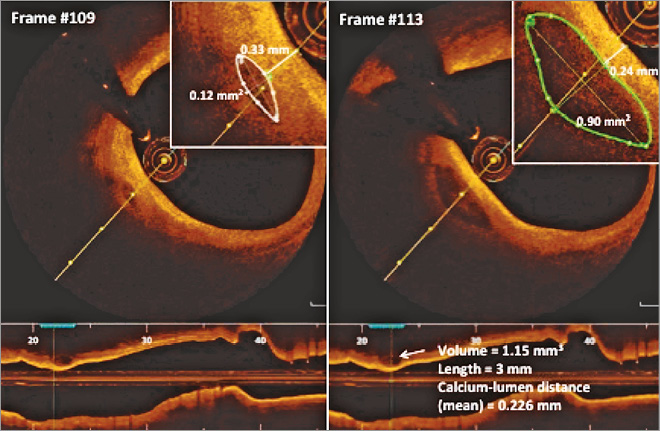
Figure 1. Volumetric characterisation of human coronary calcium in different frames by optical coherence tomography.
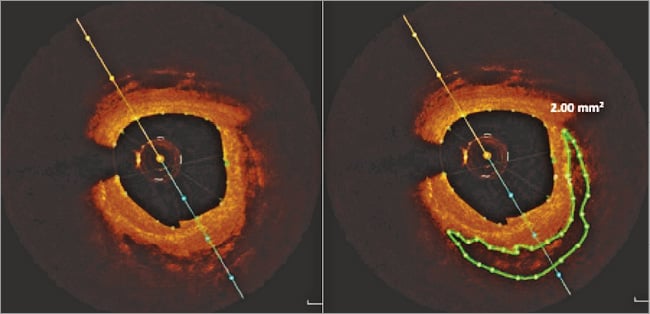
Figure 2. Volumetric assessment of group A calcium.
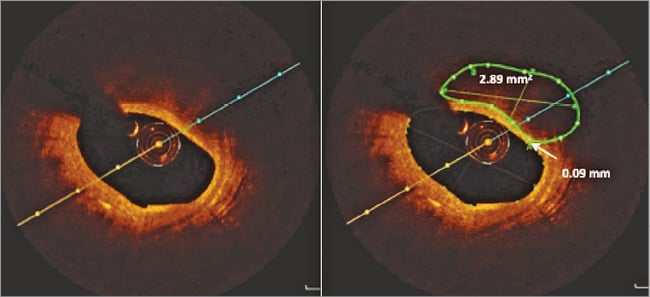
Figure 3. Volumetric assessment of group B calcium where tracing interpolation is required.
IVUS IMAGE ANALYSIS
Quantitative greyscale IVUS analysis was performed using QIvus 3.0 (Medis, Leiden, the Netherlands) according to the ACC consensus statement18 and as previously described12,13 to estimate lumen and reference CSA, external elastic membrane (EEM) CSA, plaque plus media CSA, plaque burden, and the remodelling index (lesion EEM CSA/reference EEM CSA).
STATISTICAL ANALYSIS
Continuous measurements were reported as mean±SD if normally distributed and median (interquartile range) for non-parametric variables. One-way analysis of variance (ANOVA) and the Kruskal-Wallis test were used for comparing parametric and non-parametric continuous measurements. Categorical variables were expressed as frequency (percentages) and the chi-sqaure test was used to compare between the calcium tertiles. Unadjusted and multivariable adjusted linear regression analysis was performed to examine the independent predictors of CAC. Bland-Altman analysis and regression analysis were performed to compare the mean differences (bias) and standard deviation between OCT and IVUS-defined maximal calcium arc and length19. Interobserver agreement and intraobserver reproducibility of imaging parameter measurements were assessed by intraclass correlation coefficients (ICC) based on the random effects analysis of variance models20. All statistical analysis was performed using Stata/SE 11.0 (StataCorp LP, College Station, TX, USA).
Results
PATIENT CHARACTERISTICS AND OCT IMAGE ANALYSIS
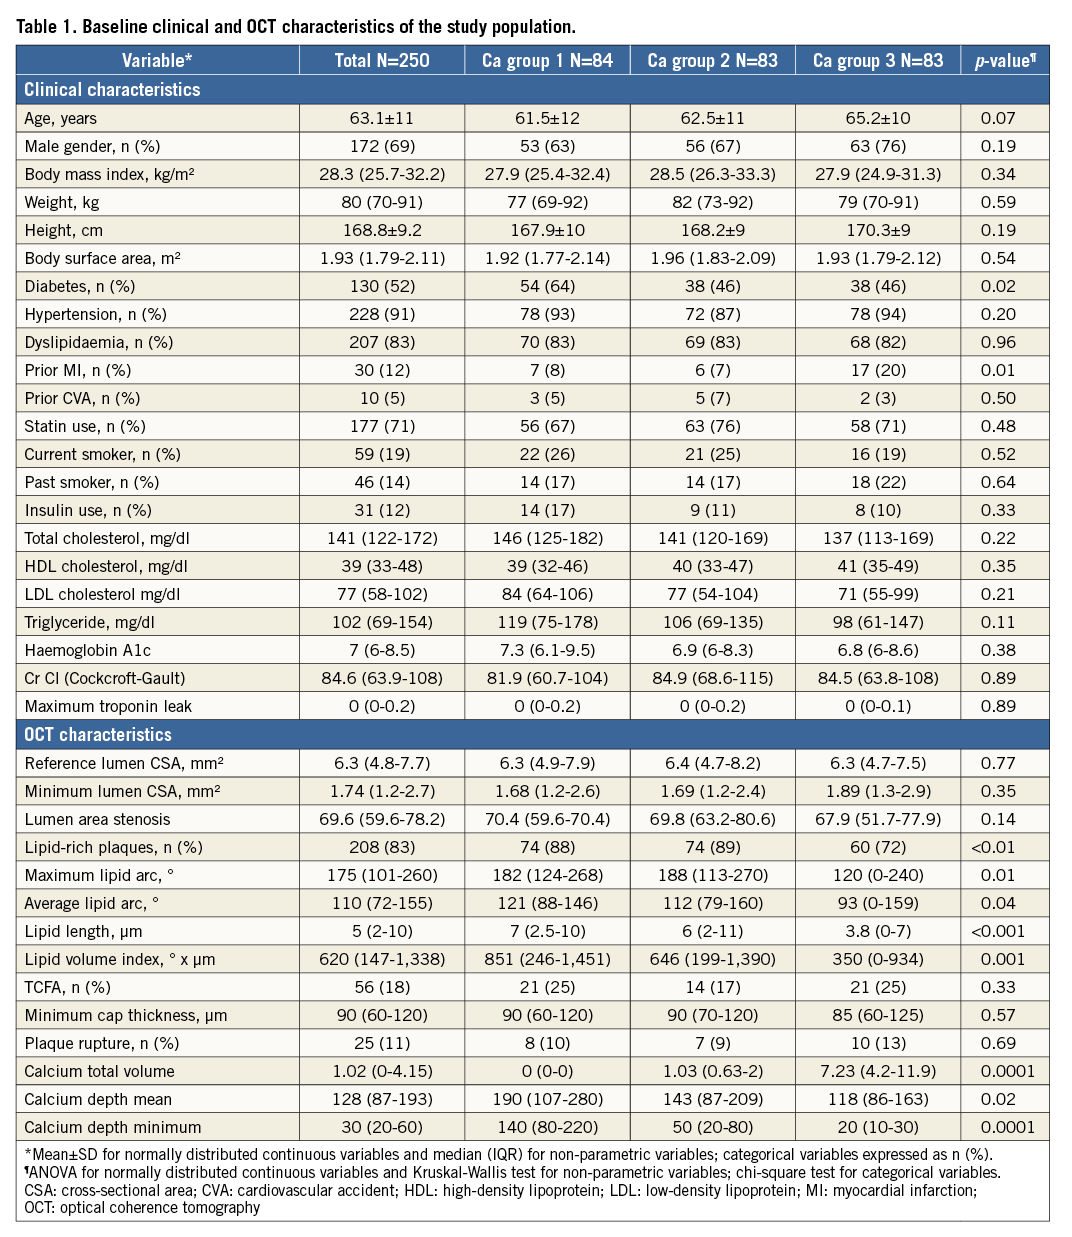
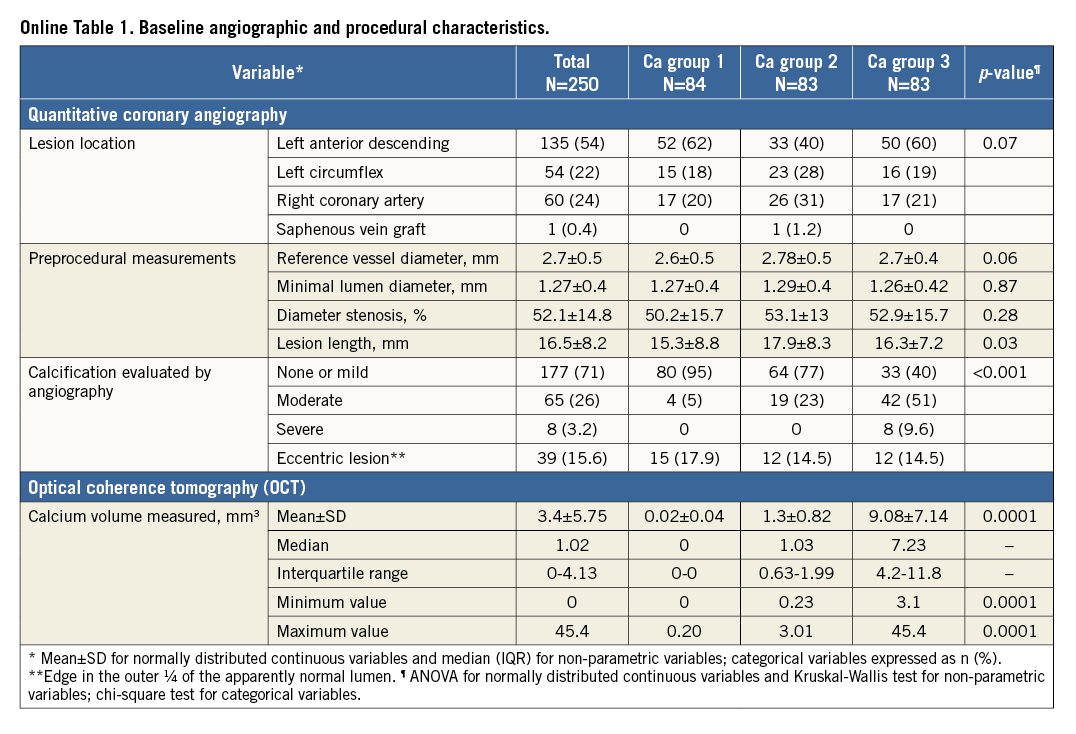
Table 1 shows the baseline clinical and OCT characteristics of the 250 patients included in this study. Target lesions were divided into tertiles according to CAC volume (low 0.01±0.04, intermediate 1.14±0.7, and high 7.1±5.4 mm3; p<0.0001). Other baseline angiographic and procedural characteristics are described in Online Table 1. A trend towards an increase in coronary calcification was seen with an increase in age (p=0.07) and in males (p=0.19). Diabetes (p=0.02) was low in prevalence with increase in CAC. Patients who had a prior history of MI (p=0.01) had significantly increased coronary calcification. No relationship was observed with body habitus, renal function and CAC. Increase in CAC volume was associated with a significant decrease in lipid content, including number of lipid plaques (p<0.01), maximum (p=0.01) and average lipid arcs (p=0.04), lipid volume index (p=0.001), and lipid length (p<0.001). However, there was no significant difference between lumen area, minimal cap thickness of atheroma and plaque rupture. The depth of the calcium from the luminal border decreased with increase in CAC volume (p=0.02). Eight percent (8%) of lesions (n=20) required interpolation, out of which only 28% of frames (number of frames=198) within these lesions were group B lesions. The mean values for the total calcium volume by observer 1 (P. Krishnamoorthy) and observer 2 (H. Ueda) were 2.95±5.76 mm3 and 2.93±5.99 mm3, respectively. Bland-Altman analysis demonstrated high agreement for the measurement: mean difference (standard deviation) was –0.019±0.66 mm3 (Online Figure 1). The intraclass correlation coefficient for interobserver and intraobserver variability for the maximum lipid arc was 0.98 (95% CI: 0.93-0.99) and 0.99 (95% CI: 0.96-0.99), respectively; for fibrous cap thickness it was 0.96 (95% CI: 0.87-0.99) and 0.98 (95% CI: 0.93-0.99), respectively.
PREDICTORS OF CAC VOLUME
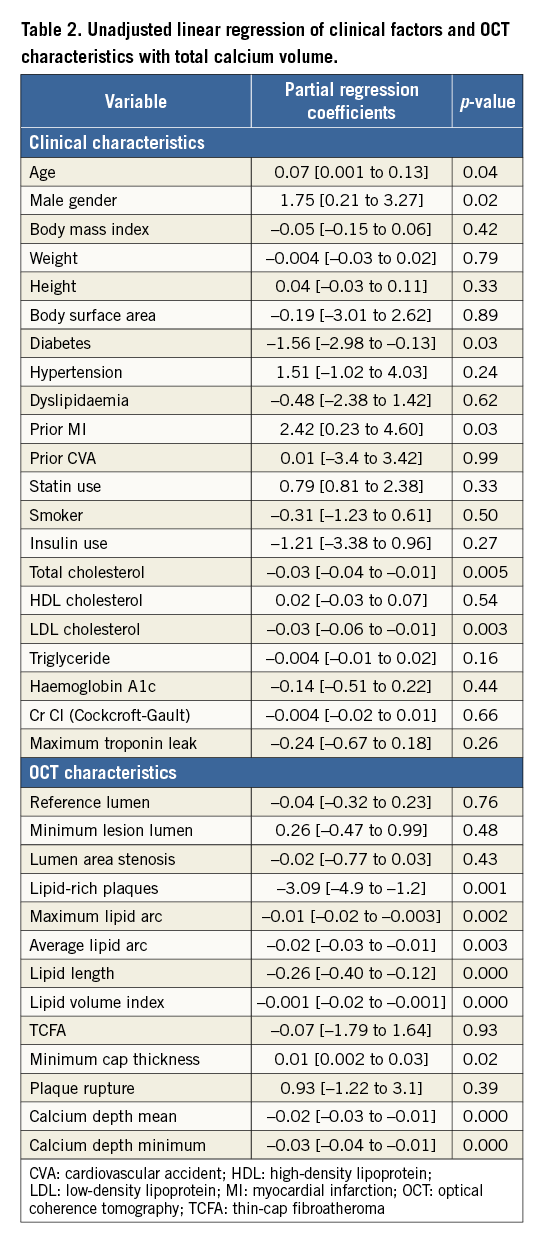
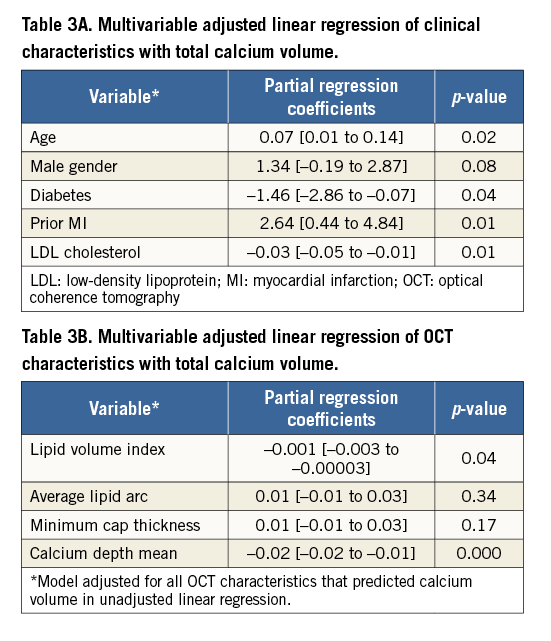
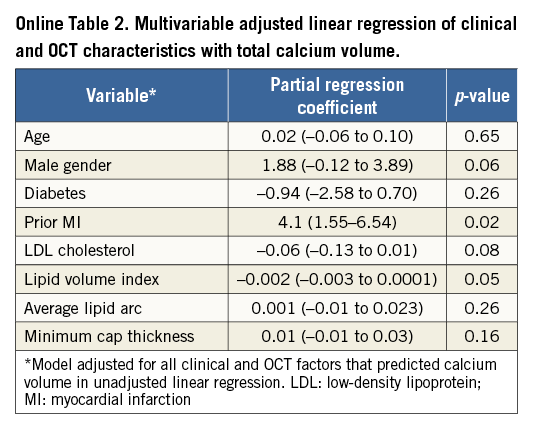
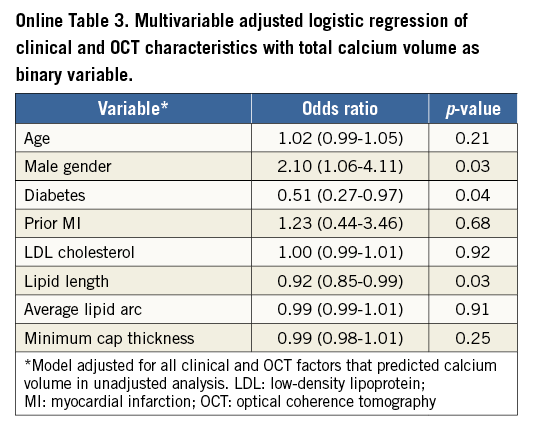
Table 2 describes the unadjusted linear regression of clinical factors and OCT characteristics with CAC volume as dependent outcome. Age (0.07 [0.001 to 0.13]), male gender (1.75 [0.21 to 3.27]) and prior MI (2.42 [0.23 to 4.60]) predicted increased coronary calcification whereas diabetes (–1.56 [–2.98 to –0.13]), total (–0.03 [–0.04 to –0.01]) and LDL cholesterol (–0.03 [–0.06 to –0.01]) predicted less CAC. Consistent with prior findings in Table 1, lipid content was inversely associated with coronary calcification including lipid volume index (–0.001 [–0.02 to –0.001]), number of lipid-rich plaques (–3.09 [–4.9 to –1.2]), maximum (–0.01 [–0.02 to –0.003]) and average lipid arcs (–0.02 [–0.03 to –0.01]) and lipid length (–0.26 [–0.40 to –0.12]). Increase in CAC volume was associated with an increase in minimal fibrous cap thickness of atheroma (0.01 [0.002 to 0.03]). Calcium depth from the luminal border decreased with increase in CAC volume. When adjusted for all confounding clinical factors in the multivariable linear regression (Table 3A), age (0.07 [0.01 to 0.14]) and prior history of MI (2.64 [0.44 to 4.84]) still predicted more CAC, while diabetes (–1.46 [–2.86 to –0.07]) and LDL cholesterol (–0.03 [–0.05 to –0.01]) were associated with less CAC. Among the OCT characteristics (Table 3B), depth of calcium (–0.02 [–0.02 to –0.01]) and lipid volume index (–0.001 [–0.003 to –0.00003]) remained independent predictors of the extent of CAC. When adjusted for both clinical and OCT factors in the same model, prior MI (4.1 [1.55 to 6.54]; p=0.02) and lipid volume index (–0.002 [–0.003 to 0.0001]; p=0.05) were still significantly associated with CAC (Online Table 2). Online Table 3 shows multivariable regression analysis adjusted for both clinical and OCT characteristics when total calcium volume was analysed as a binary variable.
CAC ASSESSMENT BY OCT AND IVUS
In 107 patients who underwent both IVUS and OCT examination, there was no difference in the prevalence of calcified plaques detected by OCT (79; 74%) and IVUS (74; 69%) (p=0.61). The maximal arc of calcium was 108.1±82.2° by OCT and 103.8±85.0° by IVUS, while calcium length was 3.6±3.8 mm and IVUS 4.3±4.2 mm by OCT and IVUS, respectively. Regression analysis demonstrated a significant correlation between calcium length (ρ=0.83; p<0.001) and calcium arc (ρ=0.86; p<0.001) measured by IVUS and OCT, respectively. Bland-Altman plots of mean calcium arc and length by OCT and IVUS imaging did not show any significant difference (Online Figure 2, Online Figure 3). Correlation between CAC assessment by QCA and OCT is shown in Online Figure 4A and 4B.
Discussion
We present the results from what we believe is the first study to assess three-dimensional volumetric CAC using OCT. Key findings include the following. 1) CAC volume was inversely associated with lipid volume in the plaque. 2) CAC volume was lower in diabetics. 3) Lesions with increased CAC were more likely to be closer to the vessel luminal border. 4) Increase in CAC was associated with increase in cap thickness although only in unadjusted analysis. 5) There was a strong correlation between coronary calcium measured by OCT when compared to IVUS imaging.
We demonstrated an inverse relationship between CAC and lipid volume present inside a plaque in vivo. Decrease in lipid plaque content by the use of statins could stimulate more macrophages, vascular smooth muscle cells and osteoclast-like cells, resulting in increased calcification by generating extracellular matrix21. This finding is also consistent with a recently published post hoc patient-level analysis of coronary calcium volume using IVUS from eight different prospective RCTs where the use of statins was associated with an increase in coronary atheroma formation independent of their effects on plaque regression22. This could also potentially explain the results seen from prior studies that the use of statins was not effective in decreasing the CAC score as assessed by electron beam computed tomography (EBCT)23,24.
In our study, we observed that diabetes predicted less CAC volume in both univariate and multivariable regression analysis. This conflicts with previous findings and a common notion that increased CAC volume and progression of vascular calcification is commonly seen in diabetes25 and is closely related to cardiovascular outcomes and mortality26. Plaque morphology analysis showed a trend suggestive of unstable and vulnerable plaque characteristics in diabetics vs. non-diabetics (lipid volume index x μm 947 vs. 762; cap thickness μm 96 vs. 104) although this did not reach statistical significance. However, there was a significantly decreased calcium volume in these patients (2.7 vs. 4.2 mm3; p=0.01). Hence, we hypothesise that diabetes was related to small calcifications with a spotty distribution pattern and thin fibrous cap with increased lipid core as seen in the culprit lesions of patients with acute coronary syndrome rendering the plaque unstable27,28. This is similar to findings from an institutional OCT imaging registry-based analysis of spotty calcification and plaque vulnerability in patients with stable CAD in which, however, total calcium volume was not assessed10.
Our data also suggest that increase in calcium volume was not only associated with decreased plaque lipid burden but also an increase in fibrous cap thickness, although the latter finding was observed only in unadjusted analyses. This is similar to findings from other studies which showed that calcified plaques are more quiescent and passive compared to plaques with increased lipid burden and are more likely to be present in patients with stable CAD29. Also, in another IVUS-based intracoronary calcium analysis using calcium arc area in patients with stable CAD and acute coronary syndrome, culprit lesions of patients with stable angina pectoris had the highest calcium volume compared to unstable angina and acute myocardial infarction9. Hence, increased calcification within the plaque could lead to a decrease in mechanical stress and increase in plaque stability, thus making it less vulnerable7.
Limitations
An important limitation of this study is its retrospective nature. Thus, our results cannot be interpolated to assess the causal temporal relationship between CAC and lipid volume in patients with stable CAD. Also, there are no follow-up clinical data available at this time to translate these findings into any clinical outcome difference in patients with different calcium volume. Finally, there could be selection and collider-stratification bias as the OCT was performed based on the operator’s discretion.
Conclusions
In patients with stable CAD, culprit lesions with increased coronary calcification by OCT are characterised by reduced plaque lipid content. Plaque cap thickness increased with increase in calcium volume. Further ongoing studies linked with clinical outcomes are essential to understand the implications of our findings from this study better.
| Impact on daily practice This study demonstrates a paradoxical relationship between CAC volume and lipid content independent of statin use which is important as current medical therapy is directed by total calcium burden. This study also demonstrates a similar inverse relationship between LDL cholesterol and CAC independent of statin use. Increase in calcification was associated with denser plaque (increase in atheroma cap thickness) resulting in plaque stability, although this association became insignificant after adjusting for other confounding factors. |
Conflict of interest statement
The authors have no conflicts of interest to declare.
Supplementary data
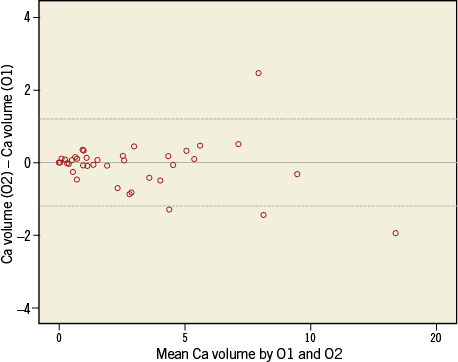
Online Figure 1. Bland-Altman analysis of calcium volume (mm3) by two independent observers.
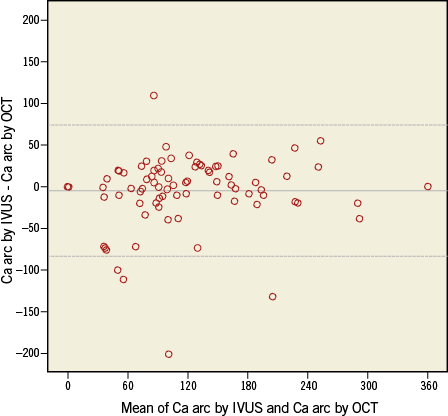
Online Figure 2. Bland-Altman plots of mean calcium arc by IVUS and OCT imaging. Middle line corresponds to the mean difference; dotted lines represent ±1.96×SD. IVUS: intravascular ultrasound; OCT: optical coherence tomography
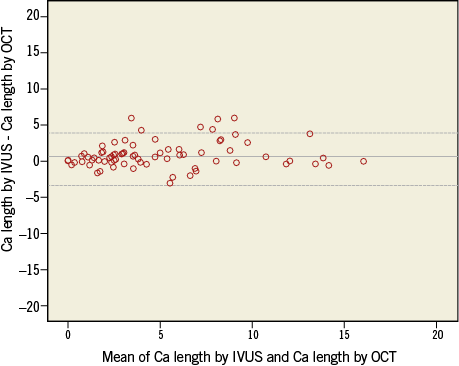
Online Figure 3. Bland-Altman plots of mean calcium length by IVUS and OCT imaging. Middle line corresponds to the mean difference; dotted lines represent ±1.96×SD. IVUS: intravascular ultrasound; OCT: optical coherence tomography
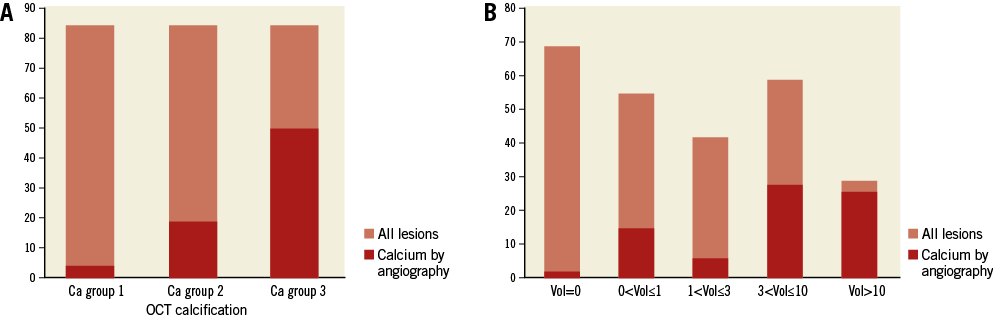
Online Figure 4. Calcification. A) Calcification identified by QCA vs. OCT. OCT calcification: Ca group 1 Ca group 2 Ca group 3. B) Calcification identified by QCA by OCT calcium volume (mm3). OCT: optical coherence tomography; QCA: quantitative coronary angiography