
Abstract
In the early days of coronary angiography, the precise quantification of luminal narrowing was challenging. The introduction of balloon angioplasty (percutaneous transluminal coronary angioplasty [PTCA]) by Andreas Grüntzig in 1977 was perhaps the greatest incentive to the development of quantitative coronary angiography (QCA). QCA has played a crucial role in evaluating interventional techniques and assessing the results of new technologies. With the advent of drug-eluting stents (DES), QCA metrics such as late lumen loss and diameter stenosis (restenosis) proved to be instrumental in assessing new technologies. Refinements in QCA with the advent of dedicated bifurcation analysis and three-dimensional (3D) QCA have broadened the application of QCA. Beyond angiographic metrics, new developments in the field of QCA have introduced the functional component in the assessment of coronary lesions. Angiography-derived fractional flow reserve (FFR) may be a good tool for diagnosing ischaemia-producing lesions in patients with non-complex coronary artery disease. Furthermore, the incremental functional information can be used to expand the traditional late lumen loss (LLL) and restenosis concepts.
Introduction
Coronary angiography has evolved continuously over the past decades. The understanding of the fractal geometry in the coronary tree coupled with the incremental information coming from intracoronary imaging, and the simulation of physiologic parameters have further refined the technique. This manuscript aims to review the history and developments in the field of coronary angiography. The current clinical applications including the recent advent of angiography-derived fractional flow reserve (FFR) are detailed and future perspectives of coronary angiography are discussed.
Historical perspective
In 1959, the technique of selective coronary angiography was introduced by Mason Sones. It gained widespread acceptance, becoming the gold standard for assessing obstructive coronary artery disease (CAD). In the early days of coronary angiography, the precise quantification of luminal narrowing was challenging. The pioneer angiographers were urged to read films played at rapid frame rates. Stopping the film usually resulted in a blurry image difficult to interpret1. Image quality improved rapidly, allowing automatic quantification of the degree of stenosis. The introduction of balloon angioplasty (percutaneous transluminal coronary angioplasty [PTCA]) by Andreas Grüntzig in 1977 was perhaps the greatest incentive to the development of quantitative coronary angiography (QCA). In the initial experience, Grüntzig used to measure the luminal gain obtained after PTCA on optically magnified images2. The advances in medical therapy for atherosclerosis with the promise of plaque regression also demanded an objective and reproducible approach to describe coronary dimensions accurately3.
By the mid 1980s, the group at the Thoraxcenter in Rotterdam under the leadership of Hans Reiber and Patrick W. Serruys developed an algorithm for contour detection based on the average weighted sum of the first- and second-derivative values in the brightness level function and applying the so-called minimal cost contour detection algorithm4,5. This algorithm was shown to be robust and is still used in current QCA software packages (Figure 1)6. In the early 1990s, the advent of digital recording format (Digital Imaging and Communications in Medicine [DICOM]) dramatically changed our practice and QCA analysis7,8.
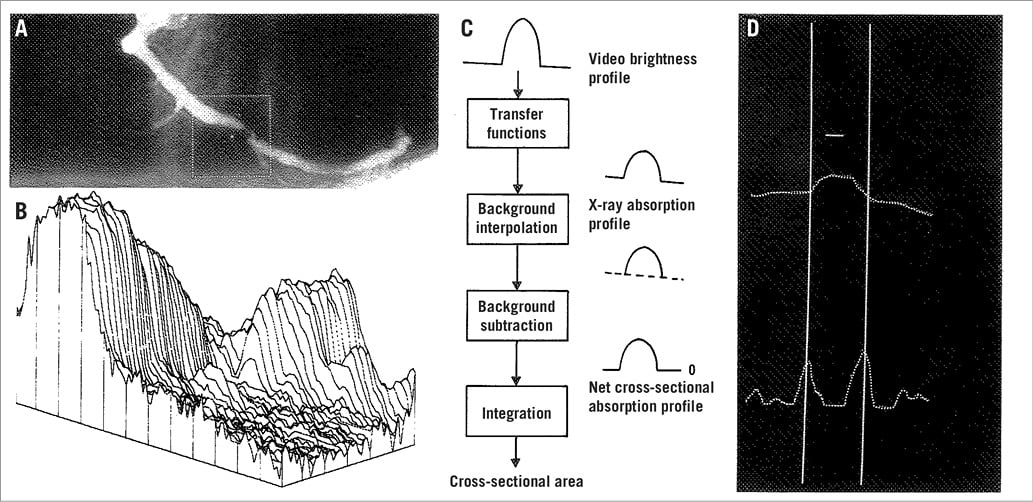
Figure 1. Basic aspects of the densitometric technique. A) A matrix is placed over the area selected for analysis from the right coronary angiogram encompassing a severe coronary obstruction. B) Pseudo 3-dimensional representation of the brightness information within the matrix. The coronary artery can be recognised as a mountain ridge with a deep pass at the site of the obstruction. C) This flow chart of the analysis indicates the main procedures followed for the computation of the densitometric area function. D) The brightness profile along one particular scanline is plotted. Positions with maximal values of the sum of the first and second derivative functions left and right of the centre positions of the artery correspond with the edge positions of the artery. (Reproduced from Serruys et al6)
QCA has played a crucial role in evaluating interventional techniques and assessing the results of new technologies. The application of QCA to the investigation of coronary stents led to the description of late lumen loss and percent diameter stenosis (and restenosis), metrics accepted by the community as efficacy endpoints9. Late lumen loss (LLL) has been shown to be associated with clinical events at long-term follow-up10. With the advent of drug-eluting stents (DES) in the early 2000s, QCA proved to be instrumental in assessing the suppression of neointimal hyperplasia. Contemporary trials evaluating the efficacy of newer DES relied on the concept of LLL to compare these technologies with previous generations. Furthermore, the regulatory agencies in Europe, Asia and the United States of America request the assessment of LLL and restenosis rate as part of the clinical development programmes for devices9.
In parallel, significant progress in X-ray imaging technology was achieved. Improvements of image quality enabled procedural image guidance with online QCA, biplane imaging systems improved the safety of percutaneous coronary interventions (PCI) by reducing the amount of contrast and radiation, and rotational angiography allowed advanced three-dimensional (3D) imaging. The developments in the field of QCA are shown in Figure 2.
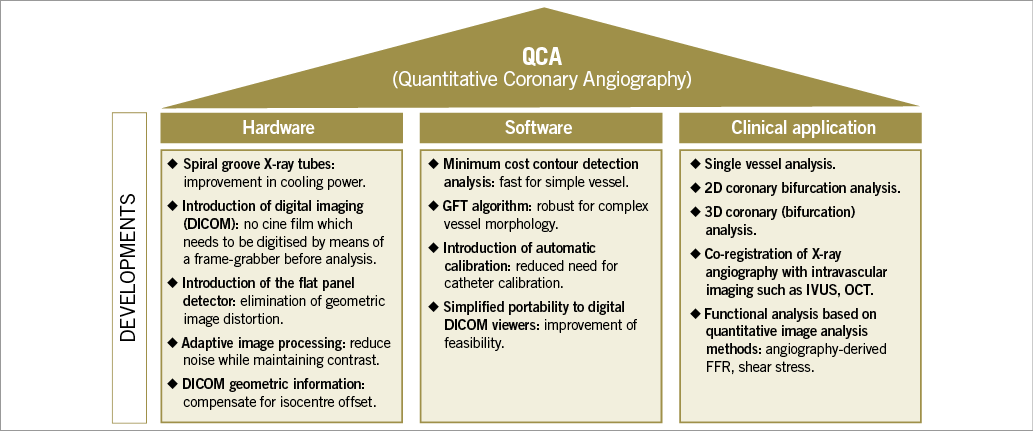
Figure 2. Developments in the field of (quantitative) coronary angiography.
Coronary angiography: present state
Since the late 1970s, it has been recognised that visual estimation of stenosis severity is unreliable, with marked intra- and inter-observer variability11,12. QCA has been shown to provide an objective tool of coronary lesion severity quantification using a reproducible methodology6,13. Although QCA parameters have been widely used as a clinical and, more commonly, as a research tool, QCA has its inherent limitations.
“LUMINOGRAM”
One of the most obvious limitations is that visualisation on angiography is limited to the contrast-filled lumina of the coronary arteries. Such a “luminogram” is therefore unable to evaluate the total plaque burden (total vessel area minus lumen area), or processes such as expansive and constrictive remodelling, which are typical for the pathophysiology of atherosclerosis14. Intravascular imaging, especially intravascular ultrasound (IVUS), could be utilised to analyse this process in vivo. Moreover, although it is suitable to analyse the loss in lumen diameter after stent implantation, the angiographic luminogram is unable to analyse the tissue which is overgrowing between and on top of the stent struts. Optical coherence tomography (OCT), an intravascular imaging modality using infrared light, has shown that different types of tissue overgrowth can be visualised, including neointimal hyperplasia and neoatherosclerosis15.
TWO-DIMENSIONAL IMAGING OF A THREE-DIMENSIONAL STRUCTURE
Another limitation is that (quantitative) coronary angiography only provides a two-dimensional (2D) image while coronary arteries are 3D structures. Foreshortening is a common problem of QCA, which can be minimised by rotating the C-arm in such a way that the tube is directed perpendicular to the coronary segment of interest. One should always bear in mind that stenosis can be eccentric, resulting in different diameters when filmed from different angles. We would therefore advise obtaining the images from two or three different angles16,17. However, sometimes this is challenging due to overlapping vessels, especially in bifurcation lesions (i.e., obtaining an optimal view to the side branch ostium without overlap of the distal main branch and side branch, including left main lesions).
QCA: REPRODUCIBILITY
QCA has been shown to have a good inter- and intra-observer reproducibility. However, several factors have been identified which potentially influence reproducibility, such as the guiding catheter size used to calibrate18, the selection of different projections19, allowing for manual contour editing20, etc. Besides variability within and between observers, there is also a variability between core laboratories (core labs)20,21. Core labs are independent facilities that aim to provide unbiased and reproducible results. QCA analyses in clinical trials are often performed at such core labs to eliminate potential bias from the investigators. However, inter core lab variability has been observed and could be the result of differences in software used20,21, or differences in the standard operating procedures (SOPs) followed during QCA analysis20. Finally, as for every scientific measurement, the analyses should be performed in a blinded fashion as much as possible to avoid any potential bias from the analysts. However, sometimes this is practically impossible (e.g., when comparing bioresorbable scaffolds with metallic stents or comparing stenting with balloon angioplasty).
ANGIOGRAPHIC STENOSIS VERSUS PHYSIOLOGICAL ASSESSMENT
It has been widely recognised that stenosis severity assessment on (quantitative) coronary angiography is not well correlated with the extent of flow limitation (i.e., ischaemia) of coronary stenoses. It has been shown that PCI guided by physiological assessment (in contrast to angiography-guided PCI) improved patient outcomes with respect to relief of anginal complaints and the necessity of (repeat) angiography22-25. Although in clinical trials QCA assessment is very useful as a surrogate for neointimal growth over time (e.g., LLL and percent diameter stenosis), it should be used with caution for decision making regarding revascularisation. It is well known that the “oculostenotic reflex”, a term coined by Eric Topol to describe the irresistible temptation among some invasive cardiologists to perform angioplasty on any angiographically significant stenosis (i.e., diameter stenosis >50%)26, leads to an unjustifiably high rate of repeat revascularisations in clinical trials with angiographic follow-up, underestimating the true clinical benefits27. It is therefore recommended to design trials in such a way that the angiographic follow-up is performed after the formal assessment of the primary clinical endpoints28. In addition, if a repeat angiography is performed before the clinical endpoints are assessed, a functional assessment is recommended to determine the clinical appropriateness of revascularisation in order to avoid unnecessary interventions29.
CONVENTIONAL QCA NOT SUITABLE FOR BIFURCATION LESIONS
The coronary vascular tree is characterised by its fractal geometry, a scale-independent, recursive, self-similar (though not identical) branching pattern of a 3D vessel architecture30. The branching of the coronary tree at the bifurcations has been described according to different scaling laws (e.g., Murray, Finet, etc.)31. The most accurate scaling law seems to be the one described by Huo and Kassab who have studied their “Huo-Kassab” (HK) model on casts of the coronary (micro-)vasculature taken from pigs and IVUS data from humans31-33. They found the following relationship between the mother and two daughter vessel diameters (D):
![]()
These scaling laws have taught us that, per definition, daughter branches (i.e., the distal main branch or side branch) are always smaller than the mother vessel (i.e., the proximal main branch). QCA software was initially developed and validated in straight segments. However, when such conventional “single-vessel” QCA software is used in bifurcations, this will result in inaccurate measurements34,35. As shown in a precision-manufactured bifurcation phantom, the use of “single-vessel” QCA in bifurcations will result in an underestimation of the interpolated reference vessel diameter in the proximal main branch (and thus underestimation of percentage diameter stenosis) and overestimation of the distal main branch and side branch (overestimating the percentage diameter stenosis) because the software does not take into account the natural fractal geometry of the coronary tree36. Another limitation of the use of “single-vessel” QCA in bifurcations is the detection of a non-existing vessel contour at the ostium of the side branch. This is problematic for two reasons: the first is that in some cases these fake contours need to be redrawn, introducing bias. The second reason is that in some cases it may even create a “pseudo stenosis”, a non-existing stenosis at the side branch ostium36,37. A third limitation of “single-vessel” QCA in bifurcations is the need for manual segmentation, since the conventional software does not automatically detect the three different bifurcation segments. For instance, the position where the analyst determines the beginning of the side branch may affect side branch stenosis measurements significantly20,37.
RECENT ADVANCES TO OVERCOME SOME OF THESE LIMITATIONS
In the last decade, the limitations of conventional, 2D, “single-vessel” QCA have been addressed by further advances of QCA software, including the introduction of 3D QCA and dedicated bifurcation software.
DEDICATED BIFURCATION SOFTWARE
To overcome the limitations of the use of single-vessel QCA software in bifurcations, dedicated bifurcation QCA software algorithms have been developed (Figure 3)36-41. Although there are different software packages available from different companies, they share the same basic principles:
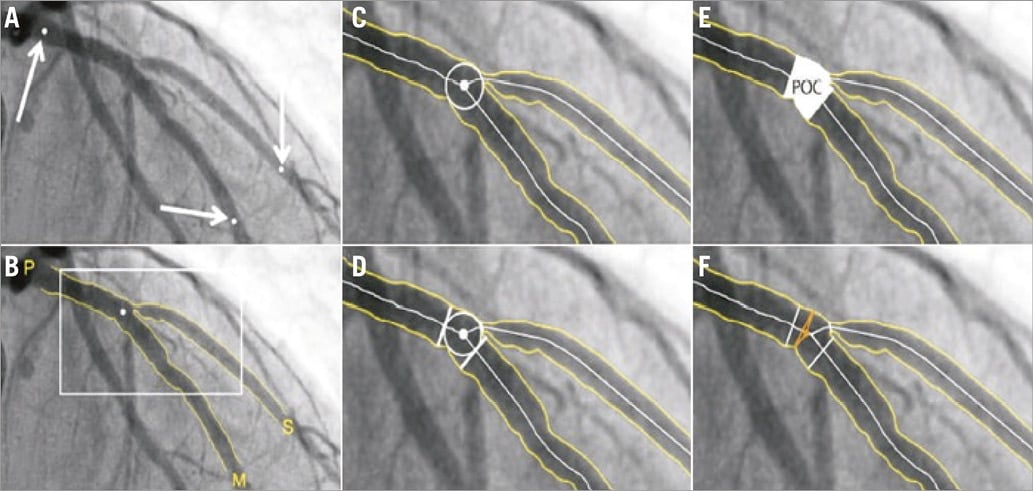
Figure 3. Representative example of dedicated bifurcation QCA analysis. In the CAAS QCA bifurcation software (Pie Medical Imaging), the segment of analysis is indicated by one proximal and two distal delimiter points (white arrows, A). After automatic detection of the contours (B), the “point of bifurcation” (POB) is defined as the mid-point of the largest possible circle touching all three contours (C). The intersections of the circle with the centrelines (D) indicate the boundaries of the polygon of confluence (POC) (E). The diameter values are obtained differently inside the POC from those in straight segments outside the POC (F). Outside the POC, diameters are determined by the shortest distance between the vessel’s outer borders, as in the conventional straight-vessel QCA algorithm. Within the POC, however, another mathematical algorithm, the so-called “minimum freedom” approach, is used. Reprinted from Collet et al. EuroIntervention 2017 17.
– The software automatically recognises the three vessel contours: 1) from the proximal main branch to the distal main branch, 2) from the distal main branch, via the carina, to the side branch, and 3) from the proximal main branch to the side branch. As such, the software recognises the bifurcation as an anatomic entity without non-existing contours crossing the ostium of a distal branch (in contrast to the conventional software which only recognises two vessel contours).
– The interpolated reference diameter is reconstructed for each of the three bifurcation segments separately: 1) the proximal main branch, 2) the distal main branch, and 3) the side branch. Minimal lumen diameters and diameter stenoses are calculated for each segment separately. This prevents overestimation or underestimation of the diameter stenosis.
Currently, two of the available bifurcation software packages, CAAS bifurcation software (Pie Medical Imaging, Maastricht, the Netherlands) and QAngio XA bifurcation software (Medis medical imaging systems, Leiden, the Netherlands) have been validated against precision-manufactured bifurcation phantoms and compared with the single-vessel QCA software36. The bifurcation QCA software algorithms proved to be highly accurate and precise. The two tested algorithms were comparable in accuracy and precision36. The European Bifurcation Club therefore recommends the use of bifurcation QCA software for angiographic analysis of bifurcation lesions17,34.
THREE-DIMENSIONAL QCA
3D QCA is another advance over the past decade, developed to overcome some of the shortcomings of 2D QCA. For each 3D reconstruction, two angiographic images are needed which are separated by a viewing angle of ≥30°. The main advantage of 3D QCA is its accuracy in length derivation by minimising possible vessel foreshortening commonly seen in 2D QCA42-45.
Another (theoretical) advantage of 3D QCA is that stenosis assessment is not influenced by the projection, which is especially important in eccentric lesions. In eccentric lesions with an oval-shaped lumen, the minimal lumen diameter measured depends on the viewing angle (MLD will be smaller when the projection is perpendicular to the shortest axis of the oval-shaped lumen). 3D reconstructions could overcome this limitation. It is noteworthy that Yong et al demonstrated that 3D QCA measurements showed better predictability for functional significance as determined by invasive FFR than 2D QCA (in simple, non-bifurcated lesions)46. Thus 3D data provide more accurate information on the anatomical and functional severity of the stenosis47.
3D QCA software has also been developed specifically for bifurcation lesions. Another feature of 3D QCA is its ability to calculate the optimal viewing angle, defined as an orthogonal view of the lesion in such a way that foreshortening and overlap are minimised. This tool can aid the angiographer or interventionist in selecting the best projection48. This might be especially useful in bifurcations, where in some cases the evaluation of the three segments of the bifurcation is problematic. A limitation of 3D QCA might be its relatively low feasibility, mainly due to the fact that two projections separated by 30 degrees are not always acquired43. In the SYNTAX trial for instance (in the left main lesion subgroup), 3D QCA was feasible in only 75.1%49. However, this could be improved by adherence to strict QCA guidelines for image acquisition34. Finally, 3D QCA provides the opportunity for 3D modelling using computational fluid dynamics to simulate physiological assessment without the need for pressure and/or flow wires50,51.
ANGIOGRAPHY-DERIVED FRACTIONAL FLOW RESERVE
Since the landmark paper of K. Lance Gould in 1978 describing the drop of pressure across a coronary stenosis, numerous attempts have been undertaken to improve the diagnostic ability of QCA to detect functionally significant lesions52,53. Beyond the traditional angiographic percent diameter stenosis assessment, other factors have been shown to impact on the functional component of a stenosis, namely the entry and exit angles, length of the lesion, the minimum lumen area and the reference vessel area. Using coronary geometries derived from 3D QCA and applying fluid dynamic principles, a lesion-specific pressure drop can be calculated, thus simulating FFR. The angiography-derived FFR has been evaluated using different approaches (Table 1, Figure 4)50,54-58. The most important difference among the published studies in the field of “angio FFR” is the method used for the pressure drop calculation. Some authors relied on the computational fluid dynamic (CFD) solving the Navier-Stokes equations to simulate the flow and pressure, whereas others used a simplified equation based on the Lance Gould formula, the so-called “rapid CFD”. The main advantage for the simplified approach is the reduced computation time. Consistently, these studies used invasive FFR as reference. Combining the published literature (n=501 vessels) by means of a meta-analysis, the sensitivity and specificity were 0.87 (95% CI: 0.80 to 0.91) and 0.92 (95% CI: 0.89 to 0.94), respectively, without significant heterogeneity among studies (I2 for sensitivity 49% and specificity 0%, n=6) (Figure 5). These results indicate that “angio FFR” may be a good tool for diagnosing ischaemia-producing lesions in patients with non-complex CAD. However, further studies are warranted to confirm this finding.
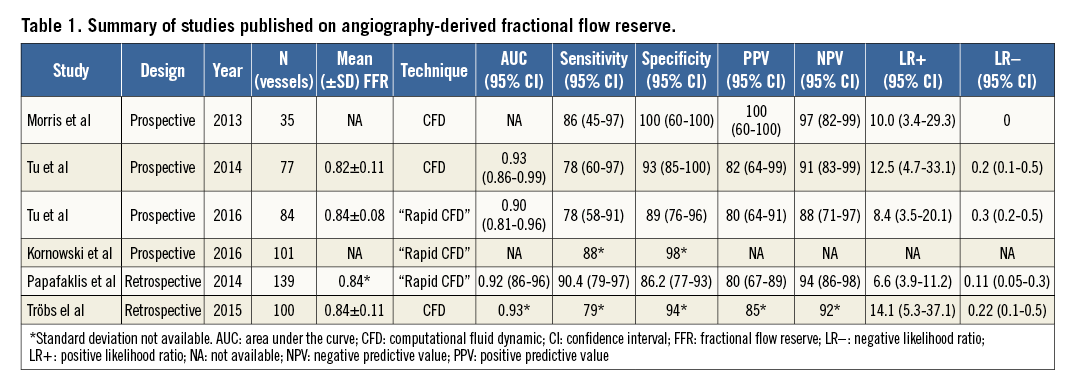
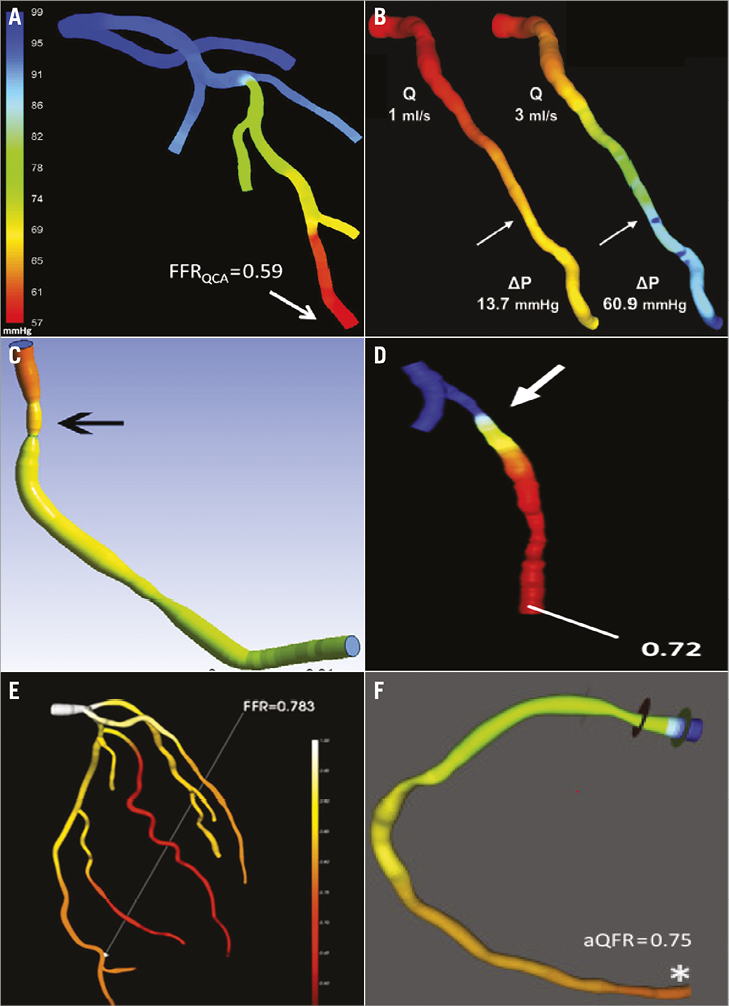
Figure 4. Technologies available for angiography-derived fractional flow reserve calculation. A) Simulated pressure distribution at hyperaemia. (Reproduced from Tu et al57). B) Pressure distribution in a colour-coded map for two different flow rates (Q), which resulted in a pressure gradient (ΔP) of 13.7 and 60.9 mmHg. (Reproduced from Papafaklis et al54). C) Virtual fractional flow reserve. (Reproduced from Morris et al56). D) FFR angio. (Reproduced from Trobs et al55). E) Angiogram-based FFR (CathWorks, Ra’anana, Israel) with the inclusion of bifurcation and the entire coronary tree. (Reproduced from Kornowski et al58). F) Quantitative flow ratio (QFR; Medis medical imaging systems, Leiden, the Netherlands). (Reproduced from Tu et al57).
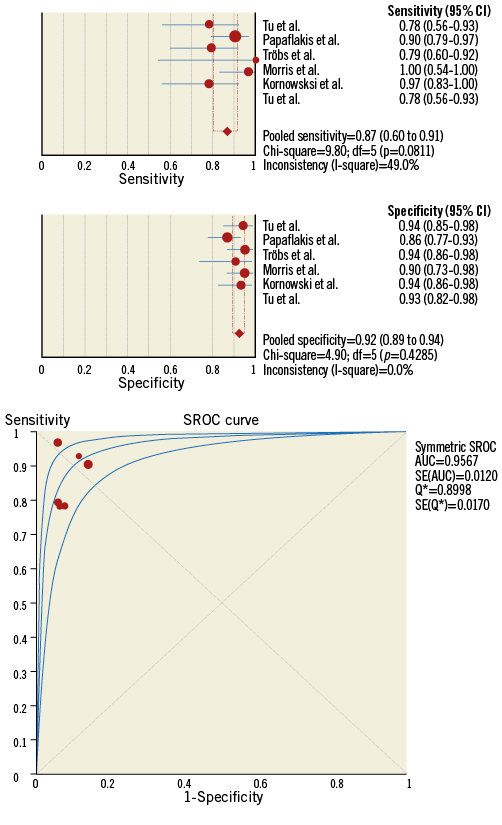
Figure 5. Meta-analysis of the diagnostic accuracy of angiography-derived fractional flow reserve methods. On the top panels, the pooled sensitivity and specificity are presented. In the lower panel, the pooled area under the curve for the accuracy of angiography-derived fractional flow reserve to detect invasive fractional flow reserve <0.80.
Future developments in the field of coronary angiography
The calculation of FFR using angiographic images has the potential to revolutionise the field of QCA. The introduction of angiography-derived FFR into the cathlab might increase the use of QCA in clinical practice, providing an anatomical and physiological assessment of coronary stenoses. Post-PCI measurements can be obtained from routine angiograms in order to evaluate the immediate effectiveness of PCI. Furthermore, the functional information can be adapted to the traditional LLL and restenosis concepts to provide the physiologic repercussions of these phenomena. Future trials are warranted to address these questions.
Conclusions
For 40 years, coronary angiography has been developing continuously in order to improve its diagnostic performance. In the current era, the assessment of complex lesion morphology such as bifurcation lesions has been shown to be precise with dedicated software packages. Also, the accuracy of QCA has been improved by utilising 3D reconstruction, which has also enabled the simulation of physiological parameters. These developments have made QCA a robust tool for the evaluation of coronary lesions with the potential to impact on clinical practice.
Authors’ perspective
Coronary angiography has evolved continuously over the past four decades. The refinements in QCA software and the advent of dedicated bifurcation packages and 3D reconstruction have expanded the application of coronary angiography in the clinical and research setting. The novel concept of physiological assessment derived from angiography is expected to become a widespread tool to aid the interventionalist in the decision-making process.
Acknowledgements
We would like to thank Hans Reiber, Jean-Paul Aben, Cherif Sahyoun, Shengxian Tu, Ran Kornowski and Yosuke Miyazaki for their intellectual contribution to this manuscript.
Conflict of interest statement
C. Collet has received research grants from HeartFlow Inc. Y. Onuma and P.W. Serruys are members of the advisory board of Abbott Vascular. The other authors have no conflicts of interest to declare.