Abstract
Bifurcation lesions represent one of the most challenging lesion subsets in interventional cardiology. The European Bifurcation Club (EBC) is an academic consortium whose goal has been to assess and recommend the appropriate strategies to manage bifurcation lesions. The quantitative coronary angiography (QCA) methods for the evaluation of bifurcation lesions have been subject to extensive research. Single-vessel QCA has been shown to be inaccurate for the assessment of bifurcation lesion dimensions. For this reason, dedicated bifurcation software has been developed and validated. These software packages apply the principles of fractal geometry to address the “step-down” in the bifurcation and to estimate vessel diameter accurately. This consensus update provides recommendations on the QCA analysis and reporting of bifurcation lesions based on the most recent scientific evidence from in vitro and in vivo studies and delineates future advances in the field of QCA dedicated bifurcation analysis.
Introduction
The European Bifurcation Club (EBC) is an academic consortium created in 2004 whose goal has been to assess and recommend the appropriate strategies to manage bifurcation lesions1. In 2009, the EBC assigned to the angiographic subcommittee the task of developing a consensus regarding the appropriate use of quantitative coronary angiography (QCA) for the evaluation of bifurcation lesions. In the previous consensus document, the limitations of single “straight” vessel QCA were addressed with the recommendation for the use of dedicated bifurcation software in clinical practice as well as in clinical trials2. Since then there has been increasing evidence of the inaccuracy of single-vessel QCA3. New software for dedicated bifurcation analysis including three-dimensional bifurcation QCA has been developed and validated4. Therefore, the aim of this document is to provide an update on the recommendations based on the most recent scientific evidence from in vitro and in vivo studies and to delineate future advances in the field of QCA dedicated bifurcation analysis.
CORONARY BIFURCATION ANATOMY
Coronary artery branching patterns follow the natural fractal phenomenon5. The scaling laws of coronary bifurcation fractal geometry (i.e., the principle of self-similarity at different scales) have been proposed as a guiding tool for percutaneous coronary interventions, to prescribe boundary conditions in fluid dynamic simulations (i.e., shear stress and fractional flow reserve) and, recently, for the development of dedicated bifurcation QCA software6-9.
The relationship among the proximal main vessel (PMV), distal main vessel (DMV) and side branch (SB) has been described by different authors7,10. Finet et al proposed a fractal-like rule Dmv=0.678*(Ddv+Dsv) to approximate the therapeutic target diameter of the diseased vessels involved in a bifurcation7. Subsequently, based on the flow-diameter scaling laws and the conservation of the mass, Huo and Kassab refined the model to Dmv7/3=Ddv7/3+Dsv7/3, where Dmv, Ddv and Dsv represent the diameters of the PMV, DMV and SB, respectively11.
These scaling laws provide a simple approach to the heterogeneous and complex coronary tree. They represent the basis for the improvements in quantitative bifurcation analysis to optimise the QCA analysis in bifurcation lesions, resulting in an improvement in predicting lesion severity associated with significant fractional flow reserve (FFR)12. Of note, some studies have suggested differences in the geometric relationships between left main coronary artery bifurcations (LMCA) and more distal bifurcations (i.e., left anterior descending artery [LAD] and diagonal, left circumflex [LCx] and obtuse marginal [OM]). The curvature between the distal branches (DMV and SB) in the LAD and LCx bifurcations are significantly different from those observed in the LMCA. Also, the LMCA bifurcation has the smallest proximal bifurcation angle and the largest distal angle compared to LAD and LCx bifurcations13,14. Therefore, different anatomical considerations should be taken into account in the assessment of LMCA and distal bifurcations.
Since the introduction of coronary angiography, it has been recognised that visual estimation is inaccurate to quantify coronary stenosis severity15. This seems to be particularly true for stenosis located at the ostium of the SB in bifurcation lesions, where differences in reference vessel diameters among the three different arterial segments make diameter stenosis assessment more complex16. In a survey among experts investigating the accuracy of visual assessment compared to quantitative angiography in bifurcations lesions, visual estimation consistently overestimated lesion severity in the DMV and SB. Consequentially, the inter-observer agreement for the visual Medina classification was low, with a significant misclassification of bifurcation lesions compared to a quantitative Medina classification16. In the quantitative Medina classification, diameter stenosis ≥50% is assessed with dedicated bifurcation software in all three segments separately and documented in the same manner as visual Medina classification (e.g., 1,1,1; 1,0,1; 0,0,1; etc.)17. This issue underscores the need for dedicated quantitative angiographic software to evaluate the extension and severity of disease in a bifurcation lesion.
A fundamental challenge in assessing bifurcations using quantitative angiography methods lies in acquiring the image of the entire bifurcation lesion without significant foreshortening or vessel overlap. While current QCA standards recommend acquiring a minimum of three projections, optimal visualisation of the bifurcation lesion (parent vessel and SB) is typically obtained in one single view. Important morphologic considerations in the assessment of bifurcation lesions, as for all single lesions, have been previously described and include lesion length, ostial side branch location, the extent of calcification, presence of coronary ectasia and irregularity, and markers of plaque instability such as thrombus, plaque ulceration, and flow disturbances. These parameters have been shown to have prognostic significance in procedural and long-term outcomes18. All of these characteristics should be evaluated and reported individually for the parent vessel and the SB.
LIMITATIONS OF SINGLE-VESSEL QCA IN BIFURCATION LESIONS
Single-vessel QCA software is inaccurate when applied to bifurcation lesions due to the specific anatomical characteristics of bifurcations19. Single-vessel analysis ignores the bifurcation core (or polygon of confluence) and the step-down phenomenon, and extrapolates non-existing vessel contours across the bifurcation, frequently requiring arbitrary manual corrections impairing reproducibility. At times, this method can create “pseudo-stenosis” in which the minimal lumen diameter (MLD) is incorrectly located at the site of the SB ostium in the middle of the bifurcation core, instead of locating it at the true MLD site (Figure 1). Another challenge in QCA of bifurcations is to assess an accurate reference vessel diameter (RVD) to calculate the percent diameter stenosis (%DS). If the single-vessel algorithm is applied to a bifurcation lesion, this will lead to an inaccurate RVD due to the fractal differences in diameters proximal and distal to the bifurcation (the step-down phenomenon), which is most pronounced at the SB ostium. The interpolated RVD will be overestimated in the ostia of the distal branches because of the larger proximal diameters, thus overestimating the %DS. Conversely, the RVD of the distal part of the PMV will be underestimated, due to the influence of the smaller distal branch on the interpolated RVD20.
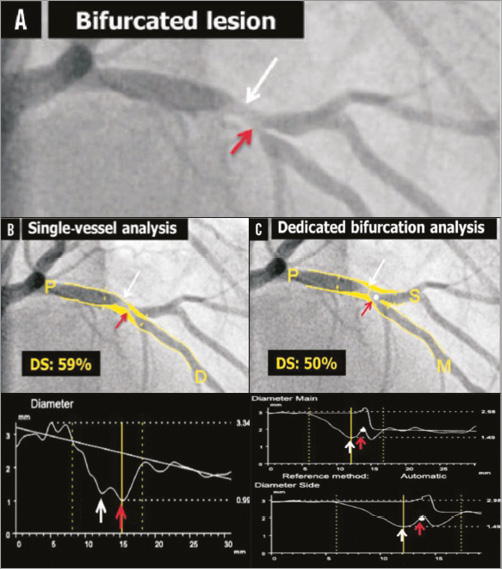
Figure 1. Quantitative coronary angiography of a bifurcation lesion using single-vessel or bifurcation dedicated software. A) A bifurcation lesion involving the left anterior descending artery and the first diagonal branch. B) Quantitative coronary angiography (QCA) analysis of the bifurcation lesion using single-vessel software creating a “pseudo-stenosis” depicted with a red arrow. C) QCA analysis of the same bifurcation lesion using dedicated bifurcation software. In all panels, the white arrow indicates the true location of the MLD of the proximal main branch, the red arrow the pseudo-stenosis found with single-vessel QCA at the actual location of the point of bifurcation (white dot in C). MLD: minimum lumen diameter Reprinted from Grundeken et al20.
Another limitation of the single-vessel approach in bifurcations is the need for manual segment definition, since the software does not recognise where the proximal branch stops and the DMV or SB begins. This factor introduces bias and impairs reproducibility that might undermine trial results20.
DEDICATED BIFURCATION QCA SOFTWARE
To overcome the above-mentioned shortcomings of single-vessel software, dedicated bifurcation QCA algorithms were developed. Three different QCA software packages are currently available.
1. CAAS bifurcation software (Pie Medical Imaging, Maastricht, the Netherlands) (Figure 2).
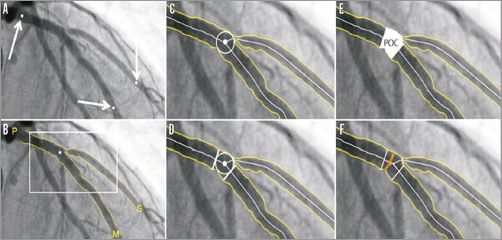
Figure 2. CAAS 2D bifurcation software (Pie Medical Imaging). In the CAAS QCA bifurcation software, the segment of analysis is indicated by one proximal and two distal delimiter points (white arrows, A). After automatic detection of the contours (B), the “point of bifurcation” (POB) is defined as the mid-point of the largest possible circle touching all three contours (C). The intersections of the circle with the centrelines (D) indicate the boundaries of the POC (E). The diameter values are obtained differently inside the POC from those in straight segments outside the POC (F). Outside the POC, diameters are determined by the shortest distance between the vessel’s outer borders, as in the conventional straight-vessel QCA algorithm. Within the POC, however, another mathematical algorithm, the so-called “minimum freedom” approach, is used. Reprinted from Grundeken et al20.
2. QAngio XA bifurcation software (Medis medical imaging systems, Leiden, the Netherlands) (Figure 3).
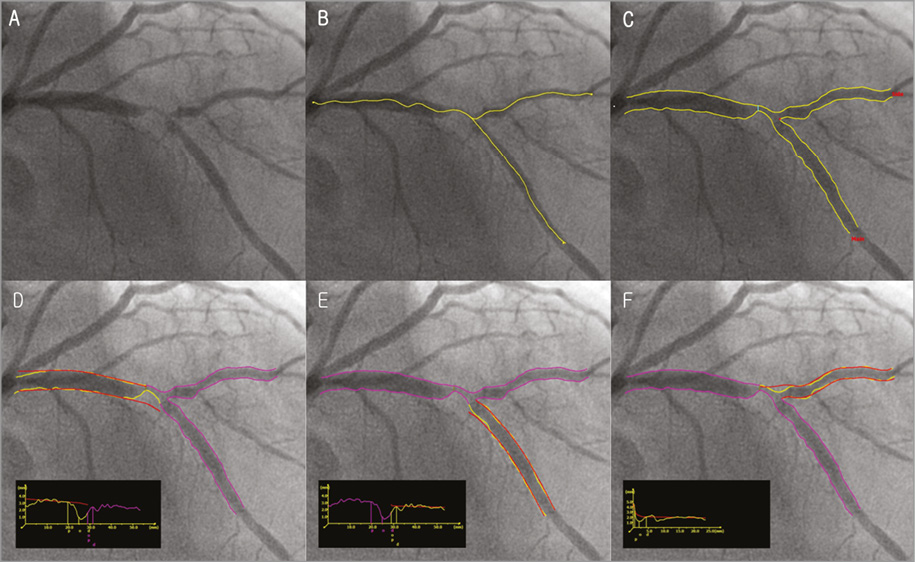
Figure 3. QAngio XA bifurcation software (Medis). A) A left anterior descending artery-diagonal branch bifurcation lesion. B) First, the analyst defines the segment of analysis by indicating one start point in the proximal vessel and one endpoint in each of the two distal branches, after which two wavepath pathlines from proximal to distal are detected (note that the proximal parts overlap). C) Subsequently, the vessel contours are automatically detected using the minimal cost algorithm (MCA). In addition to the vessel contours, the initial position of the carinal point and the proximal delimiter (independent of the presence of lesions) are automatically detected (red dot and light blue line, respectively), in order to define the vessel bifurcation with a model of four building blocks and its measurements, D and E). The T-shape’s arterial and reference diameter functions are determined using the Medis straight vessel diameter function for the proximal and distal main branch sections, subsequently combined in the middle by an interpolated diameter function for the bifurcation core transition. F) An adjusted Medis ostial diameter function is used for the side branch, reconstructing a proximal flare to correspond to the “mouth” of the ostium. Reprinted from Grundeken et al20.
3. CardiOp-B System (Paieon Medical Ltd., Rosh Ha’ayin, Israel)21,22.
These systems incorporated principles of fractal geometry to address the “step-down” in the bifurcation and to estimate the reference vessel diameter. The accuracy and precision of the CAAS and QAngio XA bifurcation software packages have been compared in vitro with bifurcation plexiglass phantoms and both have proved to be more accurate than single-vessel QCA analysis19.
COMPARISON OF CONVENTIONAL SINGLE-VESSEL ANALYSIS VERSUS DEDICATED BIFURCATION SOFTWARE
To assess the accuracy of the single-vessel software in bifurcation lesions objectively, and to validate both QAngio XA and CAAS bifurcation software algorithms, Ishibashi et al performed a phantom validation study19. For this analysis, six precision plexiglass phantoms with a total of 18 bifurcations were used. The 18 bifurcations were analysed three times: 1) with the conventional single-vessel algorithm of CAAS (version 5.10), 2) with the bifurcation algorithm of CAAS, and 3) with the bifurcation algorithm of QAngio XA (version 7.3). The single-vessel analysis was performed from the PMV to the DMV and from the PMV to the SB. The study showed that conventional single-vessel analysis underestimated the RVD and %DS in the PMV, while these parameters were overestimated in the DMV and SB (Figure 4). Overall, combining all three segments of the 18 bifurcations (54 segments), the single-vessel approach showed poor accuracy and precision for RVD and %DS. The bifurcation algorithms, on the other hand, proved to be highly accurate and precise, with comparable accuracy and precision between the CAAS and QAngio XA (with systematic use of the T-shape model) bifurcation software with regard to MLD, RVD, and %DS19. This study demonstrates that the use of the single-vessel QCA approach is inaccurate in bifurcation lesions. It also validated the CAAS and QAngio XA bifurcation software packages for quantitative angiographic assessment of coronary bifurcations.
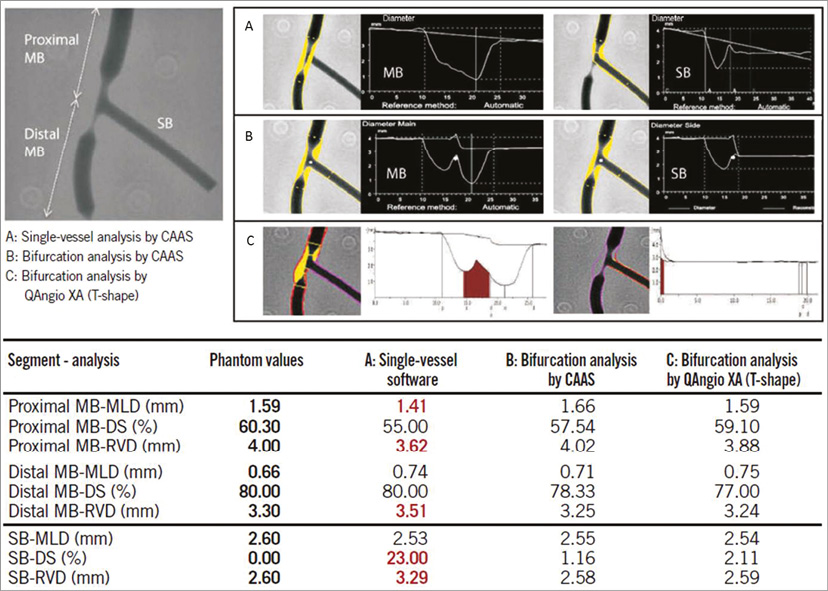
Figure 4. Quantitative coronary angiography measurement by CAAS and QAngio XA software for a bifurcated lesion in the calibrated phantom. Angiographic parameters including reference diameter (RVD), minimal lumen diameter (MLD), % diameter stenosis (%DS) are given in the PMV, DMV, and side branch (SB). A cine-angiogram demonstrated moderate to severe stenosis both in the proximal main vessel (PMV) and in the distal main vessel (DMV) with a Medina class 1,1,0. The conventional single-vessel method measured a significantly smaller RVD in the PMV and a larger RVD in the DMV and SB. A) QCA using the conventional single-vessel algorithm by CAAS. B) QCA using the bifurcation algorithm by CAAS. C) QCA using the T-shape bifurcation algorithm by QAngio XA. QCA: quantitative coronary angiography. Reprinted from Grundeken et al20.
The differences between single-vessel analysis and dedicated bifurcation software were also observed in a clinical trial evaluating a dedicated bifurcation coronary stent3. From the population of the randomised trial comparing a Dedicated Bifurcation Stent Versus Provisional Stenting in the Treatment of Coronary Bifurcation Lesions (TRYTON Bifurcation Study), 326 (46%) patients underwent planned repeat angiography at nine months23. The use of single-vessel QCA analysis was systematically associated with a higher in-stent %DS at the level of the SB (bias 5.54% [CI –26.74 to 37.82]) compared with dedicated two-dimensional (2D) bifurcation analysis3.
THREE-DIMENSIONAL DEDICATED QCA SOFTWARE
To overcome potential limitations associated with 2D quantitative coronary analysis of bifurcation lesions (i.e., vessel overlap, tortuosity and foreshortening), dedicated three-dimensional (3D) quantitative coronary analysis (QCA) software packages have been developed4,24,25.
By combining two 2D image data sets, the new 3D bifurcation software is able to perform a 3D reconstruction of the bifurcation and determine lumen dimensions and bifurcation angle. Furthermore, the best single view can be calculated based on the 3D bifurcation geometry allowing X-ray angiographic optimal visualisation of the bifurcation lesion. In order to reconstruct the bifurcation core into a 3D image correctly, the fact that the contour information obtained from the 2D projections may contain vessel overlap needs to be taken into account, since the bifurcated vessel might be partly obscured in one or both of the image projections.
In the CAAS 7.3 QCA 3D system, the identification of a common image point (CIP) corrects for the distortion introduced by the isocentre offset before the 3D centrelines are reconstructed by means of an adaptive 3D epipolar geometry algorithm24. Respective 3D cross-sections are constructed assuming an elliptical model, by using the luminal diameters of the corresponding 2D cross-sections and their spatial orientations to define the ellipse axes. Analogous to previous CAAS bifurcation analysis, the polygon of confluence (POC) is defined as the central bifurcation region which behaves differently from a single-vessel analysis26. Outside the POC, the cross-sectional area is defined perpendicular to the centre of the lumen; within the POC, the cross-sectional area is defined by the smoothest possible surface that spans the lumen at each centreline position resulting in curved cross-sections within the central bifurcation region. Automatic calculation of reference cross-sectional area adopts the methodology described for CAAS 2D bifurcation QCA and applies it to the 3D reconstructed model. Outside the POC, a 3D equivalent of the algorithm used in single-vessel segments is employed4,27. Within the POC, the reference area is derived by applying an interpolation technique between the “healthy” reconstructed 3D branches. Based on the respective cross-sectional areas, lumen diameter and RVD are defined as the equivalent diameters based on the assumption of circularity (Figure 5).
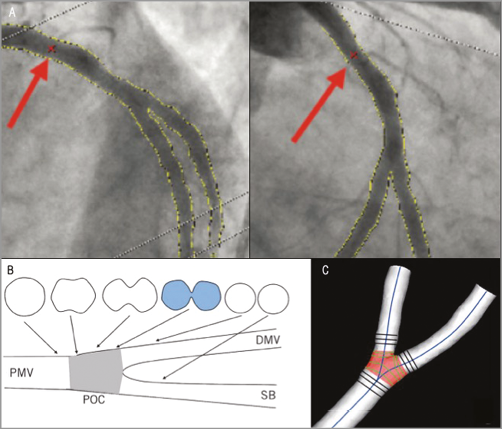
Figure 5. CAAS QCA 3D bifurcation methodology. Automatic selection of common imaging points (CIP, red crosses indicated with red arrows) in two different projections (A). The analysis can optimise the position of CIP manually if necessary. Definition of polygon of confluence (POC). B) Within POC (grey) the vessel is slowly widening, but at the same time the top and bottom are slowly collapsing towards a single point (figure-of-eight shape in blue, panel B) after which we have two “normal”-shaped vessels. C) The start of the POC (in red) is defined as the position where plane cross-sections give way to curved ones; exactly the opposite marks the end of the POC. DMV: distal main vessel; PMV: proximal main vessel; POC: polygon of confluence; SB: side branch. Reprinted from Onuma et al24.
In the QAngio XA 3D (RE) software, an automatic correction for the system distortion is performed by means of one to three pairs of offset correction points and their corresponding epipolar lines14. As a first step, the calculation of the reference diameter function is based on each of the three segments separately, with the assumption that there is no tapering in reference diameter within each segment. Subsequently, these three reference diameter functions are used to reconstruct the reference core diameter function, taking into account the distal bifurcation angle. Instead of assessing the diameters along several flat planes at the bifurcation core, this new bifurcation model creates a number of bent oval planes, with the degree of bending depending on the distal bifurcation angle. The bending of the oval planes linearly decreases from the carina position towards the proximal, changing into a flat plane at the beginning of the bifurcation core. The sum of the two paired diameters at each bent oval plane defines the core diameter. Accordingly, the reference core diameter is defined as the sum of the paired reference diameters at each oval plane (Figure 6)12,28. Finally, with both 3D software packages, two bifurcation angles are computed between the PMV and the SB (proximal angle or angle A), and between the DMV and the SB (distal angle or angle B) (Figure 7). Bifurcation angles are calculated in 3D space without overlap, and theoretically are more precise than 2D QCA. Although the feasibility of 3D QCA analysis has been reported to be limited, pre-specified angiographic acquisition guidelines and novel algorithms that compensate for the isocentre offset can improve the feasibility of this analysis29.
The accuracy of the CAAS 3D bifurcation software has been evaluated in vitro using a bifurcation phantom30. In 3D reconstructions based on two 2D images4, acquired at variable rotation and angulation, accuracy and precision (mean difference±SD) of the 11-segment model for MLD, RVD and DS were 0.013±0.131 mm, –0.052±0.039 mm and –1.08±5.13%, respectively; inter-observer variability was 0.141 mm, 0.058 mm and 5.42%, respectively. Accuracy and precision for bifurcation angle (BA) was –1.3±5.0°, whereas inter-observer variability was 7.5°; respective measures for length were 0.15±0.26 mm and 0.54 mm4. There was also an in vivo validation of the CAAS 3D QCA with intravascular ultrasound as a reference. Coronary luminal areas were shown to be highly correlated with systematic underestimation of lumen area of 0.45±1.49 mm231. During the same period, the accuracy of the QAngio XA 3D (RE) software was evaluated using a silicone bifurcation phantom32. The accuracy and precision for angle assessment was 0.4±1.1º for proximal BA and 1.5±1.3º for distal BA. The intra- and inter-observer variabilities for the proximal BA were 0.3±1.0º and 0.5±0.9º, and for the distal BA were 0.8±1.0º and 0.3±0.8º. In addition, the QAngio XA 3D (RE) software was compared in vivo with intravascular ultrasound and optical coherence tomography. A high correlation and a small bias in luminal areas between 3D QCA and IVUS (r=0.799, p<0.001; bias +1.21 mm2 [limits of agreement –2.09 to 4.51]) and 3D QCA and OCT (r=0.897, p<0.001: bias +1.07 mm2 [limits of agreement –1.85 to 3.99]) were found33.
A comparison between 2D and 3D dedicated bifurcation software was performed in the setting of a sub-analysis of a randomised trial assessing a dedicated bifurcation device34. Muramatsu et al analysed pre- and post-procedure angiographies in 114 patients treated with a dedicated side branch bifurcation stent. In the treated segments, there were no differences in MLD between 2D and 3D, while diameter stenosis was significantly higher in 2D compared to 3D analysis both pre-procedure and post procedure (53.9% for 2D vs. 52.1% for 3D pre-procedure, p<0.01; 23.2% for 2D vs. 20.9% for 3D post procedure, p=0.01). In the sub-segment level analysis, lengths of PMV, DMV and SB were consistently shorter in 2D compared to 3D both pre-procedure and post procedure. Notably, using 3D QCA, the anatomic location of the smallest MLD or the highest DS was relocated to a different bifurcation sub-segment in a considerable proportion of the patients compared to when 2D QCA was used (kappa values: 0.50 for MLD, 0.55 for %DS)34. Also, in another study Yong et al showed that 3D QCA-derived measurements showed better predictive ability in detecting functionally significant stenosis determined by invasive FFR as compared to 2D QCA-derived measurements in simple lesions35. Indeed, the use of 3D QCA analysis improved the predictive ability in determining a positive FFR, compared with the straight vessel analysis12. Therefore, the dedicated bifurcation 3D QCA algorithm may provide more accurate information; nevertheless, more studies comparing 2D and 3D software in bifurcation lesions are needed.
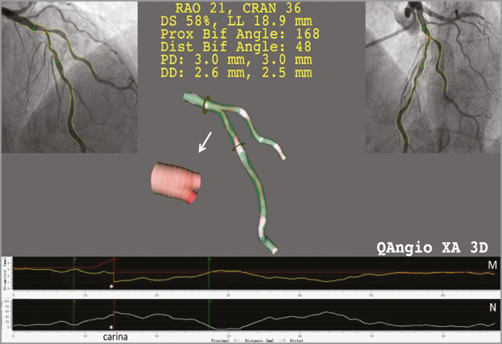
Figure 6. Three-dimensional vessel reconstruction and quantitative analysis of a stenosis at a left anterior descending artery and diagonal bifurcation with QAngio XA 3D (RE). The top left and top right panels show the two angiographic views used for 3D reconstruction. The reconstructed lumen and reference surface of the bifurcation are shown in the middle panel. M) The lumen and reference diameter functions for the left anterior descending artery (LAD) including the bifurcation core. N) The stenosis function for the LAD. Note that the stenosis function jumps at the carina (asterisk) due to the relatively higher stenosis in the LAD than in the diagonal ostium.
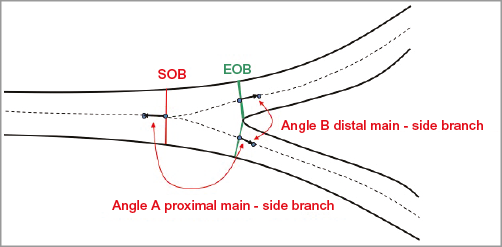
Figure 7. Calculation of bifurcation angles. Two bifurcation angles are computed between the proximal main vessel (PMV) and the SB (proximal angle or angle A), and between the distal main vessel (DMV) and the SB (distal angle or angle B); they are derived from a 3D vector of the centreline in the PMV at the start of the bifurcation core (directed from distal to proximal) and 3D vectors of the centrelines in the DMV and SB at the distal end of the bifurcation core.
Three-dimensional QCA also enables determination of the optimal viewing angle of a bifurcation lesion, i.e., the angulation and rotation characterised by having an orthogonal view of the bifurcation, minimising vessel foreshortening and overlap36. Tu et al found that the “true” optimal viewing angles could not be obtained since the angles were too deep to be obtained by the X-ray systems, suggesting that measurement of bifurcation angles by 2D QCA is unreliable in a high portion of routine clinical acquisitions due to suboptimal 2D angiographic views. In this study of 194 bifurcations, the proximal BA in LAD/diagonal, LCx/OM, and PDA/PLA were comparable and not statistically different (p=0.133), being 151°±13°, 146°±18°, and 145°±19°, respectively. However, the distal BA in LAD/diagonal were smaller than LCx/OM (p=0.004) and PDA/PLA (p=0.001), being 48°±16° vs. 57°±16°, and 59°±17°, respectively. The left main bifurcation had the smallest proximal BA (128°±24°) and the largest distal BA (80°±21°)14.
In addition, 3D QCA analysis of the bifurcation angle on the left main coronary artery has been shown to impact on prognosis. In a study by Girasis et al, a restricted post-procedural systolic-diastolic distal bifurcation angle range (<10°) resulted in higher five-year adverse event rates after LM bifurcation percutaneous coronary interventions29.
Future perspectives
Functional assessment of coronary stenosis has proved to be essential for the indication of revascularisation procedures as the angiographic anatomic assessment alone might sometimes be insufficient for defining the need for treatment37. Studies with FFR have demonstrated that the correlation of coronary %DS and ischaemia can be especially challenging in bifurcation lesions, particularly at the level of the SB. As shown by Koo et al, a high discrepancy between angiographic (%DS ≥75%) and functional criteria (FFR <0.75) exists for the evaluation of SB lesions38. Sarno et al, using a dedicated 2D bifurcation QCA software, found a moderate correlation (r=0.57, p=0.02) between angiographic (%DS ≥50%) and functional criteria (FFR <0.80) for the assessment of lesion severity at the level of the SB39. Also, the 3D QCA dedicated bifurcation software (QAngio XA 3D [RE]) was tested in 78 bifurcation lesions using FFR as the reference. A moderate correlation between invasive FFR and diameter stenosis was found (ρ=-0.50, p<0.001)12.
Recently, a computational approach to derive FFR from coronary X-ray angiography has been developed (Figure 8, Figure 9)40-42. The combination of angio-derived FFR and dedicated bifurcation QCA could further refine the evaluation of bifurcation lesions. These tools combined could be useful for defining treatment necessity, selecting the procedural strategy and assessing success. However, these novel approaches need further validation.
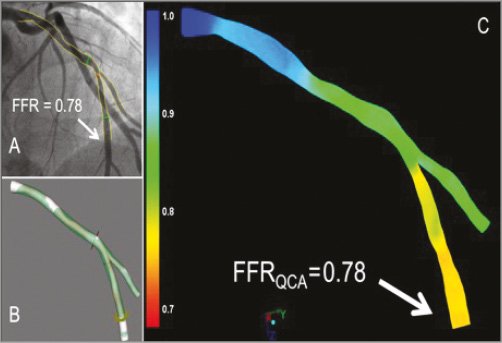
Figure 8. Examples of the FFR derived from angiography using the QAngio XA 3D (RE) (Medis) bifurcation model. The angiogram with the invasive FFR measurement (FFR=0.78) is shown in panel A. Panels B and C show the 3D reconstruction and the angiography-derived FFR (QFR). In this case the FFR and QFR match precisely, both being 0.78 at the distal location of the main branch, as indicated by the arrows. FFR: fractional flow reserve
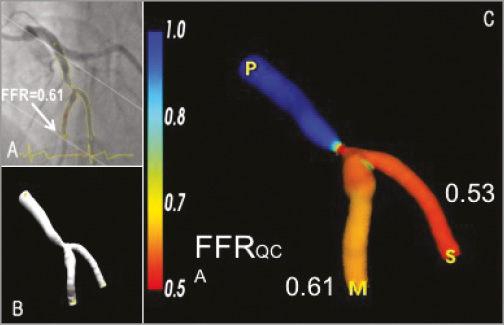
Figure 9. Illustrative examples of the FFR derived from angiography using the CAAS QCA 3D (Pie Medical Imaging). A) One of the two angiographic projections used to generate the 3D reconstruction of the bifurcation LAD and 2nd diagonal as shown in panel B. C) The 3D reconstruction including the angiography-derived FFR. In this example, the angiography-derived FFR at the distal location of the main branch was 0.61 and 0.53 for the side branch. Invasive FFR measurement within the main branch was 0.62. FFR: fractional flow reserve
Multislice computed tomography coronary angiography (MSCT) has been increasingly used as a non-invasive alternative to conventional invasive angiography for the assessment of coronary anatomy to guide the treatment decision and help procedure planning (e.g., to define the best angiographic projection for a specific lesion)43. A computational algorithm that calculates the fractional flow reserve non-invasively on the MSCT images (FFRCT) has also been developed and has been introduced into clinical practice with promising results44. In addition, this technology has been used to stent coronary lesions “virtually”. This feature could be utilised to plan complex bifurcation interventions based on the FFRCT in the main branch and side branch after virtual stenting. This non-invasive tool might also be useful in the assessment and treatment planning of coronary bifurcation lesions.
In the future, the investigation of flow and shear stress derived from angiography with pulsatile non-Newtonian simulations might show the complexities and intricacies of the pathology in coronary bifurcations. A combined anatomical and functional evaluation may supersede a purely angiographic assessment, as seen in the non-bifurcated pathology.
RECOMMENDATIONS FOR QCA ANALYSIS AND REPORTING IN CORONARY BIFURCATION LESIONS
In order to obtain standardised reporting of QCA analyses, the consensus group recommends the following:
1. Three angiographic projections orthogonal to the bifurcation plane should be acquired for optimal visualisation of the lesion. These projections should be separated by at least 30° to facilitate dedicated QCA bifurcation analysis. The quantitative analysis should be performed in two views with no vessel overlap, minimal foreshortening and displaying the widest bifurcation angle2.
2. A qualitative assessment of the bifurcation lesion (such as calcification, the presence of thrombus) should be reported in each of the three segments.
3. The 2D or 3D angles between the proximal main vessel and the side branch (proximal BA) and between the distal main vessel and side branch (distal BA) should be reported pre-intervention, post intervention and at follow-up since they are relevant for the selection of the PCI technique and long-term clinical events29,45.
4. In addition to the visual Medina classification, the quantitative Medina classification should be used to assess and to classify the bifurcation lesion severity and define the treatment strategy16,46.
5. Single-vessel analysis of bifurcation lesions should be abandoned2. For the quantitative analysis of bifurcation lesions, dedicated 2D or 3D bifurcation software packages should be used to assess lesion dimensions, severity and extension using a segmental analysis. In the segmental analysis, MLD, RVD and %DS should be reported for each coronary segment (PMV, DMV and SB). As a basic report, we recommend using the six-segment model (PMV, DMV, SB, 5 mm proximal segment, 5 mm distal segment in the main vessel and 5 mm distal segment in the SB). Additionally, the segmentation of the ostia of the SB and DMV, the entire main vessel, and the entire side branch could be reported (Figure 10).
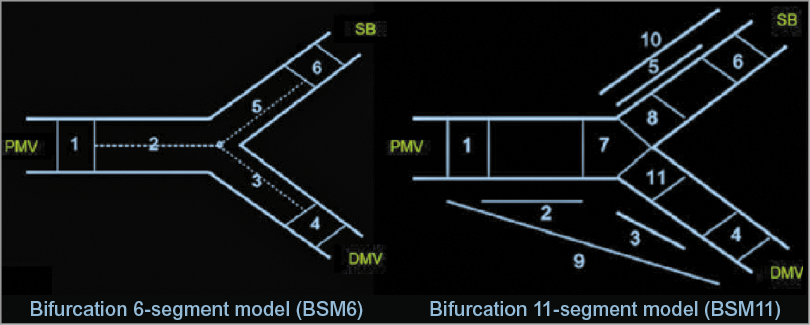
Figure 10. Bifurcation segment models. A composite of segments 2, 3, and 5 in the bifurcation six-segment model (BSM6) corresponds to the “treated segment,” where the stents were implanted or balloons were dilated, including the proximal main vessel (PMV), distal main vessel (DMV) and side branch (SB). The segments 2, 3, and 5 are divided by the point of bifurcation (POB), defined as the point where all the centrelines meet and the mid-point of the largest circle/sphere that can reach all three contours in bifurcation. Segments 1, 4, and 6 correspond to 5 mm segments beyond the treated segment (left panel). Segment 8 in BSM11 reflects 3 mm ostial segments of the SB (right panel). Reprinted from Girasis et al4.
6. To assess the significance of the SB, the size of the side branch should be defined as the reference vessel diameter at the ostium of the SB (segment 8).
7. The highest percent diameter stenosis (%DS) with the corresponding MLD should be reported as one metric for the entire bifurcation lesion.
8. A segmental analysis using the bifurcation segment model at the time of pre-intervention and post intervention and follow-up should be reported. This segmental analysis should provide a detailed analysis of the location of residual stenosis post intervention and the precise location of treatment failure or restenosis at follow-up2.
9. At follow-up, binary restenosis should be reported in each of the three segments separately, resulting in quantitative Medina scores at each follow-up time point to give an idea about bifurcation lesion complexity at baseline, post procedure, and follow-up16,46.
Conclusions
Most challenges in quantitative coronary angiography assessment of bifurcation lesions have been addressed by new software developments that have been validated in in vitro and in clinical studies. The introduction of 3D QCA software represents a further step in the field. These new QCA packages allow a precise anatomical bifurcation assessment with the possibility of assessing the functional component of the coronary bifurcation (i.e., angiography-derived FFR). However, validation of this new software for bifurcation lesions is still required to determine the future application of this technology.
| Impact on daily practice The precise evaluation of coronary bifurcation lesions is of paramount importance for defining the need for intervention and to guide treatment strategy. Dedicated bifurcation quantitative coronary angiography (QCA) analysis provides an accurate assessment of the bifurcation geometry and dimensions. In clinical practice, and in the research setting, dedicated QCA packages are the recommended approach for assessing bifurcation lesions pre and post intervention. For consistency in reporting clinical trials in the field of bifurcation lesions, a list of recommendations for QCA analysis is provided in this consensus document. |
Conflict of interest statement
Y. Onuma is a member of the International Advisory Board of Abbott Vascular. P. Généreux received speaker fees from Abbott Vascular, Cardiovascular Systems Inc., Tryton Medical, Edwards Lifesciences and AstraZeneca, and a research grant from Boston Scientific and Cardiovascular Systems Inc., is a consultant for Cardiovascular Systems Inc. and Soundbite Medical Solutions Inc., and is an equity holder of Soundbite Medical Solutions Inc. J. Popma received institutional grants from Medtronic, Abbott Vascular and Boston Scientific and is a member of the Boston Scientific Medical Advisory Board. S. Tu received a research grant from Medis medical imaging systems bv. J.H.C. Reiber is the CEO of Medis medical imaging systems bv. J-P. Aben is the CEO of Pie Medical Imaging. P.W. Serruys is a member of the International Advisory Board of Abbott Vascular. The other authors have no conflicts of interest to declare. The Guest Editor is a consultant for Abbott Vascular, Biosensors International, Biotronik, Boston Scientific, Medtronic Vascular, Symetis, Lifetech, is on the speakers’ bureau of AstraZeneca, Boston Scientific, Biotronik, and Abbott Vascular, and has received grant support from Biosensors International, Biotronik, Boston Scientific, Edwards Lifesciences, and Abbott Vascular.