Background
We developed a novel and dedicated three-dimensional (3-D) quantitative coronary analysis (QCA) software (Cardiovascular Angio-graphy Analysis System, Pie Medical Imaging, Maastricht, The Netherlands) to overcome potential limitations associated with two-dimensional (2-D) quantitative coronary analysis of bifurcation lesions (vessel overlap, foreshortening).
By combining two 2-D image data sets, the new CAAS 5, QCA 3-D bifurcation software is able to perform a 3-D reconstruction of the bifurcation and determine lesion characteristics including bifurcation angle. This is achieved in the following steps: i) Contour detection on two angiographic projections of the involved vessel segments including the bifurcation segment identification of a common image point; ii) Creation of the 3-D model and definition of the Polygon of Confluence (POC); iii) Calculation of cross-sectional area and diameter measurement; iv) Calculation of the reference area; v) Calculation of bifurcation angle.
This paper describes how the methodology is accomplished, in which the QCA 3-D bifurcation software performs a 3-D reconstruction of the bifurcation and determines lesion characteristics including bifurcation angle, with improved accuracy by reducing overlapping.
Introduction
In the percutaneous treatment of coronary artery disease, online two-dimensional (2-D) quantitative coronary angiography (QCA) is commonly used to determine lesion length and vessel size for stent implantation1. Two-dimensional QCA is accepted as the gold standard for reporting angiographic outcomes and has served as a surrogate endpoint for clinical events in large trials2. There are, however, several limitations with this 2-D technique. Depending on the angiographic view, vessel tortuosity, vessel overlap and foreshortening can result in inaccurate measurements3. This inaccuracy is important during percutaneous coronary intervention (PCI), because it may influence the selection of the correct size of the devices. In tortuous vessels this can lead to underestimation of the stent length required to cover the lesion4. To provide solutions for many of the inherent limitations associated with 2-D QCA, three-dimensional (3-D) reconstruction software algorithms, that integrate multiple single plane images, have been developed5,6. Briefly, the benefits of 3-D reconstruction include elimination of vessel foreshortening, out-of-plane magnification and calibration error7.
Recent advancements in the field of PCI (e.g., introduction of drug-eluting stents) have resulted in the treatment of more complex anatomies including bifurcation lesions8,9. Based on the assumption of continuous tapering of the vessel, conventional QCA calculates the reference vessel diameter (RVD) by interpolation from the diameter of the non-diseased vessel sections. Because bifurcation lesions are associated with relatively acute tapering of the vessel (from the proximal main vessel to the distal vessel, “step-down”), analysis of bifurcation lesions may lead to (1) underestimation of the RVD and percent diameter stenosis (%DS) in the proximal vessel and (2) overestimation of the RVD and %DS in the distal vessel10. Several 2-D QCA software algorithms have attempted to address this issue by calculating the RVDs in the proximal main (PMV) and distal main vessel (DMV) and side branch (SB) separately5,10. However, the inherent limitations in 2-D QCA call for dedicated 3-D QCA software, in order to provide more accurate measurements for the bifurcation lesions. This paper describes a novel methodology for true quantitative 3-D bifurcation analysis implemented in the new Cardiovascular Angiography Analysis System (CAAS) 5, 3-D software (Pie Medical Imaging, Maastricht, The Netherlands), wherein two 2-D images are combined into reconstructed 3-D images to determine lesion dimensions and characteristics as well as bifurcation angle.
CAAS 5 QCA 3-D bifurcation methodology
The CAAS 5 3-D quantitative analysis of bifurcation vessels is accomplished in six steps:
1. Contour detection on two angiographic projections of the involved vessel segments including the bifurcation segment.
2. Identification of a common image point.
3. Creation of the 3-D model and definition of the Polygon of Confluence (POC).
4. Calculation of the cross-sectional area and diameter measurement.
5. Calculation of the reference area.
6. Calculation of the bifurcation angle.
The average analysis time of all steps is around two seconds with use of a 2.33-GHz Dual Core Intel CPU.
Contour detection
In two 2-D image projections, being at least 30 degree apart, obtained either from a biplane or two monoplane acquisitions, the bifurcated vessel is detected. The bifurcation contour detection is performed using a semi-automated process that employs either a manually drawn initial pathline, or an automatic pathline initiated by mean of three user-defined points; one at the proximal side of the main vessel and two at both distal ends of the bifurcated branches. The automatic pathline is calculated by a wave propagation algorithm11. The contours are detected by using the well established minimal cost algorithm12, wherein the bifurcated vessel is considered to be a single entity10. After the automatic contour detection is applied on the first 2-D image projection, automatically a region of interest in the second 2-D image projection is indicated in order to assist the user in selecting the correct vessel segment within the second projection.
Identification of a common image point
To obtain an accurate and robust 3-D reconstruction of the bifurcated vessel it is required to correct for the system distortion introduced by the isocentre offset. This correction is performed by identifying a common image point (CIP) representing corresponding anatomical landmarks between the selected projections. Using densitometry, the CAAS software automatically locates the CIP, by performing a correlation algorithm between the densitometric intensity obtained from the detected bifurcated vessel of the two images. The analyst can manually redefine the automatic CIP if necessary (Figure 1).
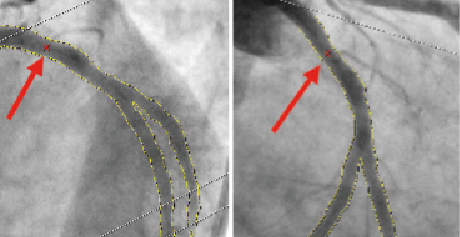
Figure 1. Automatic selection of common imaging points (CIP, red crosses indicated with red arrows) in two different projections. The analysis can optimise the position of CIP manually if necessary.
Creation of 3-D model and definition of the polygon of confluence (POC)
A 3-D model of the bifurcated vessel is constructed, based on the two 2-D angiographic segmented bifurcation and the geometric data of the acquisitions provided through the DICOM headers; these are combined by means of the CIP merging point in order to correct for the distortion introduced by the isocentre offset. First the centre line of the main vessel, defined from the proximal edge of the PMV up to the distal edge of the DMV, is reconstructed in 3-D. Next the centre line of the side branch is reconstructed in 3-D, starting at the origin of bifurcation as obtained in the 2-D projections up to the distal end of the SB. In both steps the 3-D centre line reconstruction is performed by means of an adaptive 3-D epipolar geometry algorithm. The first possible epipolar mismatch is detected, by comparing the angle between the direction of the vessel and the viewing direction of the system. Within regions where no epipolar mismatch is detected, the 3-D centre line reconstruction is based on epipolar geometry. Next, within regions with possible epipolar mismatch, an iterative reduction of the cumulative difference of the 2-D centre line and the 3-D back-projected centreline is performed. The 3-D centre line of the central bifurcation area can not be directly extracted from the 2-D information, since the information obtained from these 2-D images are hampered by foreshortening and missing information due to overlap in the main vessel and the side branch. Therefore the 3-D centre line within the estimated bifurcation area, defined as the union of both POC from the 2-D projections, is adjusted by fitting a 3-D parametric curve through the estimated bifurcation based on the 3-D centre line just outside the estimated bifurcation area. During the fitting process the location of the detected bifurcation in each 2-D projection is taken into account to assure correct definition of the 3-D centre line. Based on the 3-D centre line combined with the contour information of each 2-D projection, a 3-D model of the bifurcated vessel assuming an elliptical cross-section shape is constructed. In order to correctly reconstruct the central bifurcation area into 3-D, we have to take into account the fact that the contour information obtained from the 2-D projections may contain vessel overlap, since the bifurcated vessel might be partly obscured in one or both of the image projections. To overcome this problem the 3-D cross-section shape is created by using virtual vessel contours within each 2-D POC. These virtual vessel contours are derived in each 2-D projection from the edge information outside the POC. First the centre line covering the POC is redefined using a parametric interpolation technique known as Catmull-Rom splines13 and guided by control nodes extracted just outside the POC (Figure 2). Next, the virtual edge is positioned perpendicular to the new centre line at a distance defined by a linear radius function across the POC.
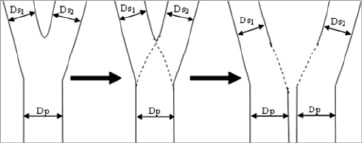
Figure 2. Two virtual vessel contours (i. from the proximal main branch [Dp] to the distal main branch [Ds1], ii. from the proximal main branch [Dp] to the side branch [Ds2]) are created by using aparametric interpolation technique of catmull-row splines.
The central bifurcation area, described as the polygon of confluence (POC) is specifically defined for further analysis. In the previously reported method for 2-D bifurcation software, the point of bifurcation (POB) was defined as a centre of the circle touching the three contours while the POC was defined as the area delineated by the lines perpendicular to the centre line crossing this circle10. Extending the previous reported method to 3-D would suggest using a sphere as a mathematical object to define the POB and POC. However, the central bifurcation area in 3-D shows a “peanut” shape; hence a new method is introduced for defining the POB and POC.
The POC region in 3-D begins at the position where the 3-D centre line bifurcates (red line in Figure 3) and ends where the main and side branches stop coinciding with each other (green lines in Figure 3). In this new definition of the POC in current 3-D analysis, the location of the bifurcation carina is precisely adjusted with minimal overlap, based on the reconstructed 3-D model.
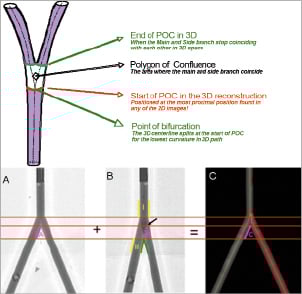
Figure 3. Upper panel: Definition of the polygon of confluence region for optimal 3-dimensional reconstruction. Lower panel: Adjustment of bifurcation carina with minimal overlap. In a 2-D projection (B), the carina looks more distal (green lines) to the actual position (black arrow) due to overlap. After 3-D reconstruction (C), the correct location of bifurcation carina is applied in the projection B.
Calculation of cross-sectional area and diameter values
Cross-sectional areas are calculated on the assumption that the vessel has an elliptical cross section based on the luminal diameters from the two different 2-D projections. Inside of the POC region, the cross-sectional area shows a so-called “peanut” shape. To define in the POC the “bifurcating” cross-sectional areas of the two daughter branches, the POC area is divided into two elliptical shapes along the two centre lines based on the virtual vessel contours.
Figure 4 shows in red (continuous line) one of the cross-sectional areas located in the POC region, the black dotted line indicates the projected diameters (2-D length) obtained in each angiographic view. The missing points in blue (A and B) are the two cross-points between the 2-D diameters obtained in each angiographic view and are based on the virtual vessel contours of the distal main vessel.
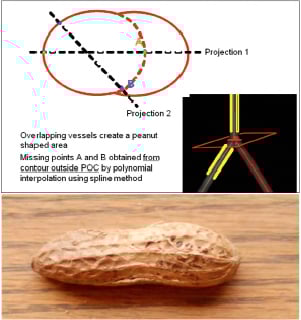
Figure 4. Upper panel shows area measurement inside a polygon of confluence. Since overlapping vessels create peanut-shaped area (lower panel), the points A and B are calculated from contours outside POC by polynominal interpolation to create a virtual ellipsoid area (dotted red line), which is used for area measurement. Lower panel: photograph of a peanut.
In the 3-D reconstruction, the elliptical cross-sectional area is the primary measured parameter. Next to this cross-sectional area, the equivalent luminal diameter, minimum luminal diameter and maximal luminal diameter curves are calculated based on circularity assumption (Figure 5). The minimum diameter represents the maximum circle that fits through the 3-D reconstruction while the maximum diameter represents the minimum circle that encloses the 3-D reconstruction; both are based on the virtual vessel contour when considering the POC.
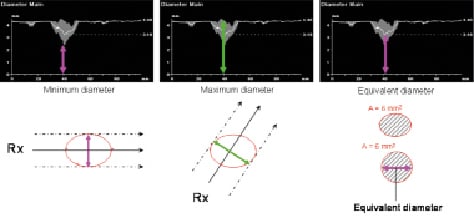
Figure 5. Measurement of diameters. The measured cross-sectional area is converted to a circle with similar cross-sectional area. Thediameter of such circle is called an “equivalent diameter”
Calculation of reference area
For the reference cross-sectional area function, a reconstruction of the “healthy” part of the cross-sectional area function is made based on the 3-D reconstructed model for each of the branches connected at the POC. For this a 3-D equivalent as used in the CAAS single vessel software is used12. These results in a reference function for each of the three vessel branches connected at the POC. These three reference functions are used in the 2-D healthy bifurcation reconstruction algorithm in order to create the 2-D healthy reconstructions as described by Ramcharitar et al10. Ramcharitar described a method to calculate the reference diameter within the POC using a curvature of a circle passing through the termination of reference vessel lines of the proximal and distal vessels at the entrance of POC where the centre of the circle is located outside the vessel, on the line perpendicular to the middle of the line connecting these termination points.
Within the current method, the reference vessel lines up to the entrance of the POC in the 2-D projections, are based on the back-projected 3-D reference area as described before. The “healthy” reconstructed 2-D measurements are then combined into 3-D measurements using a similar approach as described for the cross-sectional area calculation.
Calculation of bifurcation angle
Two bifurcation angles are computed between the PMV and the SB (proximal angle), and between the DMV and the SB (distal angle); they are derived from the 3-D vector of the centre line in the PMV at the start of POC (directed from distal to proximal) and the 3-D vectors of centre line in the DMV and SB at distal ends of POC (directed from proximal to distal). The size of the vector, which can influence the angle, is half the size of the equivalent luminal diameter at the start and end of the POC. This is based on the assumption that the curvature of the vessel is less than its radius. Bifurcation angles are calculated in 3-D space without overlap, and theoretically are more precise than 2-D QCA.
Discussion
Coronary bifurcation lesions are a challenging area in interventional cardiology. The European Bifurcation Club has been established to clarify some of this challenge.14-16 Contemporary studies using drug-eluting stents (vs. bare-metal stents) have shown a reduction of restenosis of the main vessel. Residual stenosis and restenosis at the ostium of the side branch, however, still remains a concern. In addition to the provisional one-stent and two-stent strategy approach using the drug-eluting stents, dedicated bifurcation stents have been designed to specifically address this challenging issues17-23. To adequately determine the application and angiographic outcome of such stents, characterisation of bifurcation lesion pre-procedure and assessment of luminal diameter post-procedure and at follow-up is mandatory by means of quantitative coronary angiography. Because two-dimensional QCA in bifurcation lesion is limited by foreshortening and overlap, there has been recent interest in 3-D QCA for bifurcation lesions. Although there are multiple software programs dedicated for 3-dimensional quantitative coronary angiographic analysis, there are only two software packages dedicated for bifurcated 3-D QCA (Paieon and Pie Medical). So far, there is no direct comparison between these two QCA bifurcation software packages (Paieon vs. Pie), both of which reconstruct 3-D from two projections.
Over the years many techniques have been published describing methods for 3-D coronary reconstruction based on monoplane angiography, biplane angiography and more recently, 3-D reconstructions from rotational angiography24-28. Three-dimensional coronary reconstruction was introduced in the mid 80’s and was mostly restricted by using angiography biplane systems. One of the limitations was the need for a geometric calibration procedure to assess the 3-D system geometry29,30. In addition, 3-D reconstruction was inaccurate due to the distortion introduced by the conventional X-ray image intensifier systems31. With the introduction of the digital flat panel (DFP) technology this geometric distortion was eliminated and the new storage capabilities with the introduction of the Digital Imaging in Communication in Medicine (DICOM) standard eliminated the need for 3-D system calibration. The DICOM standard provides the necessary X-ray system information needed to perform a 3-D reconstruction. Coronary 3-D reconstruction algorithms purely based on the 3-D system information, the so-called epipolar geometry reconstruction technique, provide only accurate reconstructions in those cases, where the vessel is roughly perpendicular to the X-ray beam29. In the case where the vessel morphology is roughly parallel with the X-ray beam, the epipolar reconstruction technique fails due to multiple 3-D solutions. Another restriction of this technique is the erroneous assumption that the projected coronary artery from the acquired views is spatially identical31,32. In practice this assumption is untenable, due to (relatively large) respiratory motions and cardiac contraction motions. Even when using a biplane system, there is a short time delay between the lateral and frontal C-arm detector, which is enough to generate inaccurate 3-D coronary reconstructions. The CAAS 5 3-D bifurcation software, incorporates an alternative new epipolar reconstruction technique for reconstructing a bifurcated vessel, combined with correcting for the system distortion introduced by the isocentre offset.
In single vessel analyses, 3-D QCA has been shown to be more accurate than 2-D QCA regarding measurement of lesion length. In a sub-study of the ABSORB cohort A trial by Bruining et al33, the length of bioresorbable scaffold made of polylactide (12 mm) was measured in multiple modality images (3-D QCA, 2-D QCA, IVUS and MSCT) using two metallic markers as landmarks, which are located in the both ends of the scaffold. The length of the 12 mm scaffold was measured as 9.89±0.93mm, 12.24±0.55, 12.51±0.85 and 11.89±0.20 mm with 2-D QCA, 3-D QCA, QCU and QMSCT-CTA, respectively. Two-dimensional QCA apparently underestimated the scaffold length, while 3-D QCA and QCU had similar results, very close to the actual length of 12 mm. In clinical settings, measuring the lesion length with 3-D QCA compared to 2-D QCA might be therefore more useful.
One of possible benefits of using 3-D QCA analysis is to predict outcomes of bifurcation treatment. The bifurcation angle has been shown to relate not only to the difficulty level of the procedure but is also associated with intermediate outcomes. Dzavik et al reported that a bifurcation angle over 50º was an independent predictor of MACE at one year after bifurcation crush stenting in 133 patients34. In 132 patients receiving Cypher stent in bifurcations excluding left main lesions, Adriaenssens et al reported that increasing bifurcation angles is an independent predictor of binary restenosis (HR 1.53 [1.04–2.23] per 10 degree increase in angulation) after culotte stenting35. Recently, in the sub-study of the Syntax study, Girasis et al reported that the bifurcation angles utilising 3-D QCA software have a slight but non-significant correlation with 1-year outcomes. When 2-stent techniques were employed, the result was a trend towards higher event rates for patients with wider angled LM bifurcations.
In the CAAS 5 3-D bifurcation software, bifurcation angle measurements are more accurate and robust due to the knowledge of the true 3-D vessels’ morphology obtained from the 3-D model. In 2-D QCA analysis, optimal assessment of bifurcation angles necessitates three planes that involve two branches (e.g., PMB+DMB, DMB+SB, PMB+SB), to avoid potential underestimation or overestimation of bifurcation angles. For example, one 2-D projection can be taken without any overlap/foreshortening for the distal main branch and side branch, however this projection may not necessarily be the optimal projection to separate the proximal main and side branch, or the proximal main and distal main branch. Three-dimensional QCA definitely addresses this issue by reconstructing a 3-D model and calculating the vectors of 3-vessels (e.g., the proximal main, distal main and side branch) in 3- dimensions without overlap. The system uses the 3-D model in combination with the method of quantitative bifurcation lesion analysis as introduced in the previous paper to obtain bifurcation lesion characteristics10. The basic concepts introduced in the previous paper are projected to the current 3-D methodology, resulting in a quantitative analysis of the 3-D bifurcation as a single entity.
To use this software in clinical practice, it is of importance during a procedure to take two separate images with the least overlap. However, in reality, such images are not frequently available. In a study aiming at measuring the bifurcation angle of the left main with 3-D QCA software36, the two separate images were available in only 50% of the angiographic acquisitions. The operator should bear in mind that two separate images are at least necessary to enable optimal assessment of bifurcated lesions with 3-D software.
The current methodology suffers from several limitations. Since 3-D reconstruction consists of two projections, the issue of overlapping vessels in tortuous bifurcation lesions may still be a problem. Taking into consideration the complexity of bifurcated lesions and the difficulty to take cineangiograms without overlap, one can speculate that reconstruction utilising more than two projections may yield optimal 3-D images, at the expense of the increasing complexity of analytical software. Further developments towards using multiple projections are in progress. Furthermore, reproducibility and accuracy, and the potential clinical benefits of using 3-D QCA for bifurcation lesions should be the focus of future studies.
Conflict of interest statement
J.P. Aben and C. Lokkerbol are employees of Pie Medical Imaging BV. M.A. Morel is an employee of Cardialysis BV. The other authors have no conflicts of interest to declare.
References