Abstract
Aims: Validation of new three-dimensional (3-D) bifurcation quantitative coronary angiography (QCA) software.
Methods and results: Cardiovascular Angiography Analysis System (CAAS 5v10) allows 3-D angiographic reconstructions based on two or more 2-D projection images. Measurements for minimal lumen diameter (MLD), reference vessel diameter (RVD), percent diameter stenosis (DS) and bifurcation angle (BA) were validated against precision manufactured phantom bifurcations. Length measurements were validated against angiographic measurement catheters inserted into a plexiglas bifurcation phantom. In 3-D reconstructions based on two 2-D images, acquired at variable rotation and angulation, accuracy and precision (mean difference ± SD) of the 11-segment model for MLD, RVD and DS were 0.013±0.131 mm, –0.052±0.039 mm and –1.08±5.13%, respectively; inter-observer variability was 0.141 mm, 0.058 mm and 5.42%, respectively. Adding the antero-posterior (optimal) projection to these basic reconstructions resulted in reduced variability (0.101 mm, 0.041 mm and 3.93% for MLD, RVD and DS, p<0.01 for all) and showed a trend towards improved precision (0.109 mm, 0.031 mm and 4.26%, respectively, p>0.05 for all). In basic reconstructions, accuracy and precision for BA was –1.3±5.0°, whereas inter-observer variability was 7.5°; respective measures for length were 0.15±0.26 mm and 0.54 mm. Adding the antero-posterior projection resulted in decreased precision (0.47 mm, p<0.01) and increased variability (1.03 mm, p<0.01) for length measurements; precision (5.4°) and variability (7.9°) for BA did not change significantly (p>0.30).
Conclusions: Advances in the methodology of 3-D reconstruction and quantitative analysis for bifurcation lesions translated into highly accurate, precise and reproducible measures of diameter, length and BA.
Introduction
Percutaneous coronary interventions (PCIs) for the treatment of coronary bifurcation lesions require optimal angiographic analysis1; whereas visual assessment of lesion severity is still highly variable even among experts in this field2, quantitative coronary angiography (QCA) analysis has seen improvements in performance. Dedicated two-dimensional (2-D) bifurcation QCA software acknowledges the “step-down” in vessel calibre from the proximal main vessel into the distal main vessel and the side branch3 by determining reference vessel diameter (RVD) based on each of the three branches separately4,5. Thereby, higher precision in RVD and percent diameter stenosis (DS) values are attained, facilitating accurate balloon and stent sizing. In addition, reporting results over an increased number of bifurcation vessel segments facilitates accurate disease localisation and consistency in serial angiographic studies1.
Nevertheless, the validity of 2-D QCA is dependent on the angiographic view analysed and can be affected by foreshortening and variable magnification; tortuous and/or overlapping coronary structures could impose further limitations6. By eliminating these potential sources of error, 3-D QCA algorithms have been shown to provide accurate, precise and reproducible diameter, area and length measurements7-10 for single-vessel lesions in real time. Experience with 3-D bifurcation reconstructions has been reported comparing results with 2-D analysis11,12; however, accuracy and precision of 3-D bifurcation QCA measurements has not been established compared to a gold standard.
Dedicated 3-D bifurcation QCA software incorporated in the latest version of Cardiovascular Angiography Analysis System (CAAS 5v10; Pie Medical Imaging, Maastricht, The Netherlands) adopts algorithms already validated in the 2-D software4,13 and applies them to the 3-D reconstructions. Furthermore, the methodology has been revised compared to the previous version14, in order to allow reconstructions of more than two 2-D projections. In this report we present the theoretical provisions of this software and the results of in vitro validation for measures of diameter, length and bifurcation angle (BA).
Materials and methods
THEORETICAL PROVISIONS
A 3-D reconstruction requires at least two angiographic images separated by a viewing angle ≥30°; up to four images acquired by a biplane, monoplane or a rotational angiographic system can be combined. Analysis is initiated by demarcating the bifurcation to be analysed on the first selected angiographic image. Subsequently, automatic contour detection is performed via a validated algorithm featuring improved analysis for small vessel lumens13. The region of interest is automatically indicated in the other selected image(s), thereby assisting the analyst in correctly placing the delimiter points around the bifurcation, which is then contoured with the same algorithm.
3-D RECONSTRUCTION
The acquisition geometry of the projection images provided through the DICOM (Digital Imaging and Communications in Medicine) headers of the angiographic system is not sufficient to obtain an accurate 3-D reconstruction due to the isocentre offset of the gantry. The isocentre offset is the spatial difference between the centres of rotation (isocentres) of the frontal and lateral C-arms in a biplane gantry, attributable mainly to the imperfect alignment of both C-arms but also to gravity; even in a monoplane system active gantry rotation could result in a significant shift of its isocentre. In order to correct for this system distortion, a common image point (CIP) is determined by correlating the videodensitometric information obtained from the 2-D images. Subsequently, the 3-D centrelines for the bifurcation branches are reconstructed by means of an adaptive 3-D epipolar geometry algorithm14. Respective 3-D cross-sections are constructed assuming an elliptical model, by using the luminal diameters of the corresponding 2-D cross-sections and their spatial orientations to define the ellipse axes. In cases where >2 projections are used, already existing cross-sections are modified by integrating contour information from each additional 2-D image, while retaining an elliptical shape. In this fitting process, axes between adjacent cross-sections are kept aligned, in order to prevent the 3-D model from twisting along its centreline. For true 3-D quantitative analysis the elliptical model is then converted into a 3-D triangular surface mesh by means of a marching cubes algorithm15.
3-D QUANTITATIVE ANALYSIS
Analogous to previous publications on bifurcation QCA analysis14-16, the polygon of confluence (POC) is defined as the central bifurcation region which behaves differently from a single-vessel segment. Outside the POC, the cross-sectional area is defined perpendicular to the centre of the lumen; within the POC, the cross-sectional area is defined by using the “minimum energy” cross-section, i.e., the smoothest possible surface that spans the lumen at each centre line position. This “minimisation” is performed by using a level set algorithm17 and will result in curved cross-sections within the central bifurcation region (Figure 1).
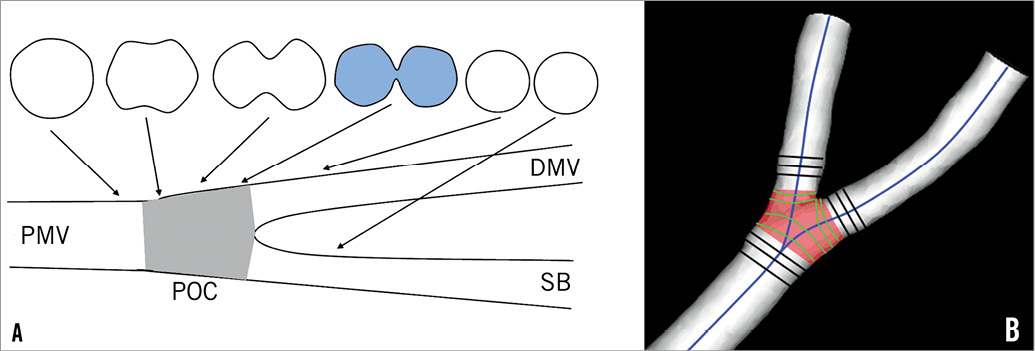
Figure 1. Definition of polygon of confluence (POC). A) Within POC (grey) the vessel is slowly widening, but at the same time the top and bottom are slowly collapsing towards a single point (figure-of-eight shape, in blue) after which we have two “normal”-shaped vessels. B) The start of the POC (in red) is defined as the position where plane cross-sections give way to curved ones; exactly the opposite marks the end of the POC. DMV: distal main vessel; PMV: proximal main vessel; SB: side branch
Automatic calculation of reference cross-sectional area adopts the methodology described for 2-D bifurcation QCA and applies it to the 3-D reconstructed model. Outside the POC, a 3-D equivalent of the algorithm used in single-vessel segments is employed13,18. Within the POC, the reference area is derived by applying an interpolation technique between the “healthy” reconstructed 3-D branches. Based on the respective cross-sectional areas, lumen diameter and RVD are defined as the equivalent diameters based on the assumption of circularity. Finally, proximal and distal BA values are derived according to the methodology already described14.
The CAAS 5v10 analysis software has no restriction regarding the number of bifurcations the 3-D model consists of: it is possible to reconstruct and analyse a vascular tree which consists of multiple bifurcations. We chose to focus on 3-D reconstructions of one bifurcation at a time, in order to mimic routine angiographic practice. Analysis regarding full-tree reconstructions of bifurcation phantoms is presented in an Online appendix.
VALIDATION
DIAMETER AND BA
Six precision-manufactured plexiglas phantoms, each mimicking a vessel with three successive bifurcations lesions, were used for the validation of minimal lumen diameter (MLD), RVD, DS and BA measurements. Their design has already been described in detail19. In total, 54 phantom vessel segments of reference diameter 1.40-4.00 mm were evaluated; 33 of them had a stenosis within 3-5 mm of the bifurcation (DS 40.6-80.5%; MLD 0.53-1.96 mm), whereas the rest were free of stenoses (MLD 1.40-4.00 mm). Proximal and distal BA range was 90.4-159° and 39.5-102.9°, respectively. Digital angiograms were acquired on a biplane angiographic system (Axiom ArtisTM; Siemens, Forchheim, Germany); all phantoms were filled with 100% Iodixanol 320 (VisipaqueTM; GE Healthcare, Cork, Ireland) and imaged at 30 frames per second in a 20 cm field of view. Multiple projections were acquired for variable degrees of gantry rotation and angulation. For validation purposes, five 2-D projections including the anteroposterior (AP) projection were employed in multiple combinations. Our reconstruction protocol is shown in Figure 2.
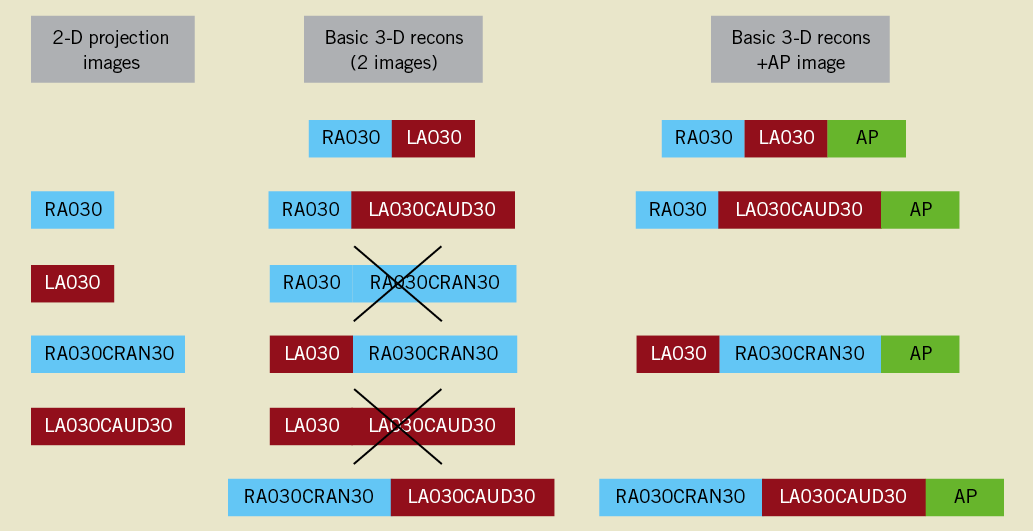
Figure 2. 3-D reconstruction protocol. For every phantom bifurcation, four 2-D projection images were combined into four separate 3-D reconstructions using two 2-D images at a time. Two potential combinations were a priori excluded, on the basis of providing limited information. The anteroposterior image (AP) was added to every one of these basic reconstructions, creating a second set of replicate 3-D QCA measurements. RAO/LAO: right/left anterior oblique (rotation); CRAN/CAUD: cranial/caudal angulation
A standard operator procedure for angiographic analysis was followed, wherein: 1) analysis was performed on the middle frame of every angiographic image acquisition; 2) delimiter points were placed at the furthest possible distance from the bifurcation to be analysed, but not touching the adjacent bifurcation lesions or the phantom borders; 3) manual contour correction was not allowed; however, contour detection could be adjusted by using the “restriction” option, thereby excluding gross image artefacts without manually redefining the detected contours18; 4) if the location of the automatically defined CIP differed between images, the user could manually reposition it to an easily identifiable landmark, preferably the centre of the bifurcation.
Reconstruction resulted in a 3-D representation of the analysed bifurcation, displayed in the optimal projection, which was defined as the projection where mean foreshortening of the bifurcated vessels was minimised; quantitative analysis was reported according to the validated 11- and 6-segment models (Figure 3)4,13. Segments 2, 3 and 5 of either model reflect the segments, where in clinical practice the stent would be placed in the proximal main vessel, distal main vessel and side branch, respectively. MLD, RVD and DS values for these segments were pooled together and compared to the phantom values. Angle calculations are independent of the bifurcation segment model used. Proximal and distal BA values were pooled together and compared to the phantom angles.
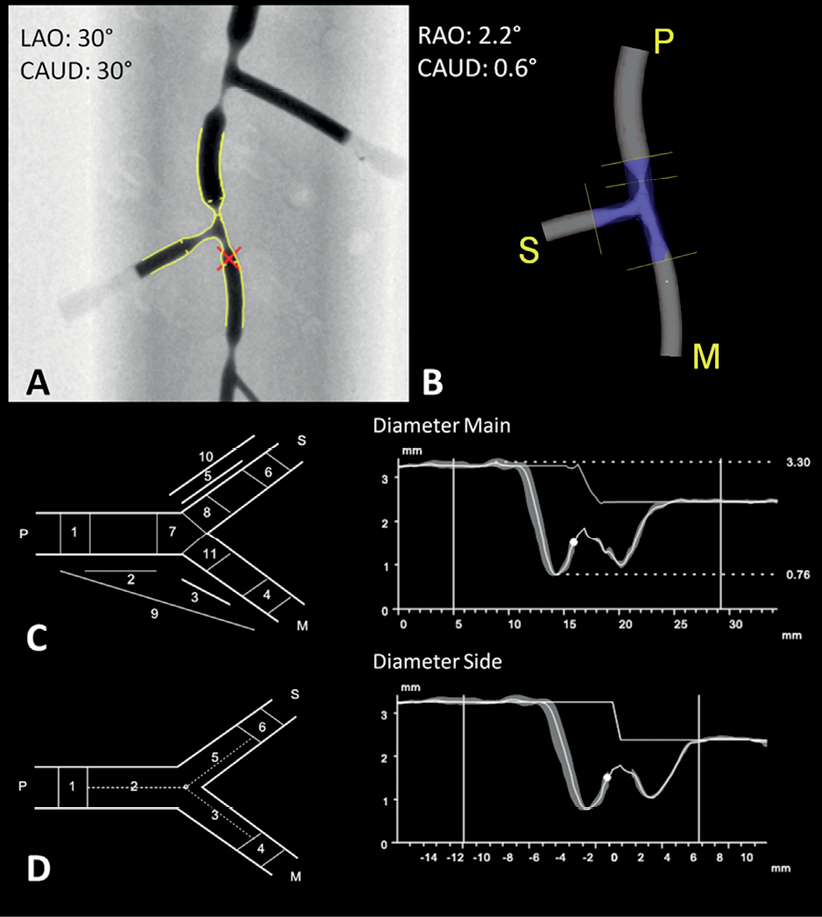
Figure 3. 3-D reconstruction and quantitative analysis (compilation). Phantom 2, bifurcation 2 was analysed in two projection images, one acquired at LAO30CAUD30 (A) and one at RAO30CRAN30 (not shown); the red cross indicates the common image point (CIP). B) 3-D reconstruction is shown in the optimal projection; P, M and S stand for PMV, DMV and SB. C) 11-segment model. Left: schematic; right: diameter graph with RVD curve for PMV into DMV. D) 6-segment model. Left: schematic; right: diameter graph with RVD curve for PMV into SB. RVD function is independent of segment model used. In both graphs, automatic reference analysis was applied. RAO/LAO: right/left anterior oblique (rotation); CRAN/CAUD: cranial/caudal angulation
LENGTH
Due to the lack of reproducibly identifiable markers on the aforementioned bifurcation phantoms, we used a different experimental set-up for the validation of length measurements (Figure 4). Two 5 Fr Cook measurement catheters (Cook Medical, Bloomington, IN, USA) with a marker distance of 10 mm were inserted into a hollow plexiglas bifurcation phantom with an inner diameter of 4.3 mm. Measurement catheters were aligned in the proximal main vessel, one extending into the distal main vessel, the second one extending into the side branch. In order to distinguish between the two branches, a copper marker was mounted on the distal main vessel. The phantom was imaged on the same angiographic system at 30 frames per second in a 25 cm field of view, and the same reconstructions protocol was followed. Within each 3-D reconstruction, 18 inter-marker segments of variable length (ranging from 20 mm up to 80 mm) were measured from leading edge to leading edge, all of these segments covering the central bifurcation region.
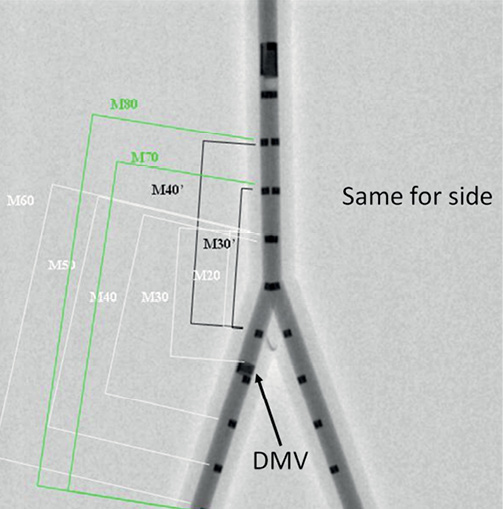
Figure 4. Experimental set-up for validation of length measurements. Measurement catheters aligned in a plexiglas bifurcation phantom, one extending into the DMV, the second one extending into the side branch; DMV is identified by a copper marker on the catheter (arrow). Inter-marker segments of variable length are indicated on the DMV side, all of them covering the central bifurcation region. The same segments were defined and measured on the second catheter as well. DMV: distal main vessel
All QCA analyses were performed off-line by two experienced analysts (CG, TM), independently from each other.
STATISTICS
Statistical analysis was performed using SPSS 17.0 for Windows (SPSS Inc., Chicago, IL, USA). Continuous variables are presented as mean ± 1 standard deviation and compared with the paired-samples t-test; categorical variables are presented as counts. Replicate measurements reflecting multiple 3-D reconstructions of the same bifurcation were averaged separately for each analyst. The within-segment deviation of these replicate measurements was reported as the measurement error20 and was integrated in the calculation of the final precision/variability estimates following Bland-Altman methodology21.
The first analyst carried out two full rounds of measurements with a time interval of two weeks, in order to determine intra-observer variability. The first round of measurements was compared both with the measurements of the second analyst to determine inter-observer variability and with the corresponding true values for the purpose of validating the software against the ground truth. Bland-Altman analysis was performed for all comparisons22.
Regarding intra- and inter-observer comparisons, the mean difference (bias) and its standard deviation were calculated; the repeatability coefficient (1.96×standard deviation) was determined as the measure of variability. For validation purposes, the signed differences between QCA measurements and the true values were averaged: the mean of these signed differences is a measure of accuracy, and the standard deviation is a measure of precision. Measures of accuracy were compared with the paired t-test; measures of precision/variability were compared with the F-test. As the true values were known, we chose to plot these on the X-axis of the Bland-Altman plot against the signed differences and computed the corresponding 95% limits of agreement22.
All statistical tests were two-sided and a p-value <0.05 was considered statistically significant.
Results
MLD-RVD-DS
Accuracy and precision for 3-D reconstructions of individual phantom bifurcations are shown in Table 1. MLD values for 3-D reconstructions of two projections (basic reconstructions) had an accuracy and precision of 0.013±0.131 mm and -0.024±0.150 mm for the 11- and 6-segment models, respectively, not being significantly different from phantom values (p-value 0.44 and 0.24). The reference size of phantom vessels was underestimated by an average 0.05 mm in both models, whereas DS estimates did not differ significantly from true values, precision being in the order of 5%. Adding the AP projection to the basic reconstructions resulted in improved precision for MLD, RVD and DS values for the 11-segment model (0.109 mm, 0.031 mm and 4.26%, respectively) (Figure 5); however, improvement did not reach statistical significance for any parameter (p>0.05).
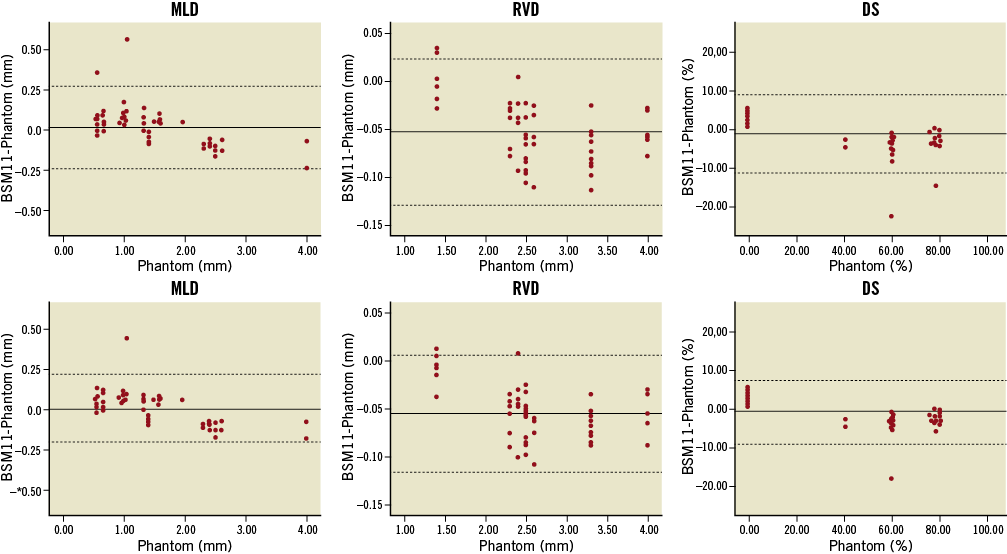
Figure 5. Bland-Altman plots comparing 11-segment model results to the phantom values. 3-D reconstructions combining two (upper panel) or three 2-D images (lower panel) were validated for measures of minimal lumen diameter (MLD), reference vessel diameter (RVD) and percent diameter stenosis (DS). Automatic reference obstruction analysis was always used. Solid lines represent the mean difference; dotted lines represent the 95% limits of agreement (±1.96 SD). BSM11: 11-segment model
VARIABILITY
Bias, standard deviation and repeatability coefficient for the basic reconstructions are reported in Table 2. Adding the AP projection to the basic reconstructions resulted in increased inter-observer reproducibility for the 11-segment model, the repeatability coefficient being 0.101 mm for MLD, 0.041 mm for RVD and 3.93% for DS (p≤0.01 for every parameter). On the contrary, variability did not change significantly for the 6-segment model (p>0.05 for every parameter).
INTER-MODEL AGREEMENT
In basic reconstructions, the 11-segment model provided significantly larger (p=0.02) and slightly more precise (p=0.16) MLD values compared to the 6-segment model; as expected, DS estimates were significantly smaller (p=0.02) and also more precise (p=0.34). However, the 6-segment model had a higher inter-observer reproducibility for DS and MLD (p-value 0.02 and 0.11, respectively). Adding the AP projection augmented the difference in precision in favour of the 11-segment model for MLD (p<0.01) and DS (p=0.11) values; there was also a trend towards higher reproducibility compared to the 6-segment model (p>0.05 for both MLD and DS).
BA
Basic 3-D reconstructions underestimated BA by 1.3° (p=0.09) having a precision of 5.0° (Table 2). Intra- and inter-observer bias was close to zero, whereas the repeatability coefficient was 7.8° and 7.5°, respectively. Adding the AP projection resulted in a larger underestimation (–1.9°, p=0.02) and slightly reduced precision (5.4°, p=0.33) (Figure 6), whereas inter-observer variability was 7.9° (p=0.38).
During the analysis the rates of applying restriction were uniformly low, namely 3.9% for reconstructions using either two or three images. The rates of CIP relocation were low for basic 3-D reconstructions (11.1%), whereas they were higher for reconstructions of three projections (31.0%). The CIP had to be relocated most frequently in reconstructions using angulated views.
LENGTH MEASUREMENTS
Compared to true inter-marker distances (46.67±19.40 mm), basic reconstructions showed an accuracy and precision of 0.15±0.26 mm and a measurement error of 0.23 mm; inter-observer bias was 0.07 mm, whereas variability was 0.54 mm. Adding the AP projection resulted in an accuracy and precision of 0.04±0.47 mm (p<0.01 for precision) and a measurement error of 0.50 mm; inter-observer variability was increased (1.03 mm, p<0.01). Relatively large variability between replicate measurements compared to the overall precision estimates resulted in apparently wide limits of agreement around the averaged length values (Figure 6). Nevertheless, both precision and measurement error were negligible when compared with true inter-marker distances.
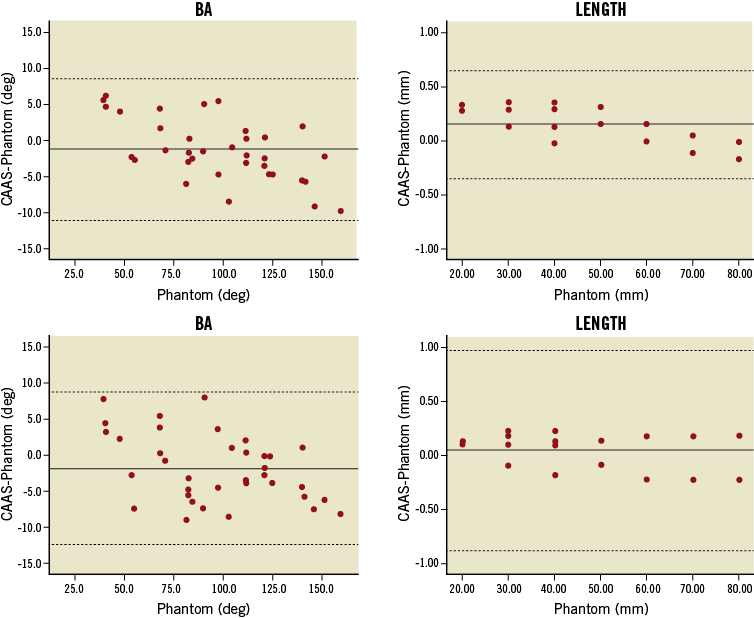
Figure 6. Bland-Altman plots for BA values and length measurements. 3-D reconstructions combining two (upper panel) or three 2-D images (lower panel) were employed. Solid lines represent the mean difference; dotted lines represent the 95% limits of agreement (±1.96 SD). Apparently wide limits of agreement for length measurements resulted from the relatively large variability between replicate measurements compared to the overall precision.
Discussion
The main findings of this study are: 1) the new 3-D bifurcation QCA algorithm is highly accurate, precise and reproducible in terms of RVD; 2) in terms of MLD and DS, 3-D reconstructions using two 2-D projections are highly accurate and quite precise and reproducible; when adding a third projection, a higher level of precision and reproducibility is achieved; 3) BA measurements slightly underestimate the true values, though precision and reproducibility are quite high and relatively unaffected by adding a third projection; 4) length measurements have excellent accuracy and precision and high reproducibility.
A number of major randomised trials are under way in the field of bifurcation PCI. The EXCEL trial will evaluate the effectiveness of left main coronary artery revascularisation comparing PCI using second-generation drug-eluting stents to coronary artery bypass grafting. Bifurcation lesions are expected to represent the largest category of lesions treated23. On the other hand, TRYTON will evaluate the safety and effectiveness of a dedicated bifurcation stent in the treatment of de novo bifurcation lesions. Whereas workhorse angiographic analysis is going to be based on 2-D QCA, 3-D QCA is involved in the evaluation of a sizeable number of patients. Hence, validation of the software’s performance is imperative.
DIAMETER-DERIVED PARAMETERS
Earlier versions of 3-D reconstruction software were validated for measures of vessel diameter in the late 1990s; full coronary tree reconstruction, however, came at the cost of fair accuracy (3%-7% relative error in calculation) and increased time requirements (several hours down to 10 minutes)24,25. Next-generation algorithms focused on the reconstruction of single-vessel segments rather than entire coronary arteries, thereby enabling reliable results to be available in real time7-10,26.
Achieving similar results in the 3-D reconstruction of coronary bifurcations is not a trivial task. For any given bifurcation there is usually one single optimal projection1. It follows that in any other projection certain parts of the anatomy, usually the ostia of the daughter branches, are obscured due to overlap. The new algorithm can retrieve missing information even from a combination of suboptimal views14; however, a reconstruction including the optimal 2-D projection would be expected to be even more robust.
In our study, the basic 3-D reconstructions did not include the AP view, which was the optimal 2-D view due to the phantoms’ orientation. Nevertheless, compared to analysis performed on the same phantom bifurcations using 2-D CAAS , 3-D software showed similar accuracy and precision: in images acquired at 30° rotation respective 2-D measures were 0.035±0.10 mm for MLD, –0.004±0.041 mm for RVD and –0.74±4.52% for DS13. Moreover, since the same contour detection algorithm was used, the extent of overestimation for small true MLD values (≤0.70 mm) was uniformly limited in both 2-D and 3-D analysis. However, whereas full automatic calibration was readily available in 3-D QCA, for the purpose of 2-D validation the pixel size had to be derived off-line based on geometric calibration. Contrary to our phantoms, the course of coronary vessels does not usually lie on a single plane inside the human thorax. Hence, vessel segments analysed on a 2-D angiographic image are subject to errors from variable magnification, since an automatically derived pixel size can be valid on only one plane10. Naturally the same phenomenon applies to catheter calibration as well.
Adding the AP view to the basic 3-D reconstructions resulted in improved precision and reproducibility for all diameter-derived parameters in our study. One may argue that combining more than two 2-D images is rarely feasible at any stage during a procedure, at least not retrospectively, as there are simply not enough images available which are also suitable for a 3-D reconstruction27. However, when used on-line, this innovation can be clinically relevant. Even if the optimal view is not among the images initially acquired, it can be suggested by a 3-D reconstruction based on two suboptimal views; time requirements (<10 sec for reconstruction of two images, <60 sec for three images) should not be an issue. However, limitations imposed by patient anatomy (vessel overlap) or proximity between the gantry and the patient/table may make it difficult to acquire the optimal view exactly as suggested10.
RVD-DS
Highly accurate, precise and reproducible RVD measurements were achieved by combining a validated algorithm for automatic RVD derivation in bifurcation lesions with genuine 3-D calculations. Thereby, instead of performing a tedious and arbitrary single-vessel analysis for all three branches separately, RVD and DS values can be derived in the time of a single analysis, having at the same time all the advantages of the 3-D reconstruction. When applied on-line, 3-D QCA-derived information may potentially complement or even substitute invasive imaging modalities in stent sizing and deployment, thereby minimising adverse event rates.
Furthermore, 3-D QCA-derived MLD and DS values for bifurcation lesions should be expected to have a better correlation with respective fractional flow reserve (FFR) values, when compared to 2-D measures28,29. It is not implied that a single angiographic measure can fully reflect all anatomic and haemodynamic parameters that determine the functional significance of a lesion30; however, we believe that spatially accurate measurements will help improve periprocedural strategy in bifurcation PCI.
SEGMENT MODELS
Agreement between models in the new software looks diminished compared to 2-D validation; however, the difference in results for MLD and DS was largely driven by a small number of outliers in MLD detection, resulting from different segment definitions between models13. Cases where the MLD was located in the POC rather than segments 2, 3 or 5 resulted in overestimates for the 11-segment model. On the contrary, cases where a stenosis-free proximal main vessel impinged on a distal stenosis resulted in underestimates for the 6-segment model. Similar differences were already observed in 2-D analysis, only to be inflated in the process of 3-D reconstruction. The fact remains that the 6-segment model offers a quick overview of results during a procedure, whereas the 11-segment model is more of a research tool providing more detailed information. Nevertheless, it appears that the algorithms are not mutually interchangeable when it comes to long-term angiographic analysis: whichever algorithm is adopted for reporting results pre- and post-procedure would have to be used at follow-up as well.
BA
Angle calculations have recently gained attention due to growing evidence that wider distal BA values might lead to a worse outcome, especially with two-stent techniques27,31,32. To our knowledge, there is a single validation study on 3-D derived BA reporting an underestimation of the phantom values by 2.6° and a standard error of the estimate equal to 0.7725. In our study, BA accuracy and precision were improved compared to the 2-D QCA software validation (–3.1±6.2° in rotated views), which was not unexpected. This difference might have been more pronounced if our phantom bifurcations had lain in more than one plane. This could also explain the lack of improvement seen following the addition of the optimal view. Currently, there is a binary approach regarding BA size: several cut-off values (50°, 70°) have been proposed; however, definitions and measurement methods are still at variance. Pending more detailed data from 3-D QCA-based computations regarding the effect of BA on outcome, precision of 5.0° is considered high.
LENGTH
One of the most acknowledged advantages of 3-D QCA is its accuracy in length derivation. Foreshortening in 2-D analysis may result in erroneous sizing and deployment of stents. This could translate either into incomplete lesion coverage and the need for additional stents or into excessive stent length, jailing of a side branch and increased restenosis rates33. This is why length measurements have the most comprehensive validation. Demarcated wires8, wire phantoms10, stent balloons9 or stented coronary segments, identified by radio-opaque markers34, and 3-D reconstructions based on fusion of angiography and intravascular ultrasound26 have all been used as a gold standard. In our study, length measurements were performed on demarcated catheter segments spanning the phantom bifurcation, thereby proving that they are consistent and impervious to bifurcation region definitions. Variability, albeit negligible, is assumed to correlate with the marker placement procedure, which was not automated but relied on the analysts’ visual perception.
LIMITATIONS
In vitro validation has the obvious limitation of being based on static objects, acquired under ideal angiographic conditions. In our phantom bifurcations, lesions were circular-shaped in cross-sectional view for design simplicity and due to manufacturing constraints19. On the contrary, more than 50% of coronary lesions are asymmetric, where 2-D analysis is known to be inaccurate35. Furthermore, as opposed to straight phantom vessel segments, coronary vessels usually have curved trajectories, which augment the effect of foreshortening in 2-D projection images10,11. Taking the calibration issues already mentioned into account, we have to assume that the incremental value of 3-D bifurcation QCA as compared to 2-D analysis may have been underestimated.
Recently, minimal lumen area and percent area stenosis were shown to have a higher power for predicting reduced FFR values, when compared to the respective diameter-derived parameters29. In our study only diameter-derived measures were reported. However, due to the symmetric design of the phantom bifurcation lesions and because of the circularity assumption in diameters’ derivation from respective cross-sectional areas, our findings are transferable to area-derived parameters as well.
Conclusions
The new dedicated 3-D bifurcation QCA software allows angiographic reconstructions of more than two 2-D projection images, and features novel 3-D quantitative analysis of bifurcation lesions. These advances translate into accurate, precise and reproducible measures of diameter, length and bifurcation angle. There is still work to be done regarding the in vivo validation of this software, in order to determine the clinical relevance of these data.
Conflict of interest statement
JP. Aben and S. Soekhradjare are employees of Pie Medical Imaging. MA. Morel is an employee of Cardialyis BV. The other authors have no conflicts of interest to declare.
ONLINE APPENDIX
Software validation for full-tree 3-D reconstructions of bifurcation phantoms
This appendix complements the main manuscript “Advanced three-dimensional quantitative coronary angiographic assessment of bifurcation lesions: methodology and phantom validation” and provides the results from additional analyses.
The new three-dimensional (3-D) bifurcation quantitative coronary angiography (QCA) algorithm has no restriction regarding the number of bifurcations the 3-D model consists of; it is possible to reconstruct and analyse a vascular tree which consists of multiple bifurcations.
Methods
In order to investigate the accuracy, precision and reproducibility of this methodology, we performed full-tree 3-D reconstructions for the entire series of bifurcation phantoms1: images acquired at 30° rotation, in right and left anterior oblique (RAO-LAO) projection were combined. The operator procedure for angiographic analysis was amended accordingly, wherein: 1) for every given phantom, delimiter points were placed in the proximal main vessel of the proximal bifurcation, in the distal main vessel of the distal bifurcation and in a side branch of any of the three bifurcations: by default we chose to begin with the side branch of the proximal bifurcation; 2) the remaining side branches were added to the phantom tree (one at a time), by indicating the junction point with the contoured main vessel and a distal delimiter; the first two steps were then repeated in the next image; 3) reconstruction was performed for the entire phantom, and the common image point (CIP) was relocated as appropriate; 4) in the 3-D reconstructed phantoms one bifurcation was selected and analysed at a time (region of interest could be edited in order that analysis was not influenced by adjacent bifurcation lesions); 5) quantitative analysis was performed and reported for minimal lumen diameter (MLD), reference vessel diameter (RVD), percent diameter stenosis (DS) and bifurcation angles (BAs) as described in the main manuscript. Results were compared with the true phantom values and with separate 3-D reconstructions of individual bifurcations using the same combinations of images (30° RAO-LAO).
Results
MLD-RVD-DS
Accuracy and precision for full-tree and individual 3-D reconstructions are shown in Table 1. MLD values for full-tree reconstructions had an accuracy and precision of 0.012±0.135 mm and –0.021±0.155 mm for the 11- and 6-segment models, respectively, not being significantly different from phantom values (p-value 0.51 and 0.33). The reference size of phantom vessels was underestimated by an average 0.06 mm in both models, whereas DS estimates did not significantly differ from true values, precision being in the order of 5%. Accuracy and precision did not differ significantly between full-tree and individual reconstructions.
Inter-observer variability for 11- and 6-segment models was 0.146/0.155 mm for MLD, 0.038/0.039 mm for RVD and 5.59/5.41% for DS values.
The 11-segment model was more accurate (p=0.05) and precise (p=0.16) for MLD, while the 6-segment model was more accurate (p=0.04) for DS values; difference in DS precision was not significant (p=0.47).
BA
Full-tree 3-D reconstructions underestimated BA by 2.1° (p=0.01) having a precision of 4.7°; individual reconstructions had slightly increased accuracy (–0.9°, p=0.16) but equal precision. Inter-observer bias was 0.7°, whereas the repeatability coefficient was 8.8°.
SUMMARY
The performance of the new 3-D bifurcation QCA software in full-tree reconstructions of the bifurcation phantoms was comparable, but slightly inferior to the results attained from reconstructions performed separately for each individual phantom bifurcation.