Abstract
Aims: The aims of this study were to compare strut tissue coverage at six-month follow-up after Nobori biolimus-eluting stent (N-BES) versus sirolimus-eluting stent (SES) implantation.
Methods and results: A total of 120 patients with a single stenotic lesion requiring revascularisation were randomly assigned to either N-BES (n=60) or SES (n=60). Baseline optical coherence tomography (OCT) was performed post stent implantation, and follow-up OCT was scheduled at six months. Post-intervention and follow-up OCT analyses were available in 51 (85.0%) and 52 (86.7%) patients, respectively. The primary endpoint was the percentage of uncovered struts at follow-up OCT in all cross-sections with analysis of 0.2 mm longitudinal intervals. In addition, an OCT contour plot analysis was constructed to investigate the distribution patterns of uncovered struts. The percentage of uncovered struts of N-BES was significantly lower versus SES (15.9±12.2% versus 25.1±18.3%, respectively, p=0.003). N-BES showed a greater NIH thickness than SES (median [interquartile range] 52.4 μm [41.9-74.9] versus 42.1 μm [30.6-56.0], p=0.005). Contour plot analyses showed a lower incidence of a diffuse distribution pattern of uncovered struts (46.8% versus 75.0%, respectively, p=0.022).
Conclusions: This randomised OCT study showed that N-BES had a significantly lower percentage of uncovered struts, and less common diffuse distribution pattern of uncovered struts versus SES.
Introduction
Although drug-eluting stents (DES) substantially reduce restenosis compared to bare metal stents, late stent thrombosis contributing to the long-term safety of DES has emerged as a major safety concern1. The presence of permanent polymers in first-generation DES has been implicated as being responsible for a hypersensitivity reaction that might cause incomplete re-endothelialisation and contribute to late stent thrombosis2. To overcome these issues, some new-generation DES utilise a biodegradable polymer3-5. Among these, the recently developed Nobori® coronary stent (Terumo Corp., Tokyo, Japan) utilises a biodegradable polymer and the antiproliferative agent biolimus-A9, an analogue of sirolimus, coated on the abluminal side of the stent surface6,7. Previous studies have suggested that biolimus-eluting stents were not inferior to sirolimus-eluting stents (SES)4,8-10.
To date, there have been no randomised trials comparing strut coverage between the Nobori biolimus-eluting stent (N-BES) versus SES using optical coherence tomography (OCT), which is a promising technique for in vivo stent strut level analysis on a microscopic scale11-14. Recent advances in frequency domain OCT have enabled three-dimensional reconstruction as well as enhanced two-dimensional cross-sectional image analyses12,15,16. Therefore, we used frequency domain OCT to compare stent strut tissue coverage at six-month follow-up after N-BES versus SES implantation. Both cross-sectional analysis and contour plot reconstruction17 were performed for a comprehensive understanding of vascular responses to DES, including the distribution patterns of uncovered struts, between N-BES and SES.
Methods
STUDY POPULATION
This study was a prospective, open-label, randomised trial conducted at a single centre (Severance Cardiovascular Hospital, Yonsei University College of Medicine, Seoul, South Korea), ClinicalTrials.gov identifier: NCT01502904. A total of 120 patients who met the study criteria were randomly assigned to treatment with N-BES (Nobori®; n=60) or SES (CYPHER Select™; Cordis, Johnson & Johnson, Warren, NJ, USA; n=60) (Figure 1). OCT examination was performed post procedure and at six-month follow-up. Patients at least 20 years old with stable angina or acute coronary syndrome considered for percutaneous coronary intervention (PCI) of a single de novo lesion ≥70% diameter stenosis on visual estimation were eligible for participation. Angiographic inclusion criteria were a reference vessel diameter of 2.5 to 3.5 mm and lesion length ≤24 mm that could be covered by one 2.5 to 3.5 mm stent with a length ≤28 mm. Exclusion criteria were diffuse long lesions requiring multiple or long (>28 mm) stents; complex lesions such as aorto-ostial or unprotected left mains, in-stent restenosis, thrombus, severe calcification, chronic total occlusion, or graft lesions; contraindication to antiplatelet agents; creatinine level >2.0 mg/dL or end-stage renal disease; pregnant women or women with childbearing potential; and left ventricular ejection fraction <35%. This randomised study was approved by the institutional review board of our institution, and written consent was obtained from all enrolled patients.
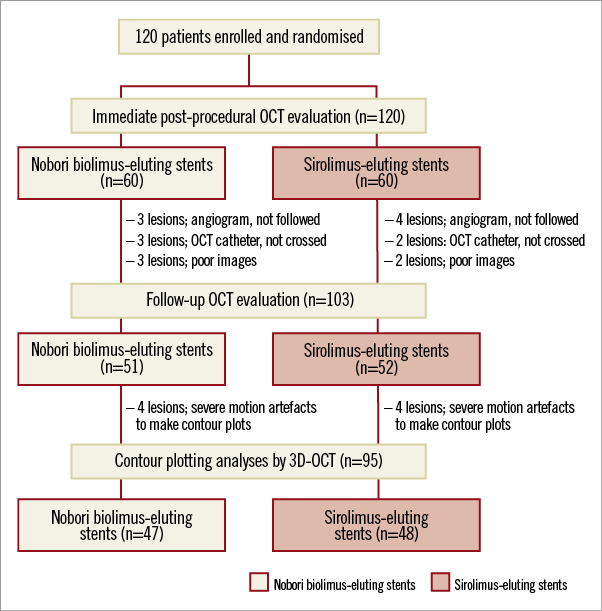
Figure 1. Study at a glance and patient flow chart. OCT: optical coherence tomography
OCT IMAGING AND CROSS-SECTIONAL ANALYSIS
OCT imaging of the target lesion was performed post procedure and at six months using a frequency domain OCT system (C7-XR OCT imaging system; LightLab Imaging, Inc., St. Jude Medical, St. Paul, MN, USA). In this study, OCT cross-sectional images were generated at a rotational speed of 100 frames/s while the fibre was withdrawn at a speed of 20 mm/s within the stationary imaging sheath. All OCT images were analysed at a core laboratory (Cardiovascular Research Center, Seoul, South Korea) by analysts who were blinded to patient and procedural information.
Cross-sectional OCT images were analysed at 0.2 mm longitudinal intervals. Stent and luminal cross-sectional areas (CSAs) were measured; neointimal hyperplasia (NIH) CSA was calculated as the stent minus luminal CSA. Total volumes of stent, lumen, and NIH within stented segments were also calculated. NIH thickness was measured as the distance between the endoluminal surface of the neointima and the strut18. An uncovered strut was defined as having a NIH thickness ≤0 µm18. A malapposed strut was defined as a strut that had detached from the vessel wall by ≥130 μm (N-BES) or ≥160 μm (SES)19,20. The percentage of uncovered or malapposed struts was calculated as the ratio of uncovered or malapposed struts to total struts in all OCT cross-sections. Uncovered stent and stent malapposition were defined as having any uncovered and malapposed struts of all analysable struts, respectively. Stent malapposition was further classified into persistent, resolved, or late acquired by matching post-procedure and follow-up OCT images21. For serial comparison between post-procedure and six-month follow-up, total stent length was measured at post-procedure and six-month follow-up, and the same stent length between post-procedure and six-month follow-up was confirmed in all lesions22. Cross-sectional OCT images at post procedure and six months were meticulously matched using distance from edge of stent and landmarks such as side branches or calcified plaques22. For the evaluation of the magnitude of malapposition, total malapposition volume, mean malapposition CSA, and the maximal extra-stent lumen CSA and the distance between malapposed strut and vessel wall were measured. Intra-stent thrombi were defined as an irregular mass protruding into the lumen by more than 250 μm at the thickest point23. Cross-sections with major side branches (diameter ≥2 mm) were excluded from this analysis.
ASSESSMENT OF STRUT COVERAGE USING AN OCT CONTOUR PLOT
Contour plot analysis was used to assess the vascular responses and the distribution patterns of uncovered struts. A detailed explanation regarding this novel method was provided in a prior study17. Briefly, NIH thickness over the entire stent was measured as a function of circumferential arc length and longitudinal stent length from frames with 0.2 mm longitudinal intervals. Next, each strut was identified as belonging to one of four main categories: covered-apposed, uncovered-apposed, uncovered-malapposed, and side branch struts. A contour plot of strut coverage was then created as shown in representative examples of contour plots in Figure 2. Finally, the patterns of distribution of uncovered struts were classified as: 1) completely covered with no uncovered struts (Figure 3A, Figure 4A); 2) minimally uncovered, with clusters of uncovered struts involving fewer than four consecutive rows or columns of struts (Figure 3B, Figure 4B); 3) focally uncovered, focally scattered distribution of clusters of uncovered struts (Figure 3C, Figure 4C); and 4) diffusely uncovered, diffusely scattered uncovered struts throughout the whole stent without focal grouping (Figure 3D, Figure 4D).
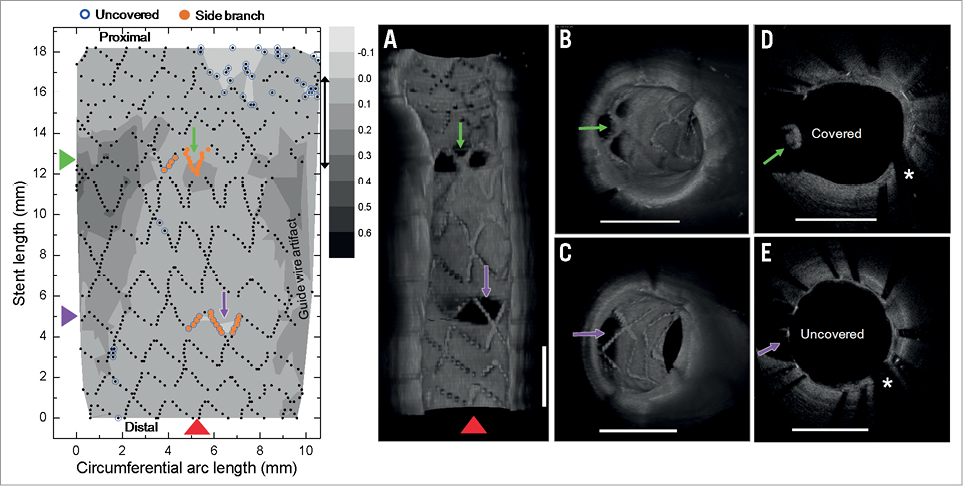
Figure 2. Contour plot images. Contour plot of strut coverage created from optical coherence tomography (OCT)-generated images. On the contour map blue circles indicate uncovered struts, and orange circles indicate struts crossing over side branches. A) Longitudinal cutaway view of a stent by three-dimensional OCT reconstruction at the level of the red arrowhead on the contour plot. B) Cross-sectional volume-rendered OCT image with covered struts (green arrow on contour map) at the side branch. C) Cross-sectional volume-rendered OCT image with uncovered struts (purple arrow on the contour map). D) Cross-section with covered struts (green arrow on the contour map). E) Cross-section with uncovered struts (purple arrow on the contour map). *Guidewire artefact.
STUDY ENDPOINTS AND FOLLOW-UP
Angiographic and OCT follow-up was performed at six months. The primary endpoint was the percentage of uncovered struts at six-month follow-up OCT. The secondary endpoint was the distribution patterns of uncovered struts from the OCT contour plotting analysis.
Clinical follow-up was performed at one, three, and six months after the index procedure. The occurrence of major adverse cardiac events - defined as a composite of cardiac death, myocardial infarction, or target vessel revascularisation - was monitored. Details of statistical analysis are provided in the Online data supplement.
Results
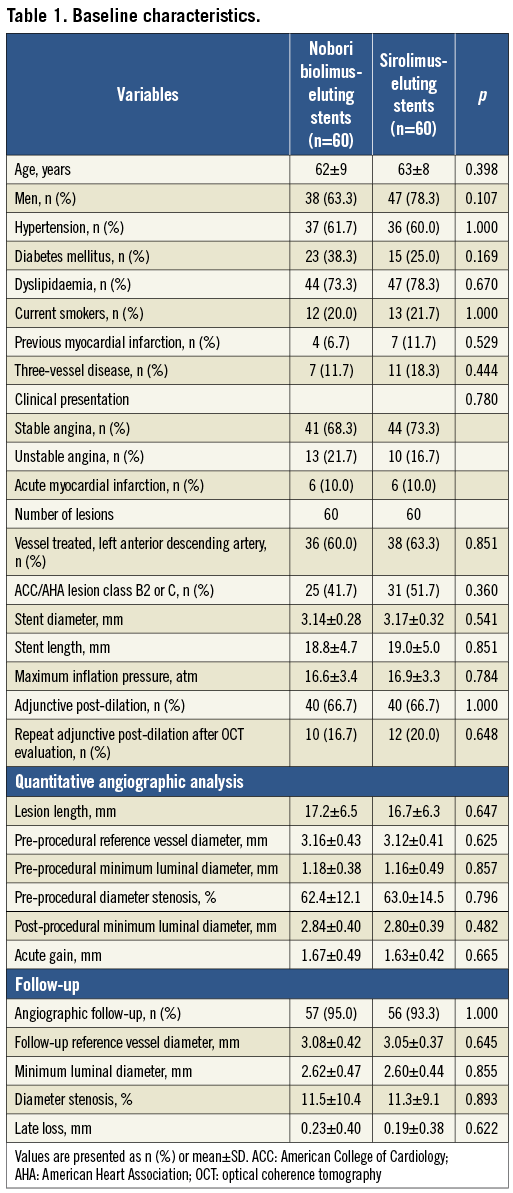
The study flow diagram of enrolled patients is shown in Figure 1. Baseline clinical and angiographic characteristics are listed in Table 1. Both DES groups were well matched without a significant difference in baseline characteristics. Both post-intervention and six-month follow-up OCT data were available in 51 (85.0%) patients in the N-BES group, and 52 (86.7%) patients in the SES group. Follow-up angiography was not performed in seven patients, the OCT catheter could not be advanced through the lesion due to severe angulations in five patients, and there was poor image quality in five patients (Figure 1).
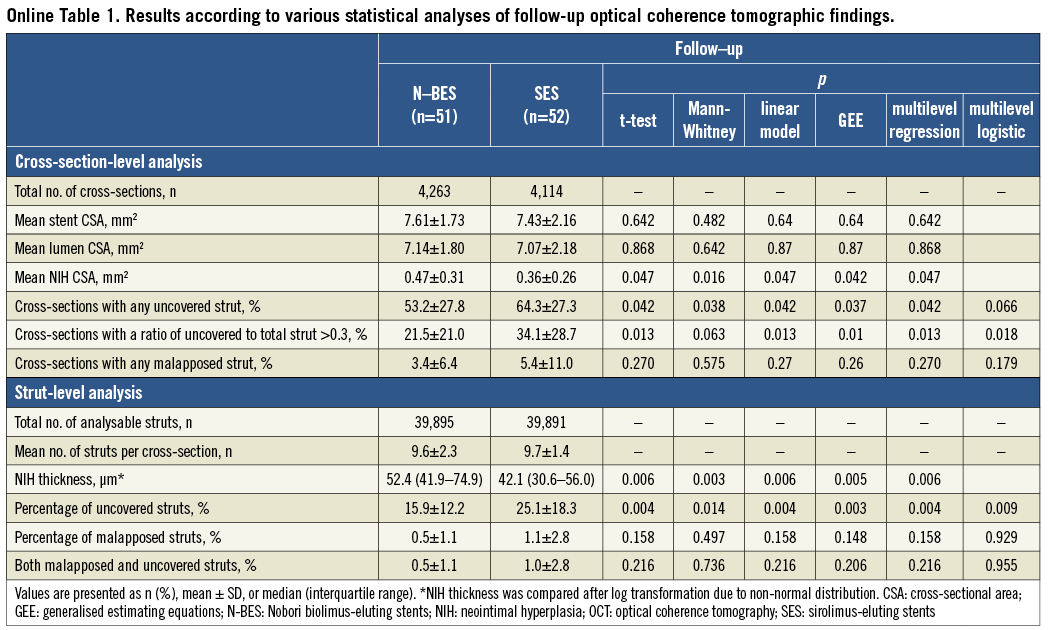
Post-procedural and follow-up OCT findings and analyses are summarised in Table 2. The percentage of uncovered struts was significantly lower in N-BES-treated lesions than SES-treated lesions (15.9±12.2% versus 25.1±18.3%, respectively, p=0.003). There was a tendency towards a lower percentage of malapposed struts in N-BES (0.5±1.1% versus 1.1±2.8%, p=0.148). N-BES had a greater NIH thickness than SES (median values: 52.4 μm versus 42.1 μm, p=0.005) (Table 2). Results of follow-up OCT analysis, including the primary endpoint according to various statistical methods, were provided with the supplementary data and the results being similar among various statistical methods (Online Table 1).
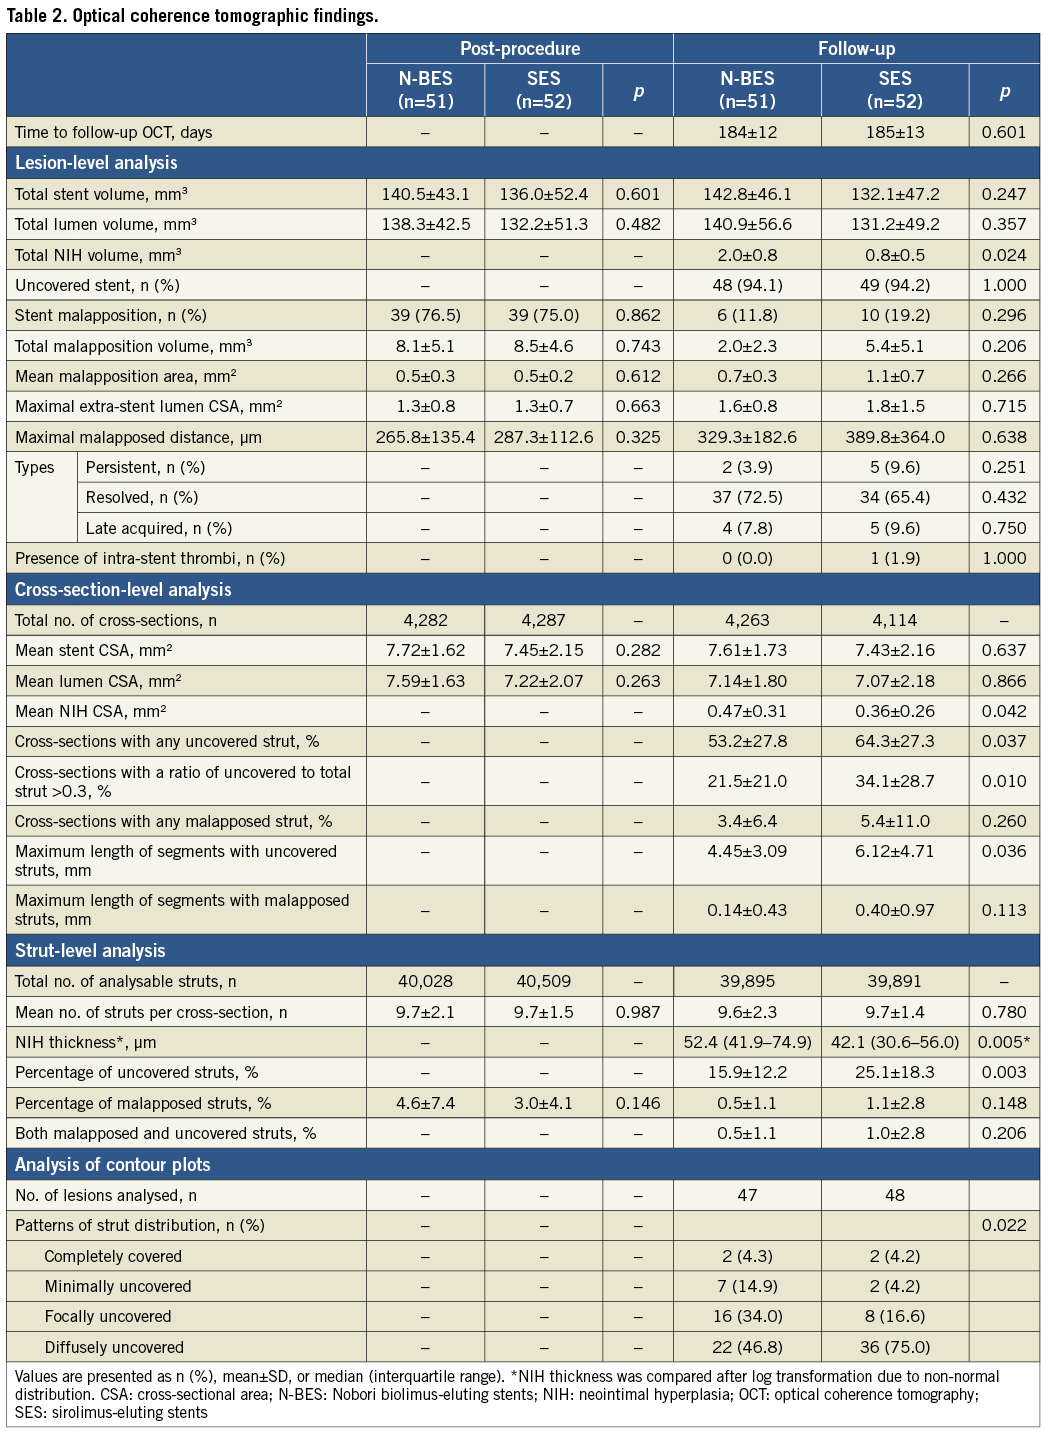
OCT contour plot data were available in 47 (78.3%) patients in the N-BES group and 48 (80.0%) patients in the SES group. Reconstruction of contour plot images was not possible in eight patients due to severe motion artefact of OCT images (Figure 1). N-BES showed a greater incidence of minimally uncovered or focally uncovered struts and a smaller incidence of diffusely uncovered struts than SES (p=0.022) (Table 2, Figure 3, Figure 4). The agreement of the decision of strut distribution patterns was excellent (weighted kappa 0.81 for inter-observer and 0.87 for intra-observer agreements).
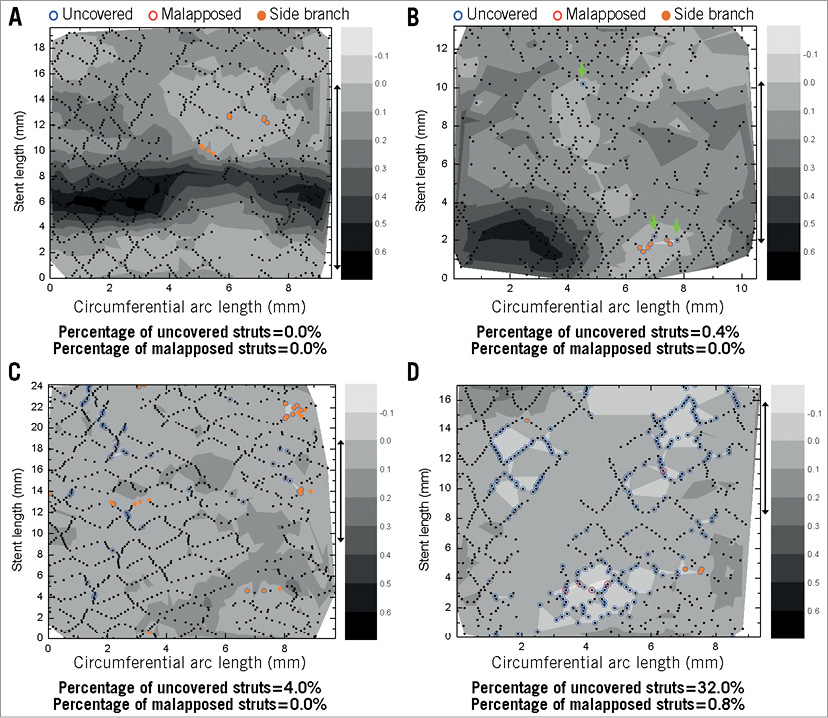
Figure 3. Contour plots of Nobori biolimus-eluting stents. A) Completely covered distribution. B) Minimal distribution of uncovered struts with green arrows indicating separate uncovered struts. C) Focal distribution of uncovered struts. D) Diffuse distribution of uncovered struts. Blue and red circles indicate uncovered and malapposed struts, respectively. Orange colour filled circles indicate struts at the side branch.
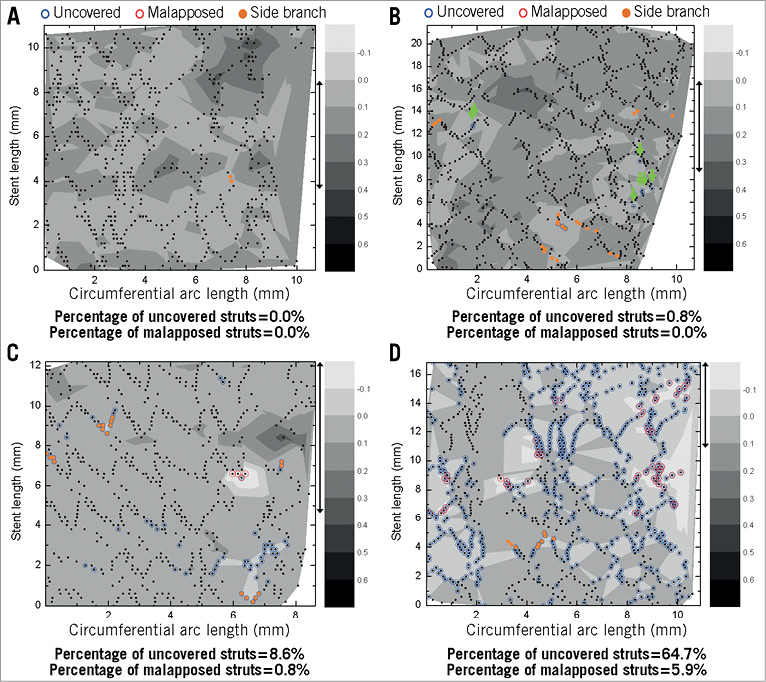
Figure 4. Contour plots of sirolimus-eluting stents. A) Completely covered distribution. B) Minimal distribution of uncovered struts with green arrows indicating separate uncovered struts. C) Focal distribution of uncovered struts. D) Diffuse distribution of uncovered struts. Blue and red circles indicate uncovered and malapposed struts, respectively. Orange colour filled circles indicate struts at the side branch.
During six months of follow-up, there were no major adverse cardiac events in either group.
Discussion
In this randomised OCT study, N-BES showed a significantly lower percentage of uncovered struts and a less common diffuse distribution pattern of uncovered struts than SES.
An OCT substudy of the LEADERS trial, analysing 20 Biomatrix BES-treated patients and 26 SES-treated patients, showed that Biomatrix BES had a more favourable strut coverage at nine months compared with SES (principal analyses: percentage of uncovered struts, weighted estimate 0.6% for Biomatrix BES versus 2.1% for SES, p=0.04; lesions with any uncovered struts, 63.3% versus 74.9%, respectively, p=0.48)5. In addition, Gutiérrez-Chico et al reported serial 24-month OCT findings (11 lesions in Biomatrix BES and 11 lesions in SES) in some of these patients24. In this study, more complete strut coverage of Biomatrix BES at nine months was followed by improvement of coverage in SES between nine and 24 months and a similar long-term coverage in both stent types at 24 months24. A recent six-month follow-up OCT study comparing N-BES (16 patients with 28 lesions) versus paclitaxel-eluting stents (16 patients with 23 lesions) reported that the percentage of uncovered struts was significantly greater in N-BES than in paclitaxel-eluting stents (21.8% versus 10.9%; respectively, p=0.006)20. However, these were non-randomised, retrospective studies and included a limited number of study patients without immediate post-procedural OCT analysis5,20. Therefore, we conducted a randomised trial comparing the percentage of uncovered struts at six months between N-BES and SES with a sufficient number of lesions by statistical power and sample size calculation, a stratified randomisation that considered stent size and length, only one lesion per patient, and a different follow-up duration from the LEADERS study.
Papayannis et al recently reported a systematic review of OCT studies of stent strut coverage among different DES designs25. Six-month strut-level analysis showed that the overall frequency of uncovered struts was 10.86% for SES, 5.49% for paclitaxel-eluting stents, and 0.02% for zotarolimus-eluting stents, respectively (p<0.001 for all paired comparisons)25. Compared to this previous study25, the percentage of uncovered struts in the current study appears to be higher (15.9±12.2% for N-BES and 25.1±18.3% for SES). These differences may have resulted from different study designs (randomised vs. non-randomised), presence of post-intervention OCT, different study population and number of enrolled patients, different stent lengths and diameters, different follow-up duration, and different core laboratories.
The percentage of uncovered or malapposed struts measured by cross-sectional two-dimensional imaging analyses was compared among different DESs to evaluate procedural safety and vessel wall healing after DES implantation25. Conventional OCT evaluation of strut coverage is limited to the analysis of two-dimensional cross-sectional images and includes the assessment of the amount of NIH growth, the detection of uncovered or malapposed struts by the measurement of NIH thickness, and qualitative OCT assessment14. However, this approach does not provide detailed information on stent pathology, overall neointimal coverage throughout the entire stent, serial changes in OCT findings, and their association among uncovered or malapposed struts, thrombi, and NIH. To overcome the limitations of conventional two-dimensional OCT analysis, new analytical methods with higher resolving capabilities are required. Similar concepts have been attempted in previous OCT studies26,27. However, because some limitations existed in prior studies, we developed a more advanced OCT analysis than other studies, “contour plotting” for the assessment of the spatial distribution of uncovered and malapposed stent struts and NIH growth within stents, and used this system and resultant analysis in this current study17,26,27. This new assessment method can evaluate neointimal coverage over an entire stent at a glance. Data thus generated are nearly comparable to the quality obtained by gross histopathologic examination.
Limitations
This study has some limitations. First, we excluded complex lesions as well as high-risk patients, such as those with renal or heart failure; therefore, broad interpretation of these results requires careful attention. Second, although the percentage of uncovered struts on OCT, the primary endpoint of this study, is regarded as one of the potential risk factors for stent thrombosis, the lack of clinical relevance might still exist. Third, although the contour plotting analysis provided new insights into the understanding of the distribution and the degree of uncovered struts and the interrelationship among the major OCT parameters, at the present time we do not have clinical correlations with these patterns of strut coverage. Fourth, because we did not perform pre-intervention OCT evaluation in this study, the relationship between the underlying plaque morphology and the coverage of stent struts could not be investigated. Fifth, the analysis of cross-sections with major side branches (diameter ≥2 mm) was excluded in this study. Finally, statistical analysis for the cross-section or strut levels has not yet been fully agreed on. Another statistical method, such as Bayesian hierarchical modelling, could be applied even after using various statistical methods such as generalised estimating equations and multilevel regressions.
Conclusion
Compared to SES, N-BES showed a more favourable pattern of uncovered strut distribution in six months of follow-up OCT evaluation.
Acknowledgements
This study was supported by a grant from the Korea Healthcare Technology R&D Project, Ministry for Health, Welfare & Family Affairs, Republic of Korea (No. A085012 and A102064), a grant from the Korea Health 21 R&D Project, Ministry of Health & Welfare, Republic of Korea (No.A085136), and the Cardiovascular Research Center, Seoul, South Korea.
| Impact on daily practice The presence of permanent polymers in first-generation DES has been implicated in being responsible for a hypersensitivity reaction that might cause incomplete re-endothelialisation and contribute to late stent thrombosis. To overcome these issues, new-generation DES utilising biodegradable polymers have recently been introduced and reported to show superior clinical outcomes. However, there have been no randomised trials comparing strut coverage between N-BES and SES using OCT. In this randomised OCT study, N-BES showed a significantly lower percentage of uncovered struts and a less common diffuse distribution pattern of uncovered struts than SES. These findings could support the superior clinical outcomes of the new-generation DES with biodegradable polymers. |
Conflict of interest statement
The authors have no conflicts of interest to declare.
Appendix. Methods
STUDY POPULATION
All study participants fulfilling the enrolment criteria were randomly assigned in a 1:1 ratio to receive N-BES or SES by an interactive web-based response system. To guarantee balance between the two DES types and correct the clustering effects according to the different size or length of stents, stratified randomisation was performed according to the estimated length and diameter of DES implanted. In addition, to avoid correlated cases and replications, patients with only one target lesion were selected for the study.
STATISTICAL ANALYSIS
This was a randomised study to prove the superiority of N-BES over SES in stent strut coverage at six months. We hypothesised that the difference of percentages of uncovered struts between N-BES and SES could be more than 8-10%, considering prior OCT data and specific characteristics of our study different from prior studies (inclusion of patients with acute coronary syndrome and shorter follow-up duration [six months])5,28,29. Based on our hypothesis and a 10% drop-out rate, a sample size of 120 patients would provide 90% statistical power with an alpha error (probability value) of 0.05.
Categorical data were presented as numbers (%) and compared with chi-square statistics or Fisher’s exact test. Continuous data were presented as mean±1 SD or median (interquartile range) and compared with the Student’s t-test or the Mann-Whitney U test. To avoid problems of sample size inflation and correlated data, patients with only one target lesion were included in the study. Cross-section or strut-level analysis may not be straightforward because struts congregate within each lesion in each individual. For this analysis, therefore, we modelled generalised estimating equations with the exchangeable correlation structure of each lesion and individual30. In addition, we performed multilevel regression model and/or multilevel logistic analysis. Statistical analysis was performed with the Statistical Analysis System software (SAS 9.1.3; SAS Institute, Cary, NC, USA). A value of p<0.05 denoted statistical significance. To evaluate inter/intra-observer variability for the classification of the patterns for contour plots, the weighted kappa was calculated31. For inter-observer agreement, two observers blinded to the clinical and procedural characteristics analysed 10 randomly selected contour plots. One of the observers repeated the analysis one week later to determine intra-observer variability.
DISCUSSION
OCT, a new imaging modality, provides more detailed information than intravascular ultrasound due to its superior resolution. In particular, OCT has enabled accurate evaluation of stent strut coverage, which was known to be strongly associated with stent thrombosis on histopathologic study32. A recent in vivo case-controlled study reported that the presence of uncovered stent struts as assessed by OCT was associated with late stent thrombosis after DES implantation33 and supported prior human autopsy studies identifying delayed healing, lack of endothelial cell coverage, and vascular toxicity as the hallmarks of late DES thrombosis32. The percentage of uncovered strut coverage assessed by OCT was different among various DES types25.
The newly developed N-BES has several unique features that are different from first-generation DES. A bioresorbable polymer carrier (poly-lactic acid), expected to prevent late vascular complications by complete dissolution of polymer, as well as coating only on the abluminal stent surface to allow a direct release of lipophilic biolimus-A9 into the vessel wall are the most important ones6-8. The randomised LEADERS (Limus Eluted from A Durable versus ERodable Stent coating) trial, comparing the clinical outcomes between Biomatrix BES and SES, showed that Biomatrix BES, a DES with similar features to those of N-BES, was non-inferior to SES in nine-month clinical and angiographic outcomes4. Recently, four-year outcomes of the LEADERS trial were reported: Biomatrix BES were non-inferior and could improve long-term clinical outcomes for up to four years, as compared to SES34. Particularly, the risk of very late stent thrombosis was significantly lower in the Biomatrix BES-treated patients than in the SES-treated patients (rate ratios=0.20, 95% confidence interval, 0.06-0.67, p=0.004)34.
A tendency towards a lower percentage of malapposed struts in N-BES (0.5±1.1% for N-BES versus 1.1±2.8% for SES, p=0.148) was observed in the current study. The findings in our study were similar to those in the OCT substudy of the LEADERS trial (principal analyses: percentage of malapposed struts, weighted estimate 0.2% for Biomatrix BES versus 0.4% for SES, p=0.19)4.