Abstract
Aims: Detailed long-term changes of the neointima in sirolimus-eluting stents (SES) and paclitaxel-eluting stents (PES) are still unclear.
Methods and results: We consecutively enrolled 14 patients (18 SES) and 12 patients (13 PES) who underwent optical coherence tomography (OCT) serially at eight months and 18 months after stent implantation. For 18 SES and 13 PES, OCT was used to visualise 2,486 and 1,361 stent struts at the eight-month and 2,199 and 1,309 stent struts at the 18-month follow-up, respectively. The OCT parameters, including incidence of uncovered and malapposed struts (uncovered and malapposed percentage), average neointimal hyperplasia thickness (NIH thickness) and %NIH volume obstruction, which was defined as ([mean NIH area*stent length]/[mean stent area*stent length])×100, and qualitative analysis of the neointima were compared between SES and PES and also compared between the eight- and 18-month follow-up for SES and PES, respectively. The uncovered and malapposed percentage was significantly higher in SES than PES at the eight- and 18-month follow-up, and the NIH thickness and %NIH volume obstruction were lower in SES than PES at both follow-ups. The uncovered and malapposed percentage decreased in both SES and PES between the eight- and 18-month follow-up. Percent NIH volume obstruction and NIH thickness in SES significantly increased from the eight- to 18-month follow-up; however, those parameters significantly decreased in PES. The incidence of high signal with peri-strut low-intensity areas increased in SES but decreased in PES from the eight- to 18-month follow-up.
Conclusions: Uncovered and malapposed struts were reduced in both SES and PES, while the neointimal hyperplasia and qualitative changes showed different patterns.
Introduction
The development of drug-eluting stents (DES) was a revolutionary advance in percutaneous coronary intervention (PCI) leading to a significant reduction of neointimal hyperplasia and late luminal loss compared to bare metal stents (BMS). This translated into a significant reduction in the need for repeat PCI compared to BMS in clinical trials1-3. However, poor endothelialisation with these stents might increase late stent thrombosis. Therefore, the clinical assessment of neointimal coverage over stent struts has emerged as a potential avenue for assessing the risk of DES thrombosis4. Moreover, concerns have recently been raised regarding the late catch-up phenomenon in DES5. However, details about the long-term serial changes in neointimal coverage of sirolimus-eluting stents (SES) and paclitaxel-eluting stents (PES) are still unclear.
Optical coherence tomography (OCT) is a new intravascular imaging modality with a high axial resolution of approximately 10 to 20 μm, which is tenfold higher than that of intravascular ultrasound (IVUS). Thus, OCT can obtain better imaging than IVUS to evaluate vascular healing after stent implantation. In the present study, we used OCT to investigate the differences in serial changes in the neointimal condition including coverage, apposition and qualitative assessment of SES and PES implantation.
Methods
PATIENT POPULATION
We retrospectively enrolled 14 consecutive patients with 18 SES (CYPHER®; Cordis, Johnson & Johnson, Warren, NJ, USA) and 12 patients with 13 PES (TAXUS® Express2™ and TAXUS® Liberté®; both Boston Scientific, Natick, MA, USA) who underwent intracoronary OCT and angiographic follow-up examinations serially both at eight months (252±19 days) and 18 months (570±37 days) after implantation. All stents were implanted for the treatment of de novo lesions from June 2008 to March 2009. The patient exclusion criteria were: 1) lesions in left main coronary artery and ostial lesions; 2) a stenotic lesion of a coronary bypass graft; 3) heavily tortuous lesions; 4) in-stent restenosis (≥50% luminal diameter stenosis); 5) apparent congestive heart failure or low ejection fraction (≤35%); and 6) renal insufficiency with a baseline creatinine ≥2.0 mg/dl.
The ethics committee of the Osaka Rosai Hospital approved this study, and we obtained written informed consent from all patients before catheterisation. All patients received 100 mg aspirin and 200 mg ticlopidine or 75 mg clopidogrel daily during the follow-up period.
QUANTITATIVE CORONARY ANGIOGRAPHY (QCA)
After administration of intracoronary nitroglycerine, angiography at stent implantation, at eight-month follow-up and at 18-month follow-up was performed in at least two projections for the right coronary artery and at least four projections for the left coronary artery. The view showing the most severe stenosis was selected, and the reference diameter, minimal lumen diameter (MLD) and percent diameter stenosis were measured by quantitative coronary angiography (QCA) (QAngio XA, version 7.1; Medis medical imaging systems, Leiden, The Netherlands). The QCA analyses were performed immediately after stent implantation, and on angiography at eight-month and at 18-month follow-up. Late loss was defined as the difference between the post-procedural MLD and the follow-up MLD.
OCT PROCEDURES
The OCT system used in this study consisted of a computer, a monitor display, an interface unit (Model M2 Cardiology Imaging System; LightLab Imaging, Inc., Westford, MA, USA) and a 0.014-inch wire-type imaging catheter (Image Wire; LightLab Imaging, Inc.). The patients received heparin (5,000 IU) intravenously before the OCT procedure. A 6 Fr guiding catheter was engaged into the coronary artery using a transradial approach. To remove blood, an occlusion catheter (Helios; LightLab Imaging, Inc.) was used. During image acquisition, the occlusion balloon was inflated to 0.4-0.6 atm, and Ringer’s lactate was continuously infused at 0.3-0.5 ml/sec. The imaging catheter was pulled back from distal to proximal with a motorised system at 1.5 mm/s, and continuous images throughout the entire stent segment were digitally stored for subsequent analysis.
OCT ANALYSIS
Two independent observers blinded to patient and stent information analysed the OCT images. Cross-sectional images were obtained at 1 mm intervals. Bifurcations with major side branches, which were defined as side branches >2 mm, and overlapping segments were excluded. Neointimal hyperplasia (NIH) thickness was defined as the distance between the endoluminal surface of the strut reflection and the lumen contour. Struts were classified as uncovered if any part of the strut was visibly exposed to the lumen, or covered if a layer of tissue was visible over all of the reflecting surfaces6. A malapposed strut was defined as a strut for which the distance between the stent strut surface and adjacent vessel surface was >160 μm for SES, >150 μm for PES (Express) and >130 μm for PES (Liberté), the difference due to the respective thicknesses of the strut and polymer layers in the two stents. The uncovered percentage in each cross-section was calculated as follows:
Uncovered percentage=(number of uncovered struts/number of total struts)×100.
The malapposed percentage in each cross-section was calculated as follows:
Malapposed percentage=(number of malapposed struts/number of total struts)×100.
The stent and lumen areas were measured by manual trace, and the percentage of the NIH area (%NIH area obstruction) in each cross-section was calculated as follows:
%NIH area obstruction=([stent area–lumen area]/stent area)×100.
The percentage of the NIH volume (%NIH volume obstruction) in each stent was calculated as follows:
%NIH volume obstruction=([mean NIH area*stent length]/[mean stent area*stent length])×100.
An uncovered proportion >0.3 for cross-sections was chosen as a cut-off point with reference to Finn’s report7.
In addition, the qualitative analysis of the neointima was also evaluated by OCT. Qualitative changes of the neointima were classified into three groups: high intensity neointima without peri-strut low-intensity area (HI), high intensity neointima with peri-strut low-intensity area (PLI), and low intensity neointima (LI) (Figure 1). The peri-strut low-intensity area was defined as a region around stent struts with a homogeneous and lower intensity appearance than the surrounding tissue on OCT images without significant signal attenuation behind the area8.
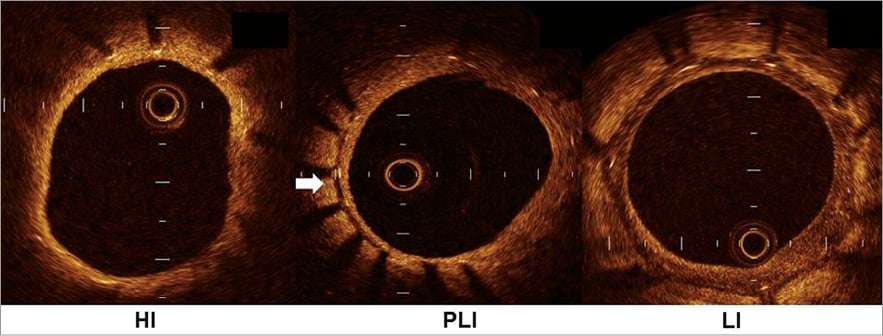
Figure 1. Three types of neointimal qualitative change. The neointimal qualitative changes are classified into the following three types according to the optical coherence tomographic findings: HI (high intensity neointima without peri-strut low-intensity area), PLI (high intensity neointima with peri-strut low-intensity area), and LI (low intensity neointima).The peri-strut low-intensity area is indicated by a white arrow. See the text for detail.
STATISTICAL ANALYSIS
Results are reported as mean±standard deviation for continuous variables and as count (%) for nominal variables. Continuous variables with a normal distribution were compared with the Student’s t-test for independent samples or with the Mann-Whitney U test if a normal distribution could not be assumed. Nominal variables were compared with Fisher’s exact test. In the OCT analysis, dichotomous variables were analysed using multilevel logistic regression models with random effects at three different levels: (i) patient, (ii) lesion and (iii) stent. The result was expressed with the odds ratio and its 95% confidence interval. Likewise, for continuous variables, they were log-transformed before the analysis and were then analysed using multilevel linear regression models with random effects at the same three levels. The result was expressed with the mean ratio and its 95% confidence interval.
All statistical analyses were performed according to the intention-to-treat principle using SAS for Windows 9.1.3 (SAS Institute, Cary, NC, USA). All tests were two-sided and a p-value of 0.05 was considered statistically significant.
Inter-observer reproducibility of stent area, lumen area and NIH thickness was assessed by Lin’s concordance correlation coefficient9. Inter-observer reproducibility of qualitative analysis of the neointima was assessed by the kappa concordance correlation coefficient.
Results
PATIENT AND LESION CHARACTERISTICS
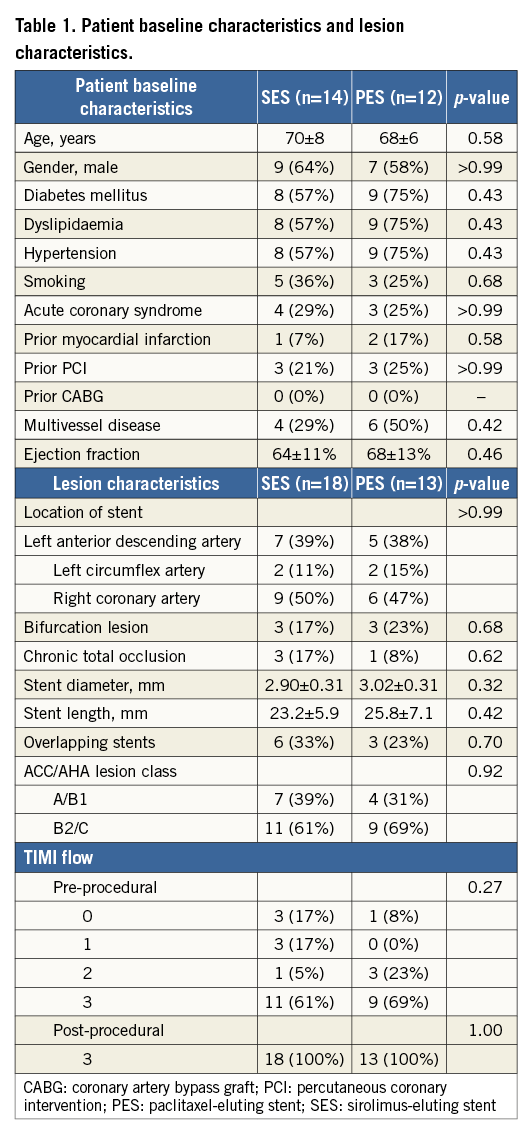
The patients’ baseline characteristics and lesion characteristics are shown in Table 1. There were no significant differences between the two groups. In this study, all patients with acute coronary syndrome had unstable angina.
QCA ANALYSIS
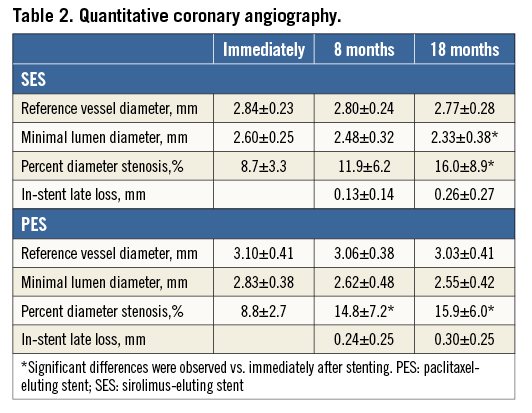
The QCA data are shown in Table 2. There were no significant differences in MLD, percent diameter stenosis or late loss between the SES and PES groups immediately after stent implantation, or at eight-month and 18-month follow-up. In SES, the percent diameter stenosis measurements immediately after stenting and at eight-month follow-up were similar, but measurements at 18-month follow-up were significantly higher than those immediately after stenting. However, in PES, the percent diameter stenosis measurements at eight- and 18-month follow-up were both significantly higher than immediately after stenting.
OCT FINDINGS
Clear OCT images of all 18 SES and 13 PES were obtained without any complications at both eight and 18 months. We analysed a total of 299 cross-sections for SES and 184 cross-sections for PES at eight- and 18-month follow-up. A small fraction, 0.52%, of the cross-sections was deemed of insufficient quality for the quantitative analysis. As a result, in SES, 2,486 and 2,199 stent struts were analysed at eight- and 18-month follow-up but, in PES, 1,361 and 1,309 stent struts were analysed at eight- and 18-month follow-up, respectively.
REPRESENTATIVE OPTICAL COHERENCE TOMOGRAPHIC IMAGES OF SES AND PES
Figure 2 shows representative optical coherence tomographic images of SES (3.0×28 mm) and PES (3.0×28 mm). The SES showed thinner neointimal coverage than the PES at both eight- and 18-month follow-up. In addition, the SES showed increased neointimal coverage but the PES showed decreased coverage between the eight- and 18-month follow-up.
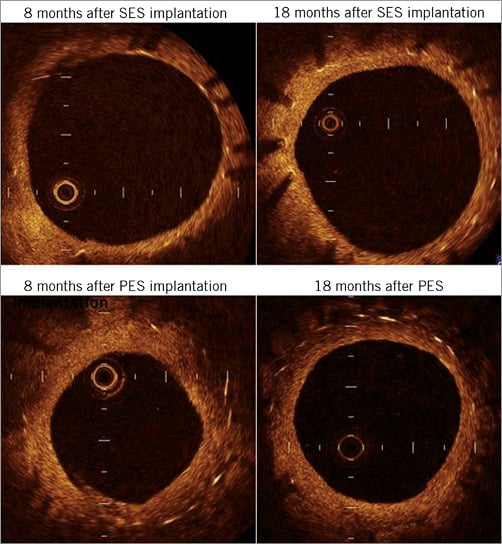
Figure 2. Optical coherence tomographic images of SES and PES. Upper panels show the representative optical coherence tomographic images of SES (3.0×28 mm) and lower panels show the representative optical coherence tomographic images of PES (3.0×28 mm). SES has thinner neointimal coverage than PES at both intervals. In addition, SES shows increased neointimal coverage but PES shows decreased coverage. PES: paclitaxel-eluting stent; SES: sirolimus-eluting stent
SES VS. PES AT EACH FOLLOW-UP
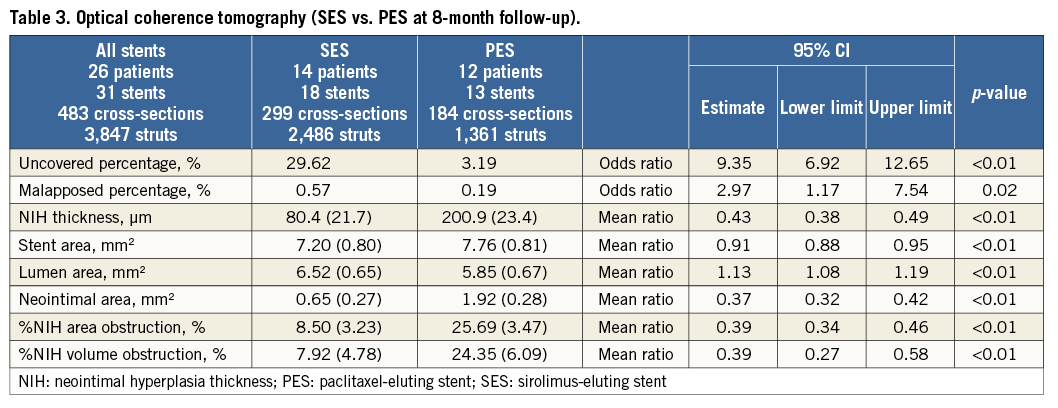
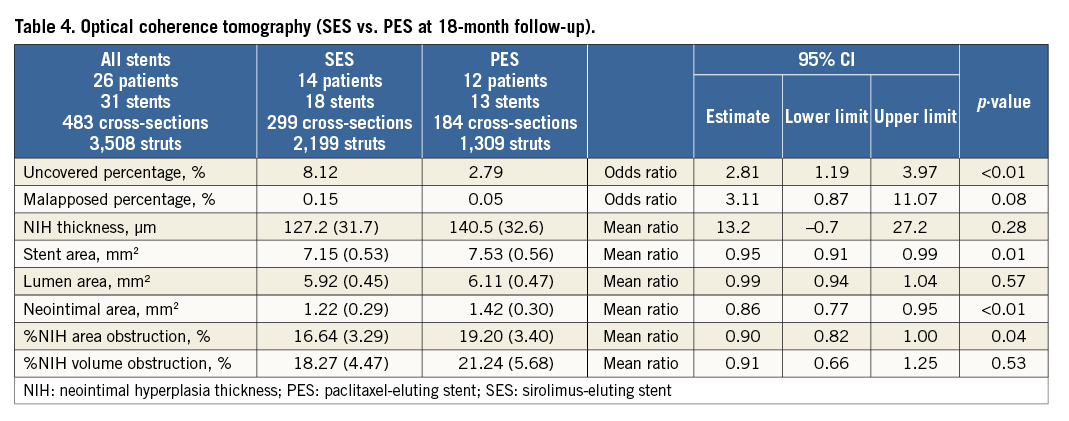
The OCT data are summarised in Table 3 (eight-month follow-up) and Table 4 (18-month follow-up). At the eight-month follow-up, the lumen area, NIH thickness, %NIH volume obstruction and malapposed percentage were significantly higher in SES than in PES; however, at the 18-month follow-up, there were no significant differences in lumen area, NIH thickness, %NIH volume obstruction and malapposed percentage between the SES and PES groups. The uncovered percentage in SES was significantly higher than in PES at both eight- and 18-month follow-up. Other parameters, including total stent area, neointimal area, %NIH area obstruction and cross-sections with uncovered proportion >0.3, were significantly lower in SES than in PES at both eight- and 18-month follow-up.
In terms of the qualitative analysis of the neointima using OCT, at the eight-month follow-up a higher incidence of HI and lower incidence of PLI in SES than in PES were found, but there were no significant differences between the two groups at the 18-month follow-up. HI and PLI neointima accounted for more than 90% of the neointima in both groups (90.9% for SES vs. 91.5% for PES at eight-month follow-up and 94.4% for SES vs. 96.1% for PES at 18-month follow-up). LI neointima accounted for less than 10%.
SERIAL CHANGES IN CONDITION OF SES AND PES
Patterns of serial changes in coverage and apposition of SES and PES are shown in Figure 3. The uncovered percentage significantly decreased in SES from the eight-month to the 18-month follow-up (29.62% at the eight-month follow-up vs. 8.12% at the 18-month follow-up), but in PES it did not significantly decrease (3.19% at the eight-month follow-up vs. 2.79% at the 18-month follow-up). At the 18-month follow-up, four stents in 18 SES and four stents in 13 PES showed full coverage of the stents (no uncovered struts), while five stents (28%) in SES and one stent in PES (7.7%) had cross-sections with an uncovered proportion >0.3. The malapposed percentage decreased slightly from the eight- to 18-month follow-up in both groups, but the changes did not reach statistical significance (0.57% at eight-month follow-up vs. 0.15% at 18-month follow-up for SES and 0.19% at eight-month follow-up vs. 0.05% at 18-month follow-up for PES). Very late acquired malapposition was found in two patients in SES, but none was found in PES (Figure 4, Figure 5). Very late acquired malapposition was defined as malapposition at the 18-month follow-up that was not observed at eight-month follow-up. One of these two patients developed a very late stent thrombosis at 27 months after SES implantation (Figure 5, Figure 6). We studied the pattern of malapposed and uncovered stent struts within the stent. Stents were classified into distal ends, stent body and proximal ends. Distal ends and proximal ends were defined as the cross-section within 5 mm from the stent edges. Uncovered struts decreased at all segments in both SES and PES (Figure 7). All cases of very late acquired stent malapposition were at the stent body in SES. Malapposed struts were only at the stent body in PES (Figure 8). Percent neointima area obstruction, percent neointimal volume obstruction and NIH thickness in SES significantly increased from the eight-month to the 18-month follow-up (8.5%, 7.9% and 80.4 μm at eight-month follow-up vs. 16.6%, 18.3% and 127.2 μm at 18-month follow-up). In contrast, percent neointimal volume obstruction and NIH thickness in PES significantly decreased from the eight- to the 18-month follow-up (25.7%, 24.4% and 200.9 μm at the eight-month follow-up vs. 19.2%, 21.2% and 140.5 μm at the 18-month follow-up).
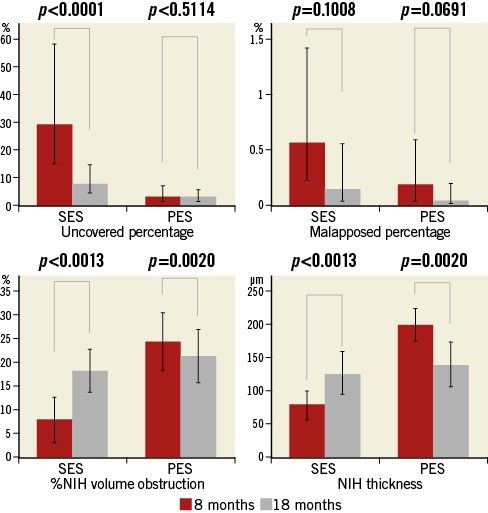
Figure 3. Optical coherence tomographic findings of serial changes of SES and PES. PES: paclitaxel-eluting stent; SES: sirolimus-eluting stent
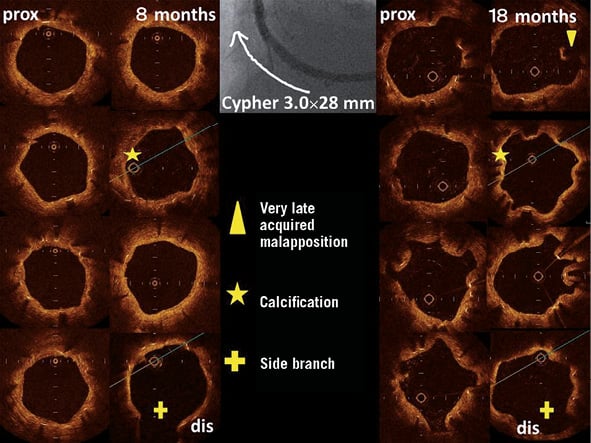
Figure 4. Optical coherence tomographic findings at 8 and 18 months of follow-up. Very late acquired malapposition was observed. In a patient with a chronic total occlusion lesion, a sirolimus-eluting stent (SES) (3.0×28 mm) was implanted in the right coronary artery.
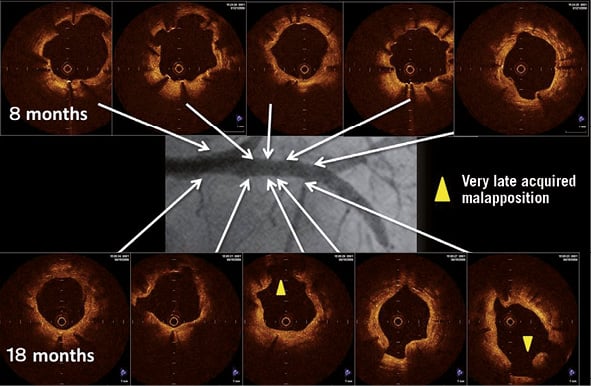
Figure 5. Optical coherence tomographic findings at 8 months and 18 months of follow-up. Very late acquired malapposition was observed. In a patient with stable angina, a sirolimus-eluting stent (SES) (3.0×33 mm) was implanted in the proximal left anterior descending artery.
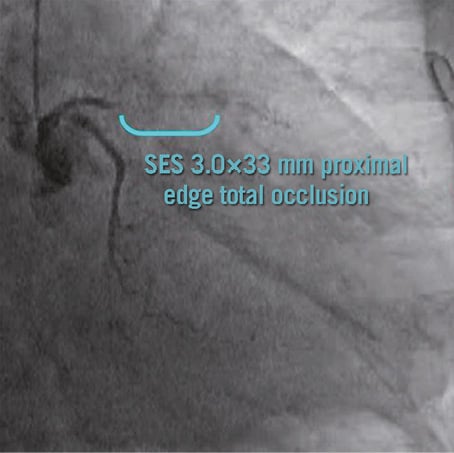
Figure 6. The patient shown in Figure5 developed a very late stent thrombosis at 27 months after SES implantation.
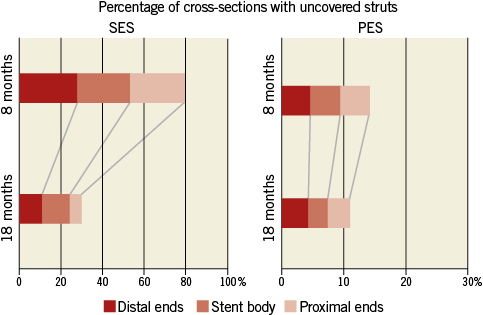
Figure 7. The pattern of uncovered stent struts within the stent. PES: paclitaxel-eluting stent; SES: sirolimus-eluting stent
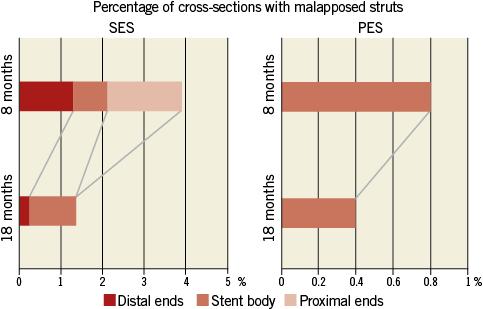
Figure 8. The pattern of malapposed stent struts within the stent. PES: paclitaxel-eluting stent; SES: sirolimus-eluting stent
The incidence of HI neointima slightly decreased in SES, but increased in PES. In contrast, the incidence of PLI increased non-significantly in SES but decreased in PES. LI neointima decreased in both SES and PES (Figure 9).
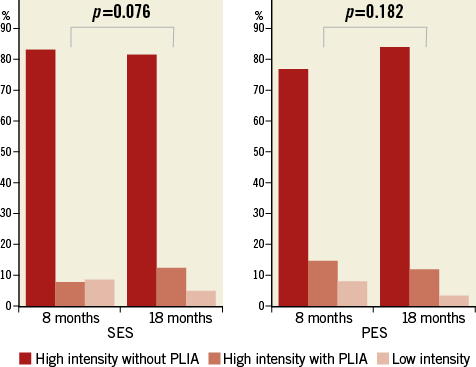
Figure 9. Optical coherence tomographic findings of serial qualitative changes in neointima. SES versus PES. PLIA indicates peri-strut low-intensity area. PES: paclitaxel-eluting stent; SES: sirolimus-eluting stent
INTER-OBSERVER REPRODUCIBILITY
Lin’s concordance correlations for the evaluation of inter-observer reproducibility were 0.998, 0.994 and 0.997 for the stent area, lumen area and NIH thickness, respectively. When the opinions of two observers did not agree in the assessment of strut apposition and coverage, this was discussed and a final determination was made. Regarding reproducibility of the qualitative assessment of the neointima, the kappa concordance correlations were 0.918 and 0.933 in PES at eight and 18 months, respectively, and 0.912 and 0.919 in SES at eight and 18 months, respectively. The kappa concordance correlation was 0.968 for the qualitative assessment of all cross-sections. These data suggest almost perfect agreement between the two observers.
Discussion
In the present study, we used the uncovered percentage and malapposed percentage as indicators of neointimal coverage and apposition and %NIH and NIH thickness as indicators of neointimal hyperplasia. This study demonstrated that the uncovered percentage and malapposed percentage were significantly higher in SES than in PES at both eight- and 18-month follow-up and that these parameters decreased from the eight-month to the 18-month follow-up. The study also suggests that the NIH thickness and %NIH volume obstruction were significantly lower in SES than in PES at eight-month follow-up, and they showed different patterns of change from eight- to 18-month follow-up, significantly increasing in SES but significantly decreasing in PES. Neointimal qualitative changes also showed different patterns from eight- to 18-month follow-up; there was a decreased incidence of HI neointima and an increased incidence of PLI neointima in SES, whereas the opposite trend was found in PES.
NEOINTIMAL COVERAGE AND APPOSITION
With regard to the uncovered struts, Kim et al demonstrated that the incidence of uncovered struts was significantly higher in SES than in PES at nine months after stent implantation, and the frequency of cross-sections with an uncovered proportion >0.3 was significantly higher in SES than in PES10. This trend was similar to our results. In addition, our data demonstrated that neointimal coverage after both SES and PES implantation improved from eight- to 18-month follow-up. However, even at 18 months after stent implantation, cross-sections with an uncovered percentage >0.3 were still present in 22.4% of SES and 6.0% of PES struts. Finn et al7 reported that the best morphometric predictor of late stent thrombosis was a value of >0.3 for the proportion of uncovered total stent struts. Although the uncovered proportion and percentage of cross-sections with an uncovered proportion >0.3 were significantly higher in SES than in PES, the incidence of stent thrombosis in the two groups was similar11. Therefore, the value of >0.3 for the proportion of uncovered total stent struts may not be suitable to apply to clinical settings, including predicting stent thrombosis, because this value was deduced from a limited autopsy study4. With regard to the malapposed percentage, the SES group showed a higher malapposed percentage than PES at both eight- and 18-month follow-up. Because stent struts are thicker in SES than in PES, strut malapposition may be a more frequent occurrence in SES. It was reported that incomplete stent apposition was highly prevalent in patients with very late stent thrombosis after DES implantation12. Moreover, new malapposed struts emerged at 18-month follow-up in two patients with SES, and one patient had an onset of very late stent thrombosis 27 months after SES implantation (Figure 5, Figure 6). In an OCT study, at five years of follow-up, despite an overall low degree of uncovered and malapposed struts in event-free patients, coronary evaginations were more common among SES- than PES-treated lesions, which may have been the source for very late stent thrombosis13. Thus, physicians should be wary of malapposition.
NEOINTIMAL HYPERPLASIA
Previous trials demonstrated that angiographic restenosis and late loss were significantly lower in SES than in PES14,15. From registry data, it was reported that the initial advantage of reduced target lesion revascularisation in SES compared to PES diminishes at three years after implantation16. Our OCT data also demonstrated that, at 18-month follow-up, NIH thickness and %NIH were significantly lower in SES than in PES.
Serial changes of neointimal formation have been previously reported in BMS and SES using various modalities. Reports using coronary angiography showed that the neointima of SES increased from six months to one year, whereas that of BMS regressed16. This neointimal regression after BMS implantation is considered to correlate with an increase in the lumen diameter measured by QCA17 and a decrease in the neointimal area measured by IVUS18. Reports using coronary angioscopy demonstrated serial changes in neointimal progression in SES6,19. These angioscopic findings were similar to serial angiographic and IVUS measurements after SES implantation20. Our OCT serial analyses have shown that NIH thickness and %NIH significantly increased from eight- to 18-month follow-up in SES. Katoh et al21 also reported that neointimal growth increased from six months to 12 months based on serial OCT findings. Thus, various imaging modalities including OCT have shown delayed healing of neointimal coverage in SES, at least until 48 months, as in the present data.
However, serial angiographic and IVUS studies for PES are very limited and have shown some discrepancies. In a two-year follow-up of angiographic and IVUS data, Tsuchida et al22 showed a statistically insignificant decrease in lumen loss by QCA analysis, but the IVUS data showed a slight increase in the neointimal area. Our previous data23 using coronary angioscopy indicated that the minimum neointimal coverage at 18 months after PES implantation was significantly lower than that at the six-month follow-up. The present OCT data also demonstrated that NIH thickness,%NIH area and volume obstruction significantly decreased from eight months to 18 months after PES implantation; however, our QCA data on PES were different from our OCT data. The reason for the discrepancy may be partially explained by the resolution of the imaging modalities. OCT is a new intravascular imaging modality with a high axial resolution of approximately 10 to 20 μm, tenfold higher than that of IVUS. Thus, OCT can obtain better and more accurate imaging than IVUS and QCA to evaluate the neointimal volume after stent implantation. In addition, QCA takes into account only a single point of the stent (that of the MLD), whereas OCT averages the whole stent length.
QUALITATIVE ASSESSMENT OF NEOINTIMA
In our study, approximately 80% of the neointima was HI but the neointima indicated different qualitative changes between SES and PES. In SES, the incidence of HI neointima increased and that of PLI decreased from eight- to 18-month follow-up, whereas in PES the incidence of both HI and PLI decreased. Nakazawa24 reported that the mechanisms of late stent thrombosis were different between platforms: localised strut hypersensitivity was exclusive to SES, whereas malapposition secondary to excessive fibrin deposition was the underlying cause in PES. SES and PES showed different patterns of neointimal qualitative changes between eight- and 18-month follow-up that may have been induced by different eluted drugs and platforms.
MECHANISM OF DIFFERENT NEOINTIMAL CONDITIONS BETWEEN SES AND PES
Our OCT data demonstrated that the NIH thickness and %NIH volume obstruction significantly increased from eight to 18 months after SES implantation but significantly decreased after PES implantation. Interestingly, these two first-generation DES showed opposite neointimal hyperplasia conditions from eight months to 18 months after implantation. The reason for this discrepancy is unclear; however, we propose two possible mechanisms based on the lysis or organisation of thrombi or fibrin deposits over the stent struts and different properties of the eluted drug22. First, our previous report using angioscopy25 revealed a higher incidence of angioscopic thrombi in PES than in SES at both six- and 18-month follow-up, and a pathological study26 revealed fibrin deposition over stent struts in DES. Thus, if thrombi or fibrin over the struts dissolved or organised during the follow-up period, the NIH thickness and %NIH evaluated by OCT may decrease. Accordingly, these phenomena occur more frequently in PES, where struts might have a higher incidence of thrombi25, than in SES. Our OCT findings of neointimal qualitative changes also support this speculation. Previous pathological findings revealed peri-strut low-intensity area and low intensity correlated with fibrin and thrombus9,27,28. Thus, a discrepancy of changes in peri-strut low-intensity area between SES and PES may partially correlate with a discrepancy in changes of thrombi or fibrin over the struts between SES and PES. Second, sirolimus inhibits the G1 cell cycle and migration of vascular smooth muscle cells, whereas paclitaxel inhibits the mitosis (M) phase of the cell cycle and leads to apoptotic cell death29. In addition, sirolimus distributes equally within the vascular layers, whereas paclitaxel accumulates in the adventitia. These different properties may induce a higher degree of, albeit heterogeneous, neointimal proliferation in PES compared to SES.
In addition, the neointimal condition after DES implantation may be affected by other factors including stent design, drug dose and polymer biocompatibility. Vascular responses after DES implantation may differ between SES and PES.
Limitations
First, our study included a small and highly selected cohort of patients. Therefore, any poorly implanted stents may have strongly affected our results. However, we used IVUS before and after stent implantation to avoid poorly implanted stents, including malapposition and underexpansion, as much as possible. Second, we did not use OCT at baseline, and the post-procedural results were based upon angiography and IVUS. Therefore, a comparative OCT analysis is not possible. However, as mentioned above, all of the stent implantations in this study were IVUS-guided. Thus, we believe the incidence of malapposition and underexpansion of stents in this study is minimised and the baseline stent condition might not strongly affect our results. Finally, overlapping segments and bifurcation were excluded from our data. Accordingly, our results did not reflect these lesions. However, we think our data reflect the pure effects of each drug-eluting stent, SES and PES, on the coronary vessels.
Conclusions
The present OCT study has shown that percentages of uncovered and malapposed struts decreased from eight months to 18 months in both SES and PES, but the NIH thickness, %NIH area obstruction and volume obstruction showed opposite changes: these parameters significantly increased in SES and significantly decreased in PES from eight to 18 months. In addition, different qualitative changes of the neointima between eight and 18 months between SES and PES were shown. SES and PES showed different serial changes in neointimal conditions between eight and 18 months after implantation.
| Impact on daily practice According to our results, the incidence of uncovered struts was significantly higher in SES than in PES at both eight months and 18 months after stent implantation, and the frequency of cross-sections with an uncovered proportion >0.3 was significantly higher in SES than in PES. Moreover, new malapposed struts emerged at 18-month follow-up in two patients with SES, and one of these two patients had an onset of very late stent thrombosis at 27 months after SES implantation, but there were no new malappositions in PES. These data suggest that different types of stents can promote different healing rates. This may be relevant for tailoring the duration of dual antiplatelet therapy after stent implantation. |
Conflict of interest statement
The authors have no conflicts of interest to declare.