Abstract
Aims: In-stent restenosis (ISR) is an important cause of drug-eluting stent (DES) failure and target vessel revascularisation. In this study we aimed to evaluate differences between early and late-presenting restenosis in second-generation DES using optical coherence tomography (OCT).
Methods and results: Overall, 171 cases of second-generation DES ISR with a follow-up OCT minimum lumen area <3.0 mm2 were included: 33.3% of patients (n=57) had early ISR, and 66.7% (n=114) had late ISR (duration from stent implantation >1 year). Minimum stent area (MSA) <4.0 mm2, neointimal thickness <100 µm, and heterogeneous neointimal hyperplasia (NIH) were more prevalent in early ISR, whereas NIH with neoatherosclerosis trended towards being more frequent for late ISR (28.9% vs. 15.8%, p=0.06). Multivariable analysis revealed that duration from implantation >2 years, absence of statin use, and NIH >50% were independent predictors for neoatherosclerosis (all p<0.05).
Conclusions: OCT morphological characteristics of second-generation DES ISR differ between early and late presentation. Early ISR was associated with MSA <4.0 mm2, while neoatherosclerosis contributed more commonly to late ISR.
Abbreviations
BMS: bare metal stent
CSA: cross-sectional areas
DES: drug-eluting stent(s)
EES: everolimus-eluting stent(s)
ISR: in-stent restenosis
IVUS: intravascular ultrasound
MLA: minimum lumen area
MSA: minimum stent cross-sectional area
NIH: neointimal hyperplasia
OCT: optical coherence tomography
Introduction
Second-generation drug-eluting stents (DES) significantly reduce in-stent restenosis (ISR) and the need for repeat revascularisation compared with bare metal stents (BMS) or first-generation DES1,2. Furthermore, clinical evidence is consistent with less “late catch-up” in second-generation DES3,4; however, reintervention is still needed in approximately 5-10%, depending on the cohort, duration, and stent type5. Most intravascular imaging reports are based on data from first-generation DES6,7. The aim of this study was to use optical coherence tomography (OCT) to evaluate early and late ISR in second-generation DES.
Methods
PATIENTS
We retrospectively reviewed 483 patients (505 previously stented lesions) who underwent OCT follow-up at two sites in the United States of America (NewYork-Presbyterian Hospital, New York, NY, USA; St. Francis Hospital, Roslyn, NY, USA) from February 2011 to January 2016. ISR was defined as an OCT in-stent minimum lumen area (MLA) <3.0 mm28,9. We excluded 189 lesions that had an MLA ≥3.0 mm2: six with stent thrombosis, but not ISR; 19 with poor image quality; 14 with multiple ISR lesions (only the most severe ISR lesion was included); three ISR in a saphenous vein graft; and 103 ISR that were either first-generation DES or BMS. Second-generation DES restenosis (171 patients; 171 lesions) included PROMUS™ (Boston Scientific, Marlborough, MA, USA) everolimus-eluting stents (EES), XIENCE® (Abbott Vascular, Santa Clara, CA, USA), and Resolute™ (Medtronic, Minneapolis, MN, USA) zotarolimus-eluting stents. Early (≤1 year) vs. late (>1 year) presentation was based on duration from stent implantation. Analysis included medical and intervention history, angiographic and procedural data, and OCT parameters. The study complied with the Declaration of Helsinki. The NewYork-Presbyterian Hospital and St. Francis Hospital ethics committees approved the research protocol.
Clinical ISR presentation was divided into acute coronary syndromes (including unstable angina [no ST-segment elevation and no biomarker release, but angina at rest, new-onset angina, or a crescendo pattern of angina occurrence], ST-segment elevation myocardial infarction, or non-ST-segment elevation myocardial infarction [no ST-segment elevation, but with biomarker release]) versus non-acute coronary syndromes.
Coronary angiograms were analysed by trained interventional cardiologists at the Cardiovascular Research Foundation (New York, NY, USA) using Medis CMS software, version 7.2 (Medis medical imaging systems, Leiden, the Netherlands). Minimum lumen diameter and interpolated reference vessel diameter were used to calculate diameter stenosis ([1-minimum lumen diameter/reference vessel diameter]×100). Lesion length was measured as the distance from the proximal to the distal shoulder in the projection with the least amount of foreshortening. Angiographic restenosis was classified10 as: (1) focal ISR (Type I, defined as ISR <10 mm in length); (2) diffuse ISR (Type II, defined as ISR >10 mm length but within the stent); (3) proliferative (Type III, defined as ISR >10 mm in length but extending beyond the stent edges); and (4) total occlusion (Type IV).
OCT IMAGING AND ANALYSIS
An OCT catheter (C7 Dragonfly™ or Dragonfly™ Duo; St. Jude Medical, St. Paul, MN, USA) was introduced distal to the lesion, and contrast media was injected via the guiding catheter at a rate of 3-4 mL/s during pullback. OCT images were acquired using frequency-domain OCT (C7-XR™, ILUMIEN™, or ILUMIEN™ OPTIS™ OCT imaging systems; St. Jude Medical) at 100 or 180 frames/s at a pullback speed of 20-25 mm/s as described11. Off-line analysis was carried out by agreement of two independent cardiologists (L. Song and A. Maehara) blinded to patient baseline clinical and angiographic characteristics and using proprietary software (St. Jude Medical) after confirming calibration settings.
All cross-sectional OCT slices were evaluated, and stent and intra-stent lumen cross-sectional areas (CSA) were measured for slices with the minimum lumen CSA, minimum stent CSA (MSA), and maximum neointimal hyperplasia (NIH) CSA as reported12. Stent CSA was measured by joining middle points of the strut blooming. If the stent was covered by high signal attenuation tissue, stent CSA was delineated using proximal and distal slices. The percentage of NIH was calculated as ([stent–lumen CSA]/stent CSA)×100. Proximal and distal reference lumen CSAs were the slices with the largest lumen CSA within 5 mm proximal and distal to the stent edges, but before significant side branches (>1.5 mm in diameter). Underexpansion was defined as MSA <4.0 mm2.
Neoatherosclerosis was defined as NIH within the ISR segment that contained lipid, calcification, or neointimal rupture13. The distribution of neoatherosclerosis was categorised as: 1) focal (<10 mm in length); 2) multifocal (<10 mm in length and >5 mm apart); or 3) diffuse (≥10 mm in length). Lipidic NIH was a signal-poor region with diffuse borders; a thin-cap fibroatheroma had fibrous cap thickness ≤65 μm within lipidic NIH (Figure 1A)6,7. Neointimal calcium was a signal-poor area with a well-delineated border with the underlying NIH (Figure 1B). Neointimal rupture referred to a break in the fibrous cap connecting the lumen with the underlying lipidic NIH (Figure 1C). Tissue at the MLA site within the stented segment was assessed qualitatively to characterise the pattern of neointima as neoatherosclerosis or non-neoatherosclerotic tissue (homogeneous or heterogeneous tissue or mean neointimal thickness <100 µm) (Figure 1D). Homogeneous restenotic tissue showed uniform signal properties (high intensity or low intensity) without focal variation or attenuation (Figure 1E, Figure 1F)11. Heterogeneous restenotic tissue had variable optical properties and backscattering patterns and was divided into layered vs. non-layered (Figure 1G, Figure 1H): a layered pattern of heterogeneous neointimal tissue consisted of concentric layers with an endoluminal high backscattering layer and an abluminal layer with low backscattering optical properties. Macrophage accumulation was a high-intensity, signal-rich, linear region with sharp attenuation and a narrow trailing shadow that changed frame by frame (Figure 1I). Thrombus (Figure 1J), microvessels, and peri-strut low-intensity areas were also noted as reported (Figure 1K)6,7,12-14.
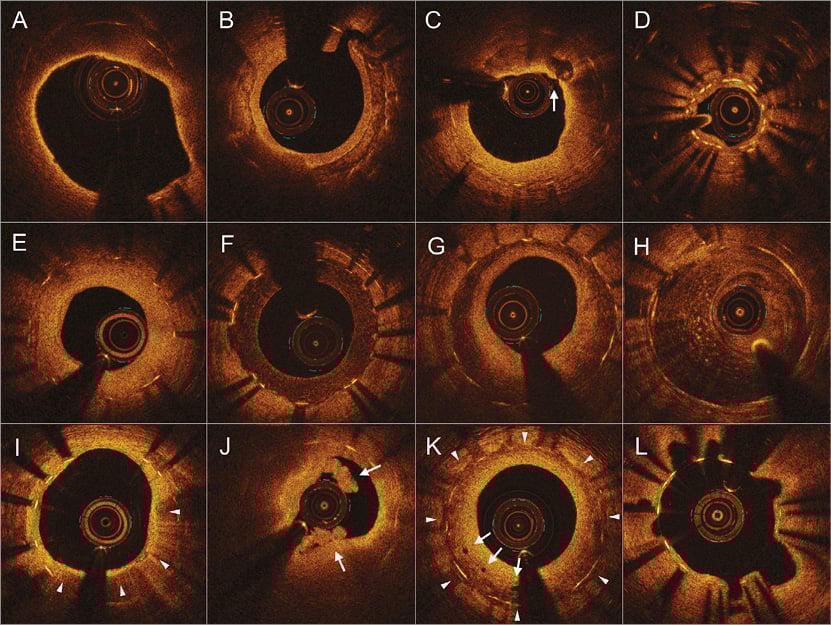
Figure 1. Representative optical coherence tomography images of various vascular morphologies. A) Lipidic neointimal hyperplasia, thin-cap fibroatheroma. B) Neointimal calcium. C) Neointimal rupture (arrow). D) Intimal thickness <100 μm (underexpanded stent). E) Homogenous hyperplasia, high-intensity. F) Homogenous hyperplasia, low-intensity. G) Heterogeneous hyperplasia, layered pattern. H) Heterogeneous hyperplasia, non-layered pattern. I) Macrophage accumulation in neointimal hyperplasia (triangles). J) Thrombus (arrows) without rupture with lipidic neointimal hyperplasia. K) Peri-strut low-intensity area (triangles) and microvessels (arrows). L) Evagination.
A malapposed strut was a strut with a measured distance between its surface and the adjacent vessel surface greater than the sum of the thickness of the strut plus polymer (zotarolimus-eluting stents ≥110 μm; EES ≥100 μm). Malapposition distance was measured from the centre of the strut blooming to the adjacent lumen border12. Coronary evagination was the presence of an outward protrusion in the luminal vessel contour between well-apposed struts with a maximum depth of the protrusion >10% of mean stent diameter within the same frame (Figure 1L)15. Stent fracture was classified as a separation of the stent into two pieces separated by image slices with ≥120° of the stent circumference having no visible struts. Stent deformation was distortion, shortening, or severe maldistribution of struts as reported16.
STATISTICAL ANALYSIS
Only one ISR lesion was analysed per patient. Continuous variables that were non-normally distributed were reported as median with first and third quartiles; normally distributed continuous variables were reported as mean and standard deviation. Comparisons among the groups were performed with the Student’s t-test for normally distributed or the Mann-Whitney U test for non-normally distributed continuous variables. Categorical variables were summarised as numbers (percentages) and compared using χ2 statistics or Fisher’s exact test, as appropriate. A multivariable logistic regression model was created to identify factors associated with in-stent neoatherosclerosis; clinically important variables as well as variables statistically significant on univariate analysis were entered into the model. A p-value <0.05 was considered statistically significant. All statistical analyses were performed using SPSS software, Version 22.0 (IBM Corp., Armonk, NY, USA).
Results
CLINICAL CHARACTERISTICS
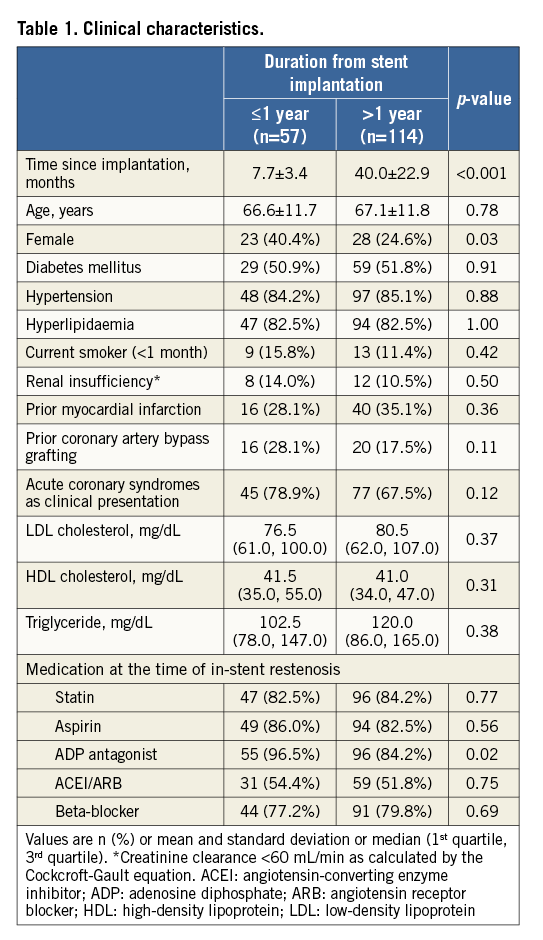
There were 120 men and 51 women with a mean age of 66.9±11.7 years. Duration from implantation was ≤1 year in 33% of patients (n=57) and >1 year in 66% of patients (n=114). Overall, 122 out of 171 enrolled patients (71.3%) had acute coronary syndrome as the clinical presentation. Among the others, 19 presented with stable angina (11.1%), 27 were without ischaemic symptoms, but had a positive stress test or fractional flow reserve <0.8 (15.8%), and only three (1.8%) had no ischaemia and did not have an intervention. Female sex and adenosine diphosphate antagonist use were more common in the early restenosis group (Table 1). There was no difference in angiographic characteristics between early vs. late DES restenosis other than that left circumflex location was more common in early ISR, and the minimum lumen diameter tended to be larger in the early DES restenosis group (Table 2).

OCT FINDINGS
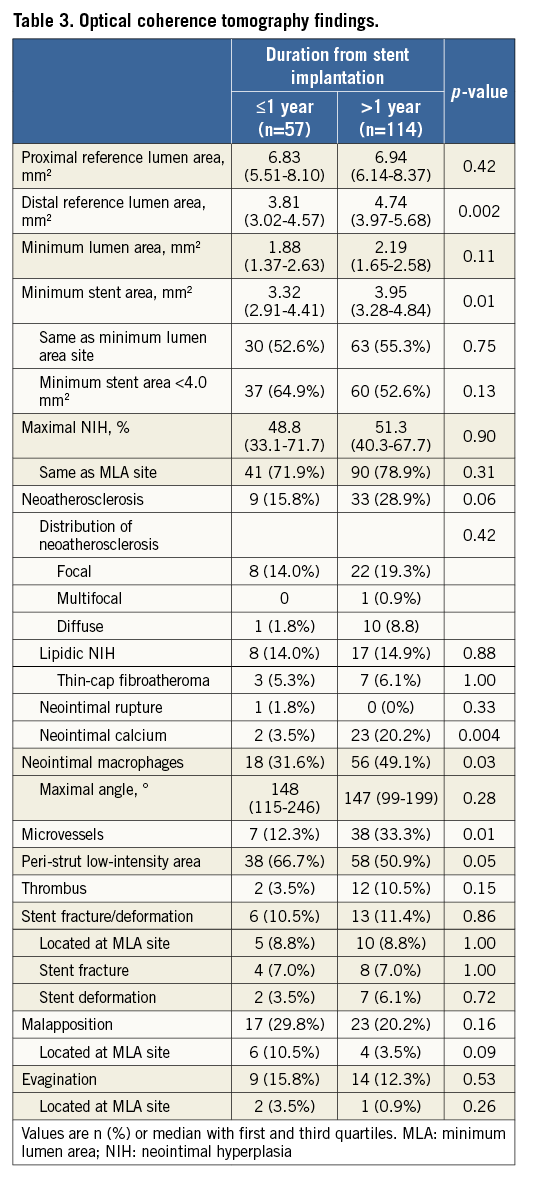
In OCT-detected second-generation DES restenosis, the MSA was smaller in early vs. late presentation (3.32 mm2 [interquartile range 2.91-4.41] vs. 3.95 mm2 [interquartile range 3.28-4.84], p=0.01) (Figure 2), as was the distal reference lumen area (Table 3).
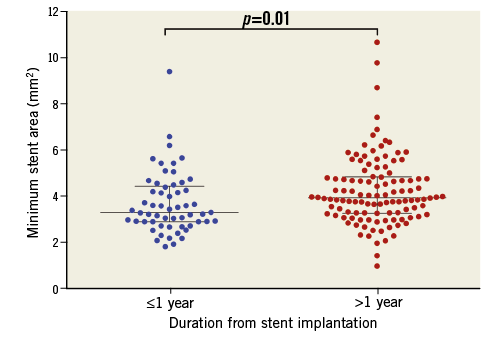
Figure 2. Minimum stent area among different stents. The minimum stent area was smaller in early compared with late presenting in-stent restenosis (3.32 mm2 [interquartile range 2.91-4.41] vs. 3.95 mm2 [interquartile range 3.28-4.84], p=0.01).
Based on measurements at the MLA site, the ISR pattern was divided into dominant MSA <4.0 mm2 (MSA <4.0 mm2 and NIH ≤50%), dominant NIH (MSA ≥4.0 mm2 and NIH >50%), or mixed (MSA <4.0 mm2 and NIH >50%). There was a trend for more MSA <4.0 mm2 in early ISR and more dominant NIH in late ISR (Figure 3).
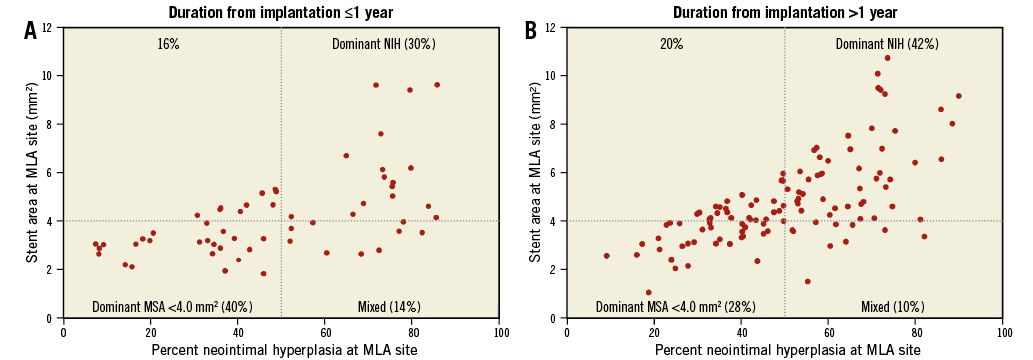
Figure 3. Percent neointimal hyperplasia and stent area at minimum lumen area site. Based on the measurements at the minimum lumen area (MLA) site, in-stent restenosis (ISR) was divided into dominant minimum stent area (MSA) <4.0 mm2 (MSA <4.0 mm2, neointimal hyperplasia [NIH] ≤50%), dominant NIH (MSA ≥4.0 mm2 and NIH >50%), and mixed (MSA <4.0 mm2 and NIH >50%). Early ISR had a trend of more MSA <4.0 mm2 versus late ISR (40% vs. 28%, p=0.11), whereas late ISR presented with more dominant NIH (42% vs. 30%, p=0.12).
In-stent neoatherosclerosis was detected in 24.6% of lesions (42/171), with a trend for less neoatherosclerosis in early vs. late ISR (15.5% vs. 28.9%, p=0.06), especially for the presence of calcified NIH (3.5% vs. 20.2%, p=0.004) (Table 3). The distribution of neoatherosclerosis tended to be more focal in early vs. late ISR (89% [8/9] vs. 67% [22/33], p=0.25). Of note, in the current population neoatherosclerosis always clustered within 0.5 mm of the MLA site. There was a significant difference in distribution in the pattern of non-neoatherosclerotic tissue between the two groups: more heterogeneous neointima in early ISR (p=0.049); more homogeneous neointima in late ISR (p=0.04), particularly the high-intensity pattern (p=0.01); and more neointimal thickness <100 μm in early restenosis (p=0.001) (Figure 4). The cumulative prevalence curve also showed that, with time after implantation, there was a less heterogeneous, but a more homogenous pattern with a greater frequency of neoatherosclerosis (Figure 5).
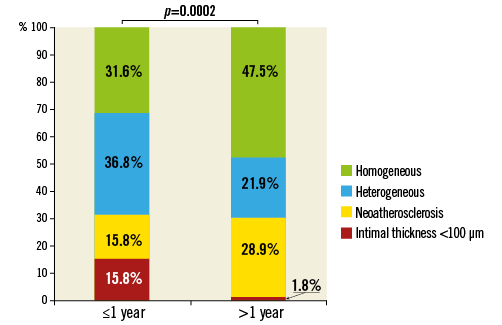
Figure 4. Pattern of restenotic tissue. Early in-stent restenosis presented more commonly with a non-atherosclerosis pattern of heterogeneous hyperplasia or mean neointimal thickness <100 μm, whereas late in-stent restenosis had more neoatherosclerosis or homogeneous hyperplasia (p=0.0002).
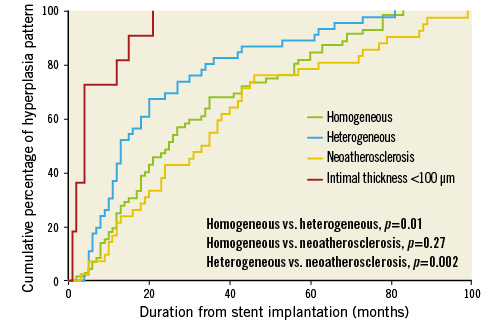
Figure 5. Cumulative percentage of restenotic pattern with duration from implantation. Over time there was less heterogeneous neointimal hyperplasia (NIH) or mean neointimal thickness <100 μm, but more homogenous NIH and neoatherosclerosis was found with greater frequency.
There was no difference in stent fracture, malapposition, or evagination between early vs. late ISR. Overall, the majority of stent fractures/deformation (78.9%), but a minority of malappositions (25.0%) and evaginations (13.0%) occurred at the MLA site (Table 3).
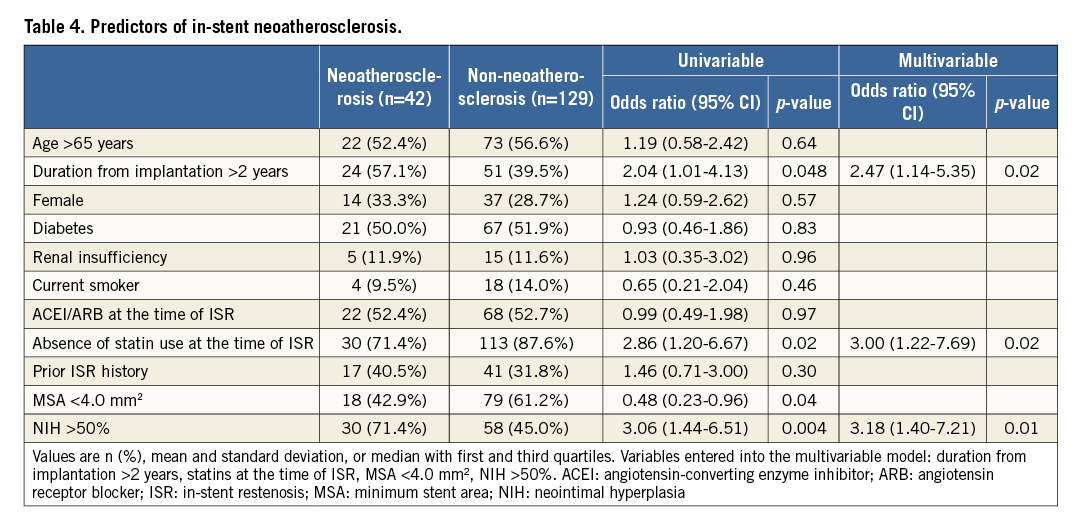
PREDICTORS OF NEOATHEROSCLEROSIS
Multivariable analysis revealed that duration from implantation >2 years (odds ratio [OR]: 2.47, 95% confidence interval [CI]: 1.14-5.35; p=0.02), absence of statin use at the time of ISR (OR: 3.00, 95% CI: 1.22-7.69; p=0.02), and NIH >50% (OR: 3.18, 95% CI: 1.40-7.21; p=0.01) were independently associated with in-stent neoatherosclerosis (Table 4). If absence of statin use at the time of ISR was replaced with low-density lipoprotein levels, low-density lipoprotein levels were not predictive of neoatherosclerosis.
Discussion
The main findings of the current OCT analysis of second-generation DES restenosis were the following. 1) Early second-generation DES restenosis presented more often with an MSA <4.0 mm2 and heterogeneous hyperplasia. 2) NIH was more frequently observed among late restenoses and included neoatherosclerosis as an important mechanism. 3) Longer duration from stent implantation, absence of statin treatment, and higher NIH burden were independent predictors for neoatherosclerosis.
EARLY ISR
The present study demonstrated that a small stent area was an important factor for early ISR in second-generation DES, especially lesions with an MSA <3.0 mm2 (35.1% in early vs. 17.5% in late ISR, p=0.01). A larger stent area provided more room to accommodate NIH (bigger-is-better paradigm). Castagna et al17 reported that 20% of 1,090 BMS restenosis lesions had an intravascular ultrasound (IVUS) MSA <5.0 mm2. In the DES era, the prevalence of underexpansion as a cause of ISR has increased compared with BMS, although the threshold was reduced when NIH was inhibited18; more than 50% of cases in the current study had an OCT MSA <4 mm2, consistent with other DES studies19-21. A serial IVUS study by Sonoda et al18 suggested that the cut-off values of the post-procedure MSA to predict freedom from restenosis at eight months were 6.5 mm2 for BMS and 5.0 mm2 for sirolimus-eluting stents. A similar study by Song et al20 demonstrated the thresholds of 5.5 mm2 for sirolimus-eluting stents, 5.3 mm2 for zotarolimus-eluting stents, and 5.4 mm2 for EES. A small stent area reflected both stent underexpansion and/or implantation into a small vessel, as shown by the fact that there was no significant difference for the MSA/distal reference lumen area ratio between early vs. late ISR22. In the recent IVUS-XPL study, Hong et al19 demonstrated that an IVUS-optimised MSA (MSA greater than the distal reference lumen CSA) was protective for one-year MACE after EES implantation (1.5% vs. 4.6%, p=0.02).
In the current study, a heterogeneous pattern of neointima was observed in early ISR. This was believed to represent a process of healing where glycosaminoglycan proteins were substituted for smooth muscle cells and collagen matrix (Figure 4, Figure 5)23. Chung et al24 showed that a speckled neointimal pattern (similar to the heterogeneous, non-layered pattern in our current study) represented myxomatous tissue containing extracellular matrix enriched with proteoglycans that decreased over time to be replaced by matured smooth muscle cells or collagen deposition; a layered pattern, similar to peri-strut low-intensity area, was considered to represent the presence of fibrinoid or proteoglycans, another reflection of delayed arterial healing6,14. This process was usually completed within 28 days for BMS25, but was delayed after DES implantation26. Because of its retrospective design, the current study could not deduce a sequenced relationship between these two image patterns. Notably, an angioscopy study from Sera et al21 showed that inadequate stent expansion was associated with angioscopically incomplete neointimal coverage after sirolimus-eluting stent implantation.
LATE RESTENOSIS
In-stent neoatherosclerosis has been associated with late DES failure in an OCT study by Kang et al7. Our findings are consistent with this and supported by a pathology study in second-generation DES (48% prevalence in late vs. 17% in early ISR)27. Unlike in BMS where neoatherosclerosis occurred almost exclusively after three years, neoatherosclerosis in second-generation DES appeared early and increased over time. Calcified NIH was observed more often in late ISR, also consistent with a previous autopsy study13,27, and similar to progression of atherosclerotic plaques in native arteries28. Our findings of microvessels and macrophages in late neointima indicated their role in atherosclerotic progression and late restenosis, consistent with OCT literature6,7. Histopathological studies have shown that microvessels usually expand from adventitia into plaque, and circulating macrophages infiltrate through the vasa vasorum. The infiltration of activated macrophages and deposition of foam cells might have induced the development of neoatherosclerosis and plaque destabilisation27,29.
Predictors for neoatherosclerosis in second-generation DES have been less well established. In previous studies, longer implant duration (≥48 months), first-generation DES (versus BMS), current smoking, chronic kidney disease, absence of angiotensin-converting enzyme inhibitors or angiotensin II receptor blockers, and underlying unstable plaques were independent predictors for neoatherosclerosis13,29. A more recent study including second-generation DES reported that chronic kidney disease, low-density lipoprotein cholesterol >70 mg/dL, and stent age were predictors for neoatherosclerosis, whereas the type of DES was not a predictor30. In the present study, we found that neoatherosclerosis occurred less frequently in lesions with an MSA <4.0 mm2 (32.4% vs. 18.6%, p=0.04) due to the absence of NIH, the foundation for neoatherosclerosis development. Acute coronary syndromes accounted for over 70% of clinical presentations, especially in late ISR and in lesions with lipidic NIH, emphasising the importance of risk factor control even after stent implantation.
Study limitations
This is a retrospective study, and most patients presented with symptoms or ischaemia. Second, the present study is not a serial analysis. Third, the definition of ISR was based on OCT instead of angiographic diameter stenosis (49.6% [36.5-64.0] in the early and 44.1% [32.6-56.1] in the late group), which may not be an adequate definition; however, all but three patients had demonstrable ischaemia. Fourth, as recently reported by Lutter et al, OCT has intrinsic limitations in the qualitative analysis of restenotic tissue; histopathologic equivalency should be interpreted with caution31. However, even in their study, the diagnostic accuracy of OCT was greater in restenotic lesions. Nevertheless, the definition of OCT-neoatherosclerosis has varied among studies in the literature and needs further clarification or validation or the use of combined imaging devices to include near-infrared spectroscopy or other technique of tissue characterisation32. Fifth, the cut-off for defining significant luminal narrowing and underexpansion is still a matter of debate. Sixth, reference lumen area assessment was limited by the length of pullback and was available in only 77% (131/171). Seventh, the reasons why patients were not treated with statins were not collected. Finally, because of the sample size, we could not demonstrate distinctive properties among different types of second-generation DES.
Conclusions
The OCT morphological characteristics of second-generation DES restenotic tissue were different between early vs. late presentation. Early restenosis was associated with MSA <4.0 mm2 while neoatherosclerosis contributed to late ISR.
| Impact on daily practice When in-stent restenosis is found in a second-generation DES <1 year after implantation, nearly half of the cases may have stent underexpansion. When in-stent restenosis is found in a second-generation DES after one year, about 1/3 of the cases may have neoatherosclerosis including neointimal calcification. OCT should be considered before decision making when treating in-stent restenosis to clarify the underlying causes. |
Acknowledgements
We appreciate the assistance of Cheolmin Lee, Xiao Wang, Yongqing Lin, Song-Yi Kim and Masaru Ishida for their help on quantitative analysis of angiography.
Conflict of interest statement
L. Song has received a research grant from Boston Scientific. G. Mintz is a consultant for Boston Scientific and ACIST, has received fellowship/grant support from Volcano, Boston Scientific, and Infraredx, and honoraria from Boston Scientific and ACIST. C.Y. Chin has received honoraria from ACIST. A. Kirtane has received institutional research grants to Columbia University from Boston Scientific, Medtronic, Abbott Vascular, Abiomed, St. Jude Medical, and Eli Lilly. M. Parikh is on the speakers bureau for Abbott Vascular, Boston Scientific, Medtronic, CSI, Corindus, and is on the advisory board of Abbott Vascular, Medtronic, and Philips. J. Moses is a consultant for Abiomed. Z. Ali has received grant support from and is a consultant for St. Jude Medical. R. Shlofmitz is a speaker for CSI. A. Maehara has received grant support from Boston Scientific and St. Jude Medical for research fellows, is a consultant for Boston Scientific and OCT Medical Imaging, and has received speaker fees from St. Jude Medical. The other authors have no conflicts of interest to declare.