Abstract
Aims: The features of neointima after bare metal stent (BMS) or drug-eluting stent (DES) implantation have not yet been fully characterised. The aim of this study was to investigate in-stent neointima characteristics according to stent type and restenotic phase.
Methods and results: The study included 59 consecutive patients undergoing target lesion revascularisation for in-stent restenosis (ISR) evaluated by optical coherence tomography (OCT) during the early phase (≤1 year, n=30) and late phase (>1 year, n=29) after either BMS (n=37) or DES (n=22) implantation. The OCT signal patterns of tissues at the minimal lumen area were categorised into three patterns: (1) homogeneous high-signal band, (2) heterogeneous mixed-signal band, and (3) lipid-laden intima. The predominant OCT pattern was homogeneous high-signal band in the BMS early phase (19/21 [91%]), lipid-laden intima in the BMS late phase (12/16 [76%]), and heterogeneous mixed-signal band in the DES late phase (9/13 [69%]). Heterogeneous mixed-signal band was seen more frequently in the DES early phase compared with BMS early phase (44% vs. 9%, p<0.05).
Conclusions: There were differences of neointima according to stent type and restenotic phase, and this may lead to a better understanding of the different mechanisms of ISR.
Introduction
Previous studies demonstrated that neointima after bare metal stent (BMS) implantation is mainly composed of vascular smooth muscle cells associated with the vascular healing response in the early phase1. However, neointimal tissue inside the stent often transforms into lipid-laden tissue over an extended time period after implantation2,3. It is still unknown if neointima morphology associated with in-stent restenosis (ISR) is similar after drug-eluting stent (DES) and BMS implantation. Optical coherence tomography (OCT) is a high-resolution imaging modality capable of investigating detailed vascular healing after stent implantation in vivo4-6. The aim of this study was to use OCT to compare the morphologic characteristics of neointima between the two stent types (BMS vs. DES) in both the early and late restenotic phases.
Methods
The study population was recruited from 74 consecutive patients who were admitted to Fukuyama Cardiovascular Hospital between April 2009 and August 2011 for target lesion revascularisation (TLR). The ISR lesion that needed TLR was defined as 90% diameter stenosis by visual assessment or 75% to 90% diameter stenosis with myocardial ischaemia. Patients were not eligible for enrolment if they underwent intervention in the setting of primary or emergent percutaneous coronary intervention (PCI) for acute coronary syndrome (ACS) (n=5), had edge restenosis (n=6) or had total occlusion (n=4). The final study population (n=59, 59 lesions) evaluated by OCT included 30 segments in the early phase (≤1 year) and 29 segments in the late phase (>1 year) after implantation of a BMS (n=37) or DES (n=22). The study protocol was approved by the institutional ethics committee of Fukuyama Cardiovascular Hospital, and written consent was obtained from all patients before the procedure.
All lesions responsible for ISR were evaluated by OCT prior to revascularisation. The region of interest included the stent region, but did not include the margins, defined as the stent edges and vessel segments 5 mm proximal or distal to the stent. OCT acquisition was performed using a commercially available system for intracoronary imaging (LightLab Imaging Inc., Westford, MA, USA). A 0.016 inch wire-type imaging catheter (ImagingWire; LightLab Imaging Inc.) was advanced to the distal end of the stent through a 4 Fr over-the-wire occlusion balloon catheter (Helios™; LightLab Imaging). The occlusion balloon was then inflated to 0.3 to 0.5 atm, while lactated Ringer’s solution was infused from the balloon tip at 0.5 ml/s to flush blood from the imaging field. The entire stent was imaged with an automatic pullback device moving at 1.5 mm/s.
The two observers were blinded to the clinical and procedural characteristics. Offline analysis was performed with the proprietary LightLab software (LightLab Imaging Inc.). To test the interobserver variability of the OCT ISR patterns, the minimal lumen area (MLA) image was analysed independently by two observers not involved in the primary data analysis. One of the observers repeated the analysis one week later to assess the intraobserver variability.
Cross-sectional images were analysed at longitudinal intervals of 1 mm, and the neointimal area for each cross-section was measured by a method of multiple-pointed trace. The OCT signal patterns of tissues in the region of MLA were categorised into three patterns by agreement of two observers: (1) homogeneous high-signal band, (2) heterogeneous mixed-signal band and (3) lipid-laden intima (Figure 1). A two-layer appearance with visible stent strut was categorised into homogeneous high-signal band, while a two-layer appearance without visible stent struts was categorised into heterogeneous mixed-signal band (Figure 1B and Figure 1C). To describe the morphologic appearance of the restenotic tissue, the parameters, including the presence of thin-cap fibroatheroma (TCFA), microvessels, intimal disruption and presence of thrombus, were analysed within the stent (Figure 2). Thrombus was identified as a mass that protruded into the vessel lumen from the surface of the vessel wall7,8. Red thrombus was defined as high-backscattering protrusions inside the lumen of the artery with signal-free shadowing in the OCT image (Figure 2E). White thrombus was defined as signal-rich with low-backscattering protrusions (Figure 2F). Lipid-laden intima was defined as a signal-poor region with diffuse borders. Calcification was defined as well-delineated, signal-poor mass with a sharp border9. For all plaques with an OCT-determined lipid core, the fibrous cap thickness was measured at its thinnest part. If the fibrous cap of a given plaque was visible, cap thicknesses were measured five times and the average of the three middle values was calculated. A TCFA was defined by OCT analysis as a plaque with lipid content in ≥1 quadrant and the thinnest part of a fibrous cap measuring ≤65 µm.
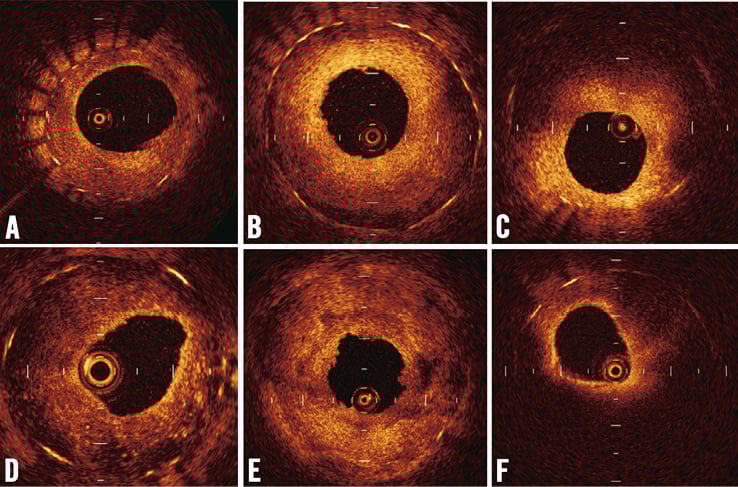
Figure 1. Patterns of neointima at minimum stent area by optical coherence tomography. The neointima was classified into the following categories: (A) homogeneous high-signal band, (B) homogeneous high-signal band which has a two-layer appearance with visible stent struts, (C) heterogeneous mixed-signal band which has a two-layer appearance without visible stent struts, (D) heterogeneous mixed-signal band with a speckled pattern, (E) heterogeneous mixed-signal band with low and high backscatter, and (F) lipid-laden intima (sudden attenuated intima with diffuse borders).
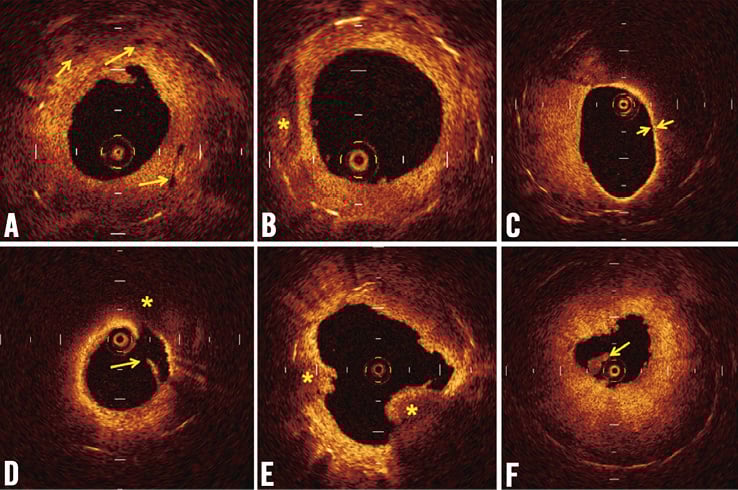
Figure 2. Representative findings of in-stent neointima by optical coherence tomography. (A) Microvessels appear as well-delineated, low-backscattering structures less than 200 microns in diameter. (B) Calcification was defined as a well-delineated, signal-poor mass with sharp borders. (C) A thin-cap fibroatheroma (TCFA) was defined as a plaque with lipid content in ≥1 quadrant and the thinnest part of a fibrous cap measuring ≤65 μm. (D) Disrupted intima (yellow arrow) and lipid tissue (*) are seen. (E) Red thrombus (*) is high-backscattering protrusion with signal-free shadow. (F) White thrombus (yellow arrow) was characterised as signal-rich and low-backscattering protrusion.
The restenotic tissue area was defined as the stent area minus the lumen area. Restenotic tissue burden was defined as restenotic tissue area/stent area ×100. The cross-section containing the MLA was used to determine the maximum and the minimum restenotic tissue thickness and to calculate the restenotic tissue symmetry ratio (maximum restenotic tissue thickness/maximum restenotic tissue thickness − minimum restenotic tissue thickness)10. OCT restenosis length was defined as the lesion length with >50% cross-sectional area narrowing by neointimal formation. A lesion <10 mm was defined as a focal lesion. When the strut was not fully visible, the position of the stent strut was measured according to the proximal and distal visible struts with longitudinal findings.
We compared the data as follows: (1) within the same stent types (BMS or DES) to compare the early phase with the late phase; (2) within the same phase to compare the different stents (BMS vs. DES). Data are expressed as mean±SD for continuous variables and as percentages for categorical variables. Continuous variables were compared using a Student’s t-test. Categorical variables were compared using a chi-square test or Fisher’s exact test, as appropriate. Kappa (κ) test was used to assess the interobserver and intraobserver variability for qualitative OCT assessment. All calculated p-values were two-sided and differences were considered to be statistically significant when the respective p-values were <0.05.
Results
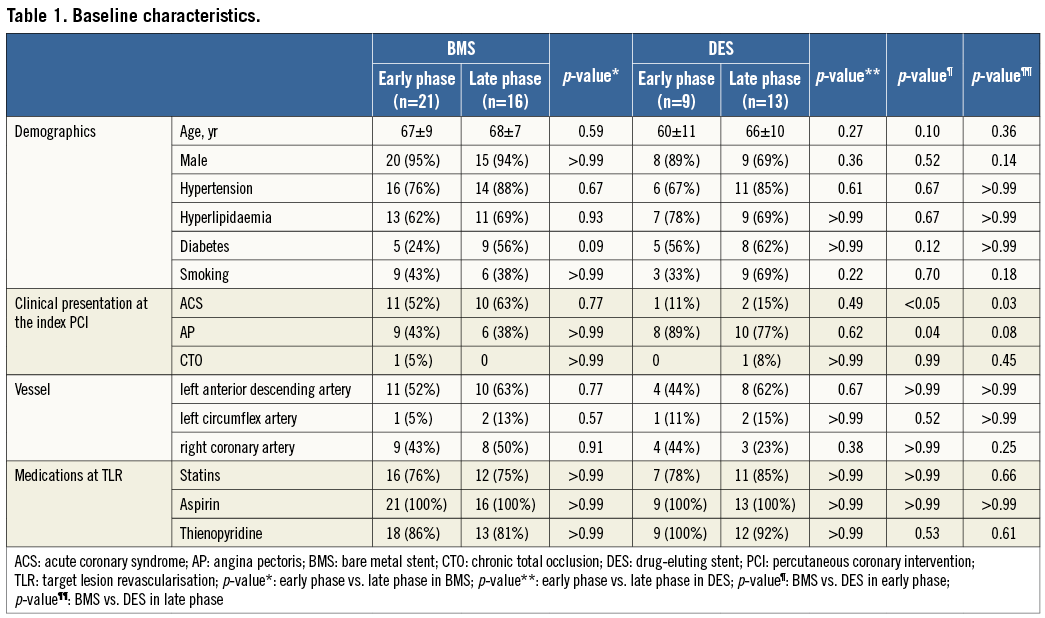
Baseline clinical characteristics according to stent type and restenotic phase are shown in Table 1. Patient characteristics were not significantly different among the four groups. Stents were implanted originally for stable angina in 33 (56%), ACS in 24 (41%) and chronic total occlusion in two (4%) of the cases. A BMS was implanted more frequently than a DES in ACS patients (57% vs. 14%, respectively, p=0.001). There were no significant differences among the four groups concerning the location of the target lesion or medications used at the time of TLR.
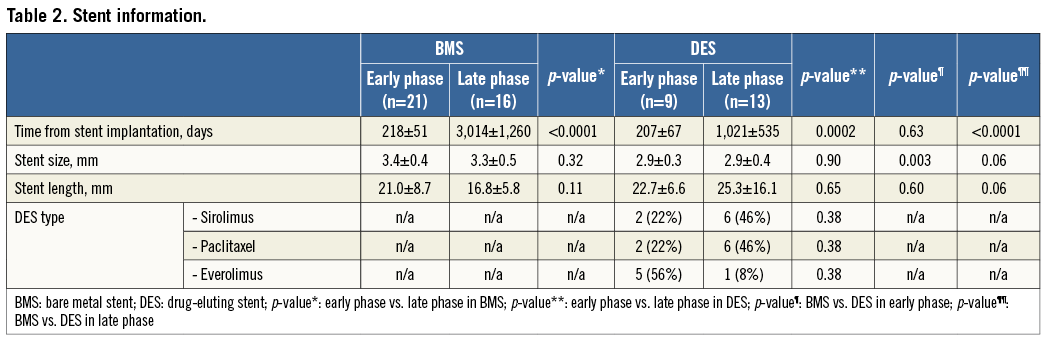
Although the mean duration from stent implantation to OCT was similar between the BMS early phase and DES early phase (218±51 days vs. 207±67 days, respectively, p=0.63), the duration was significantly longer in the BMS late phase compared with the DES late phase (3,014±1,260 days vs. 1,021±535 days, respectively, p<0.0001). Stent size was significantly greater and stent length tended to be shorter in the two BMS groups compared with the two DES groups. Among nine ISR segments in the DES early phase, there were two sirolimus-eluting stents (SESs), two paclitaxel-eluting stents (PESs) and five everolimus-eluting stents (EESs). In contrast, among 13 ISR segments in the DES late phase, there were six SESs, six PESs, and one EES (Table 2).
Homogeneous high-signal band was found in 19 (91%) of 21 cases in the BMS early phase, and lipid-laden intima was seen in 12 (75%) of 16 patients in the BMS late phase. The predominant findings were heterogeneous mixed-signal band (69%); while the rate of lipid-laden intima was rare (8%) in DES late phase (Table 3). Heterogeneous mixed-signal band was more frequently seen in DES compared with BMS in the early phase (44% vs. 9%, p<0.05). Although the prevalence of intracoronary thrombus was not rare (n=11, 19%) in this stable angina population, the majority of the thrombus was white thrombus (n=8, 73%), except for three cases of red thrombus in BMS late phase. Intimal disruption was seen more frequently in BMS late phase than in BMS early phase (50% vs. 10%, p=0.001). Of note, the thrombus was more frequently observed in patients with intimal disruption than those without it (54% [7/13] vs. 9% [4/46], p=0.001) and in those with lipid-laden intima than those without it (38% [5/13] vs. 13% [6/46], p=0.05). A TCFA was seen in two (18%) of the 11 patients with lipid-laden intima in the BMS late phase. The reproducibility variability for the in-stent restenosis OCT signal patterns was as follows; κ=0.84 for interobserver and κ=0.94 for intraobserver.
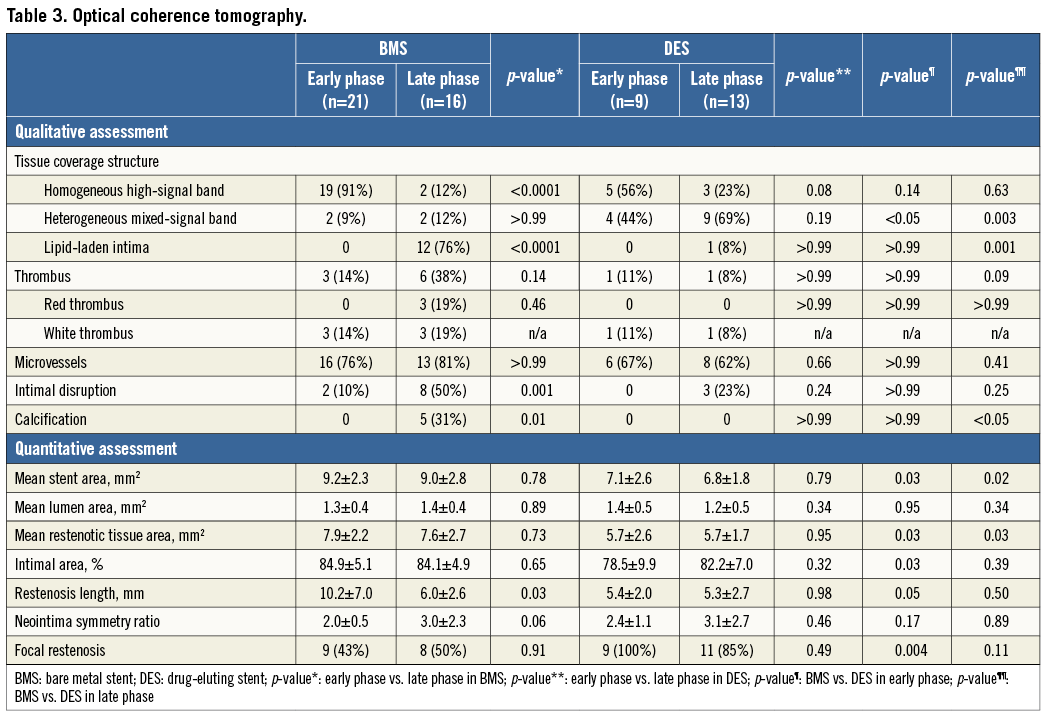
The stent areas at the site of MLA and restenotic tissue area were significantly different among the four groups, whereas the MLA and % intimal area were similar among the four groups. Lesion length was significantly longer in the two BMS groups compared with the two DES groups.
Discussion
In a previous study, tissue coverage appearance was categorised into three types: layered, homogeneous, and heterogeneous6. In other studies, the layered pattern was classified into two patterns, including two-layer with visible struts and two-layer without visible struts, because OCT signal patterns in DES ISR were more varied than in BMS ISR11,12. In the current study, the layered pattern was classified into two patterns according to the predominance of the low-backscatter area. A two-layer appearance with visible stent struts was categorised as homogeneous high-signal band (Figure 1B), while a two-layer appearance without visible stent struts was categorised as heterogeneous mixed-signal band (Figure 1C). A previous pathology study demonstrated that OCT images of fibrous plaques were characterised by homogeneous, signal-rich regions, fibrocalcific plaques by well-delineated, signal-poor regions with sharp borders, and lipid-rich plaques by signal-poor regions with diffuse borders. However, a predominantly fibrous plaque containing small amounts of lipid could be misdiagnosed as lipid-rich plaque9. In the future, further study is warranted to compare the OCT two-layer findings and histologic tissue components. However, of note, the restenotic tissue structure could be assessed by in vivo OCT with low interobserver and intraobserver variability.
The heterogeneous mixed-signal band which included low-backscatter signal was more frequently observed in DES than in BMS in the early phase. Previous studies demonstrated that low-signal images in the deep tissue layer suggest fibrin surrounded by proteoglycan extracellular matrix13,14. Therefore, the heterogeneous low-intensity areas in the DES seemed to represent delayed arterial healing, possibly resulting from peri-strut inflammation. These findings could be consistent with previous studies that demonstrated DES showed an earlier onset of neoatherosclerosis and a higher incidence of lesion formation as compared with BMS15. On the other hand, our data demonstrated that the neointima of the BMS early phase was homogeneous high-signal band, which is mainly composed of vascular smooth muscle cells1,16. The neointima of the BMS late phase was lipid-laden intima, which is similar to that of so-called “de novo atherosclerosis”. These findings could be consistent with previous studies that demonstrated stable fibrous neointima changed into lipid-rich plaque five years after BMS implantation2,3,17.
Intraluminal thrombus was seen in 11 (19%) of 59 patients in this stable angina population. The majority of the thrombus was white thrombus, which is considered an older thrombus in the process of thrombus organisation and mainly consists of platelet and fibrin7. Pathologic studies have demonstrated that organised thrombus can be a component of restenosis in both BMS and DES18-20. On the other hand, plaque rupture with subsequent thrombus formation is the most frequent cause of acute coronary syndromes, such as acute myocardial infarction21. In the current study, thrombus was more frequently seen in the patients with intimal disruption or lipid-laden intima compared to those without them. These findings are consistent with the previous studies which demonstrated that thrombus formation was closely associated with intimal disruption and lipid-laden intima2,22. Although it was not clear why some intracoronary thrombus culminated in ACS and some did not, angiographic evidence of complexity does not by itself necessarily determine the destiny of a plaque23. In other words, although angiographically determined complexity correlates closely with plaque instability pathologically, such plaques may remain stable over time24,25.
Previous OCT studies were not completely consistent with regard to the prevalence of plaque rupture, red thrombus and/or lipid-laden intima2,12,26,27. A possible explanation for these differences may be the variability of factors including the time after stent implantation, stent type, intimal burden, and different disease acuity (unstable or stable angina).
Study limitations
The present study has several limitations. First, this was a single-centre study based on a relatively limited sample size, raising the possibility of selection bias. In addition, no comparison among DES types could be performed due to the limited number. The study should be considered only exploratory. Second, the diagnosis at the index PCI was significantly different between the patients with BMS and DES implantation. Third, we cannot simply compare the difference between the intima of the BMS late phase and DES late phase, because the average time interval between initial stent implantation and OCT imaging was significantly longer in the BMS late phase compared with the DES late phase. Finally, the main limitation is the lack of histologic data to validate the OCT findings.
Conclusion
The present OCT study demonstrated different characteristics of neointima based on stent type and restenotic phase. The predominant findings of neointima were homogeneous high-signal band in the BMS early phase, lipid-laden intima in the BMS late phase, and heterogeneous mixed-signal band in the DES late phase. Heterogeneous mixed-signal band was seen more frequently in DES compared with BMS in the early phase (44% vs. 9%, p<0.05). The present study suggests that the vascular healing pattern was somewhat different according to stent type and restenotic phase, and these findings may help to explain the different mechanisms of ISR.
Conflict of interest statement
The authors have no conflicts of interest to declare.