Abstract
Aims: The aim of the study was to develop a scoring model to evaluate the quality of bioresorbable vascular scaffold (BVS) implantation and determine the model’s usefulness in predicting adverse cardiac events.
Methods and results: The implantation technique and clinical outcomes of 1,736 lesions treated with BVS were analysed using the GHOST-EU registry. Predilation, scaffold sizing, and post-dilation (PSP) were scored according to the hazard model derived from the weight of these variables. The primary endpoint was a one-year device-oriented composite endpoint (DoCE) composed of cardiac death, target vessel myocardial infarction, and clinically driven target lesion revascularisation. Definite/probable scaffold thrombosis was also evaluated as defined by the Academic Research Consortium. The PSP model performance was evaluated by internal validation. Predilation, correct scaffold sizing, and post-dilation with a non-compliant balloon were performed in 95.7%, 50.2%, and 26.2% of the cases and scored 0.63, 1.96 and 1.93 points, respectively, in the PSP-1 model. PSP-1 was an independent predictor of one-year DoCE (HR 0.75, 95% CI: 0.61-0.93; p=0.007), but with poor calibration and discrimination (AUC 0.611, 95% CI: 0.545-0.677). No patient with a maximum PSP-1 score had scaffold thrombosis, compared to those with a non-maximum PSP-1 score (0% vs. 2.3%; p=0.095).
Conclusions: At one-year follow-up, the PSP-1 score was an independent predictor of DoCE. External validation and prospective studies are needed to determine the clinical usefulness of this score.
Abbreviations
BVS: bioresorbable vascular scaffolds
CD-TLR: clinically driven target lesion revascularisation
DES: drug-eluting stent
DoCE: device-oriented composite endpoint
MI: myocardial infarction
MLD: minimum lumen diameter
PCI: percutaneous coronary intervention
QCA: quantitative coronary angiography
RVD: reference vessel diameter
TV-MI: target vessel myocardial infarction
Introduction
Bioresorbable vascular scaffolds (BVS) have been proposed as the fourth revolution in interventional cardiology, designed to overcome the limitations of drug-eluting stents (DES)1. Despite apparent safety reported from initial clinical studies1,2, clinical registries and a recent meta-analysis have shown a high incidence of cardiac events3,4. A patient-level meta-analysis of the four main ABSORB randomised clinical trials showed a higher incidence of target vessel myocardial infarction (TV-MI) and thrombosis in the BVS than in the DES group, also reported in the three-year findings of the ABSORB II trial3,5.
Based on recent data suggesting that a suboptimal implantation technique may be associated with this increased event risk6, a European expert consensus has proposed a BVS-specific implantation protocol, emphasising the importance of proper lesion preparation, accurate vessel sizing and mandatory post-dilation7. The value of this BVS-specific implantation protocol, however, has not been supported by clinical data.
The objectives of the present study were to develop a scoring model to evaluate the quality of BVS implantation and determine the model’s usefulness in estimating adverse cardiac events.
Methods
STUDY DESIGN AND PATIENT POPULATION
The GHOST-EU (Gauging coronary Healing with biOresorbable Scaffolding plaTforms in EUrope) registry is an investigator-initiated, retrospective, multicentre registry involving 11 European centres. Details of the design, methods of data collection and definitions used have been reported elsewhere4. The registry included consecutive patients between November 2011 and January 2014 who underwent single or multivessel percutaneous cardiac intervention (PCI) with at least one of the current generation of everolimus-eluting BVS devices (Absorb BVS; Abbott Vascular, Santa Clara, CA, USA). All patients with coronary artery lesions suitable for stenting were eligible for recruitment to the registry.
PROCEDURES AND FOLLOW-UP
All interventions were performed according to current PCI guidelines. Balloon predilation was not mandatory but highly recommended. Scaffold implantation at a pressure not exceeding the burst pressure rate was mandatory. Use of post-dilation, intracoronary imaging guidance and choice of antithrombotic therapy were left to operator discretion. If post-dilation was performed, a non-compliant (NC) balloon was used. Each centre was free to guide BVS sizing by online quantitative coronary angiography (QCA), visual estimation or intravascular imaging, as preferred. Post hoc QCA data analysis was performed offline to qualify the adequacy of BVS sizing as correct or incorrect, based on the manufacturer’s instructions. The following QCA parameters were computed using commercially available software, as reported elsewhere8: minimum lumen diameter (MLD), reference vessel diameter (RVD) obtained by an interpolated method, and percent diameter stenosis9.
Clinical follow-up was obtained by clinical visit and/or telephone contact according to a schedule specific to each centre. Referring cardiologists and general practitioners were contacted whenever necessary for further information. There was no independent or external monitoring of data entry, core lab analysis or event adjudication. Source verification, quality control, and queries to the participating sites were mainly generated from the co-ordinating centre to account partly for the unavoidable bias of site-reported data collection and adjudication4.
MODEL SPECIFICATION
Overall, three steps of scaffold implantation were evaluated in the PSP model:
– Predilation (lesion preparation)
– Scaffold sizing
– Post-dilation
MODEL 1 (PSP-1):
– Predilation:
• Not performed
• Performed
– Scaffold sizing:
• Correct sizing, defined as the following:
implantation of a 2.5 mm diameter scaffold in a vessel with a proximal/distal RVD ≥2.5 mm and <2.75 mm;
implantation of a 3.0 mm diameter scaffold in a vessel with a proximal/distal RVD ≥2.75 mm and <3.25 mm; or
implantation of a 3.5 mm diameter scaffold in a vessel with a proximal/distal RVD ≥3.25 mm and ≤3.75 mm;
if proximal and distal RVD differed, mean value was used.
• Incorrect sizing.
– Post-dilation:
• Either not performed or performed with a balloon with diameter 0.5 mm greater than the scaffold diameter or performed with a NC balloon with a diameter less than or equal to the scaffold diameter.
• Performed with an NC balloon of larger diameter than the scaffold, up to a maximum of 0.5 mm.
MODEL 2 (PSP-2): model 1 + residual stenosis after predilation by QCA, as follows:
– Predilation:
Either not performed or performed with a QCA residual stenosis ≥30%.
Performed with a QCA residual stenosis <30%.
MODEL 3 (PSP-3): model 1 + maximum pressure of post-dilation, as follows:
– Post-dilation:
Either not performed or performed with a balloon with diameter 0.5 mm greater than the scaffold diameter or performed with a NC balloon with a diameter less than or equal to the scaffold diameter at a pressure <16 atmospheres.
Performed with a NC balloon of larger diameter than the scaffold, up to a maximum of 0.5 mm and at a pressure ≥16 atmospheres.
OUTCOMES AND DEFINITIONS
The endpoints considered in this analysis are those reported in the GHOST-EU registry4,10. The primary endpoint was the device-oriented composite endpoint (DoCE) of cardiac death, TV-MI, and clinically driven target lesion revascularisation (CD-TLR). Secondary outcomes were the individual components of the primary endpoint and scaffold thrombosis, defined according to Academic Research Consortium (ARC) criteria10. Myocardial infarction (MI) was defined according to the third universal definition11. Deaths that could not be attributed to another cause were regarded as cardiac deaths. Endpoints were analysed at one-year follow-up4. Optimal BVS implantation was coded as the maximum PSP-model score.
STATISTICAL ANALYSIS
Continuous variables are presented as mean±standard deviation or median and interquartile range (IQR), as appropriate. Categorical variables are reported as absolute numbers and percentages. Differences in proportions were tested with chi-square or Fisher’s exact tests and differences in continuous variables were tested with the Student’s t-test.
The weights of all the variables entered in the PSP-score models were derived by hazard ratios (HR) from a logistic regression model, with DoCE as dependent variable and the three implantation steps, properly coded, as independent variables. The three PSP models were evaluated in terms of overall performance, calibration and discrimination, as previously shown12. Overall performance of the models was defined as the variation explained by the model, assessed by Nagelkerke’s R2 with a maximum value of 1 and minimum of 012. Calibration, defined as the degree of correspondence between the estimated probabilities produced by a model and the actual observation, was measured by the Hosmer-Lemeshow test: the lower the statistic and higher the p-values, the more calibrated is the score12. Discrimination is the probability that the score will assign higher risk values to patients who eventually experience events compared to those who do not, and was measured with the area under the receiver-operating characteristic curves (AUCs). The AUC values range from 0.50 (no discrimination) to 1.0 (perfect discrimination)12.
Score derivation and validation were performed in line with the published TRIPOD statement for transparent reporting of a multivariable prediction model for individual prognosis or diagnosis13. Internal validation (TRIPOD type 1b) was performed using the “bootstrapping” resampling technique (1,000 replications)13.
To assess potential bias due to differences in baseline characteristics within each PSP model, a propensity score was built from a logistic regression model (with DoCE as outcome) and used for adjustment. Results were reported as HR with associated 95% confidence interval (95% CI) and p-value. Eventually, PSP models were applied to the same development population (step 7 of model development)14. A Kaplan-Meier method was used to derive the event rates at follow-up and to plot time-to-event curves, dividing the population according to the maximum score of the PSP models, coded as the maximum score vs. non-maximum score. Kaplan-Meier curves were corrected for the propensity score and compared by log-rank test.
A two-tailed probability value <0.05 was considered significant. All data were processed using the Statistical Package for Social Sciences, Version 22 (IBM Corp., Armonk, NY, USA).
Results
POPULATION
A total of 1,477 patients were included in the GHOST-EU registry. Baseline clinical and procedural characteristics have been previously reported8.
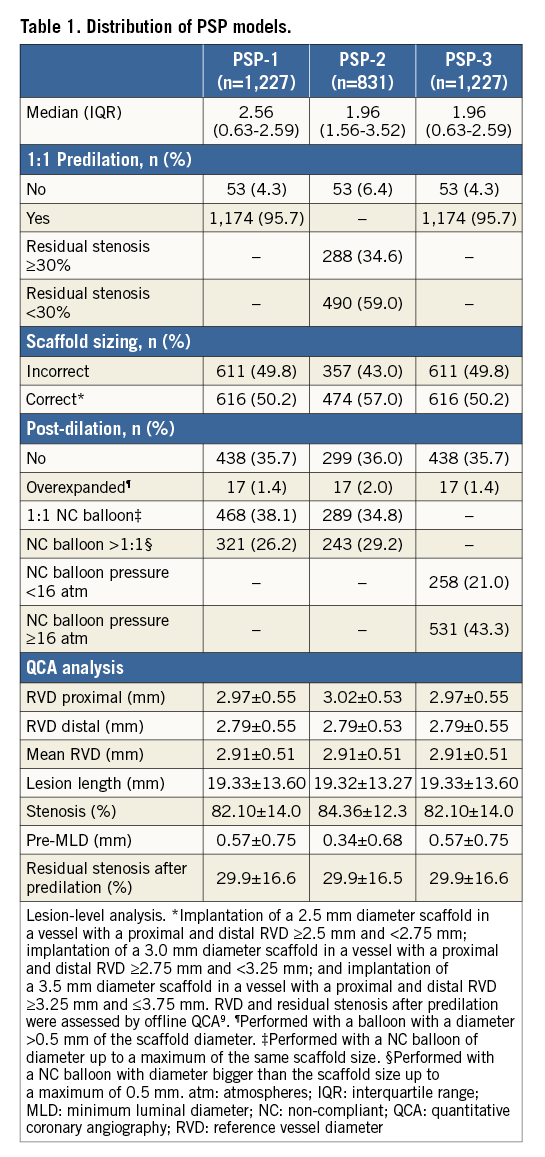
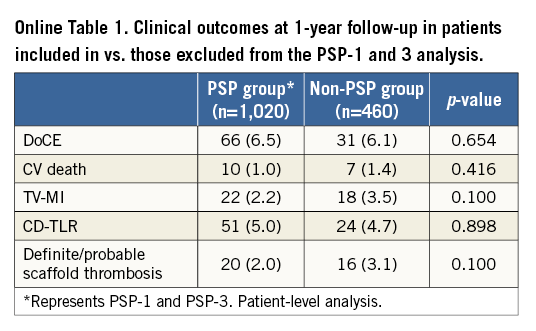
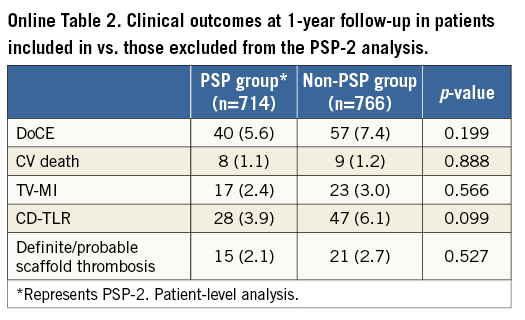
Due to missing data, a total of 1,227 lesions (1,020 patients) were included in the PSP-1 model, 831 lesions (714 patients) in the PSP-2 model, and 1,227 lesions (1,020 patients) in the PSP-3 model (Table 1). There were no significant differences at baseline or in DoCE between the patients included in vs. those excluded from the PSP models (Online Table 1, Online Table 2).
MODEL DEVELOPMENT AND VALIDATION
Each implantation step was scored by applying hazard models to the DoCE. Three different models of PSP score were developed. The weights of HRs for each step of each model are shown in Figure 1A.
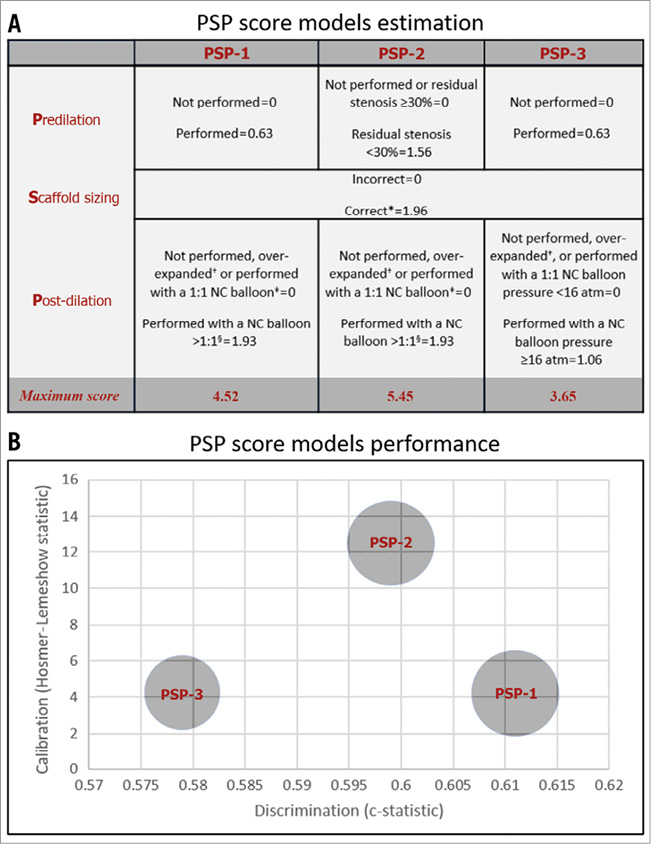
Figure 1. PSP-score models estimation and performance. A) *Implantation of a 2.5 mm diameter scaffold in a vessel with a proximal and distal RVD ≥2.5 mm and <2.75 mm; implantation of a 3.0 mm diameter scaffold in a vessel with a proximal and distal RVD ≥2.75 mm and <3.25 mm; and implantation of a 3.5 mm diameter scaffold in a vessel with a proximal and distal RVD ≥3.25 mm and ≤3.75 mm. RVD and residual stenosis after predilation were assessed by offline QCA9. +Performed with a balloon with a diameter >0.5 mm of the scaffold diameter. ‡Performed with a NC balloon of diameter up to a maximum of the same scaffold size. §Performed with a NC balloon with diameter bigger than the scaffold size up to a maximum of 0.5 mm. atm: atmospheres; NC: non-compliant; QCA: quantitative coronary angiography; RVD: reference vessel diameter B) PSP-1: R2: 0.04, HL: X2=4.19 (0.758), and AUCs: 0.611 (0.545-0.677). PSP-2: R2: 0.04, HL: X2=12.50 (0.130), and AUCs: 0.599 (0.536-0.663). PSP-3: R2: 0.03, HL: X2=4.23 (0.836), and AUCs: 0.579 (0.509-0.650). R2: Nagelkerke’s R2; HL: Hosmer-Lemeshow (p-value); and AUCs: area under the receiver-operating characteristic curve (95% confidence interval).
The performance of all the models in terms of overall discrimination and calibration is shown in Figure 1B. The best overall performance according to Nagelkerke’s R2 value was displayed by the PSP-1 and PSP-2 scores (0.04). The PSP-1 model had the best calibration (X2=4.19, p=0.758 by Hosmer-Lemeshow statistic) and discrimination (AUCs 0.611 [95% CI: 0.545-0.677]). The discrimination of the PSP-2 was similar to the PSP-1, whereas the PSP-3 had lower discrimination (Figure 1B).
In the internal validation, the PSP models were independent predictors of DoCE: PSP-1: HR -0.307, 95% CI bias-corrected (-0.516 to -0.111; p=0.007), PSP-2: HR -0.250, 95% CI bias-corrected (-0.434 to -0.091; p=0.008), and PSP-3: HR -0.274, 95% CI bias-corrected (-0.496 to -0.059; p=0.020).
PSP-SCORE MODELS FOR PROGNOSTIC STRATIFICATION
The one-year DoCE rate was higher in patients with non-maximum PSP scores, compared to those with maximum PSP score, mainly driven by a higher incidence of MI (Table 2). Figure 2A-Figure 2C show the Kaplan-Meier curves for DoCE in the three PSP models. Within the PSP-1 model, significantly fewer patients with maximum PSP score had DoCE (1.5% vs. 7.4%, p=0.037), and this patient group also had fewer cases of definite/probable scaffold thrombosis (0% vs. 2.3%, p=0.095) compared to those with non-maximum PSP scores (Table 2, Figure 2A-Figure 2C). 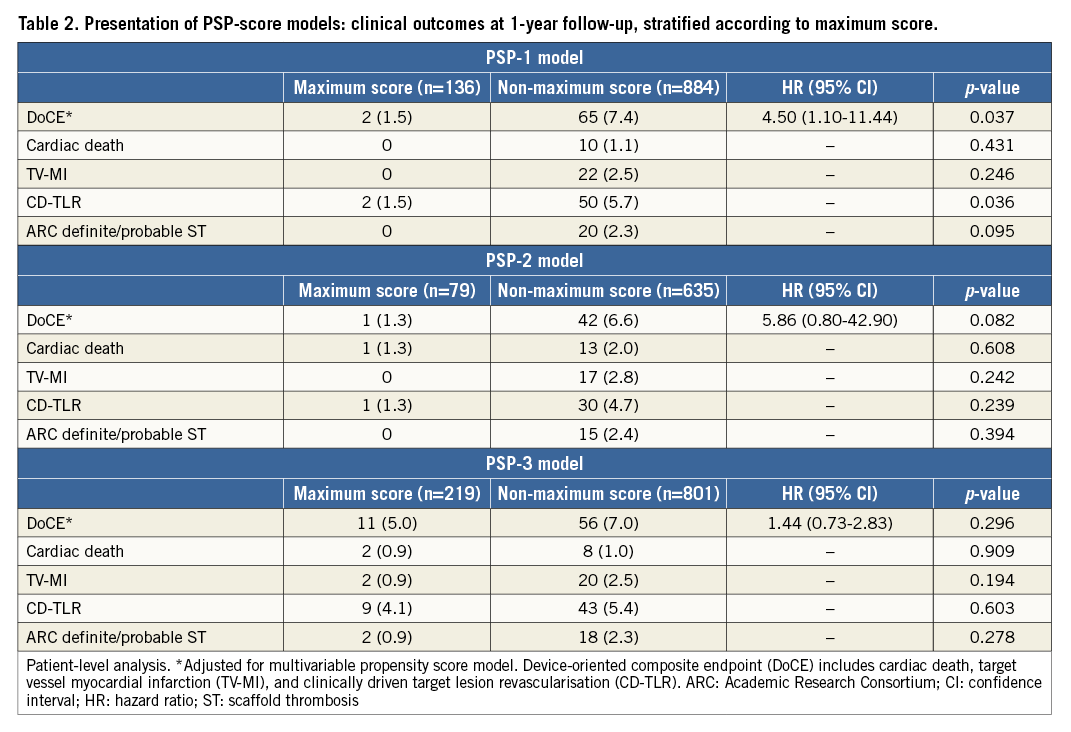
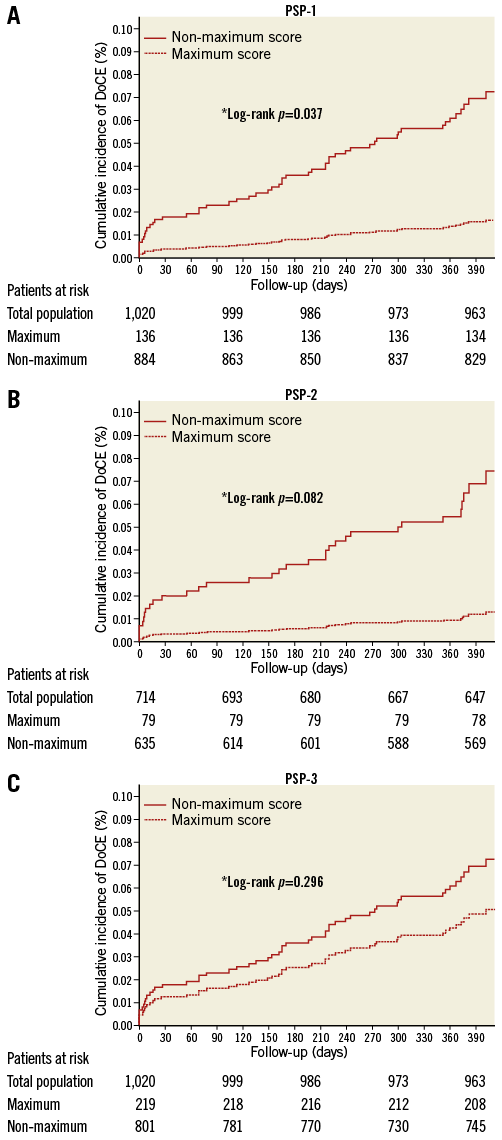
Figure 2. Presentation of PSP-score models: Kaplan-Meier curves. Patient-level analysis. *Adjusted for multivariable propensity score model. Device-oriented composite endpoint (DoCE) includes cardiac death, target vessel MI (TV-MI), and clinically driven target lesion revascularisation (CD-TLR).
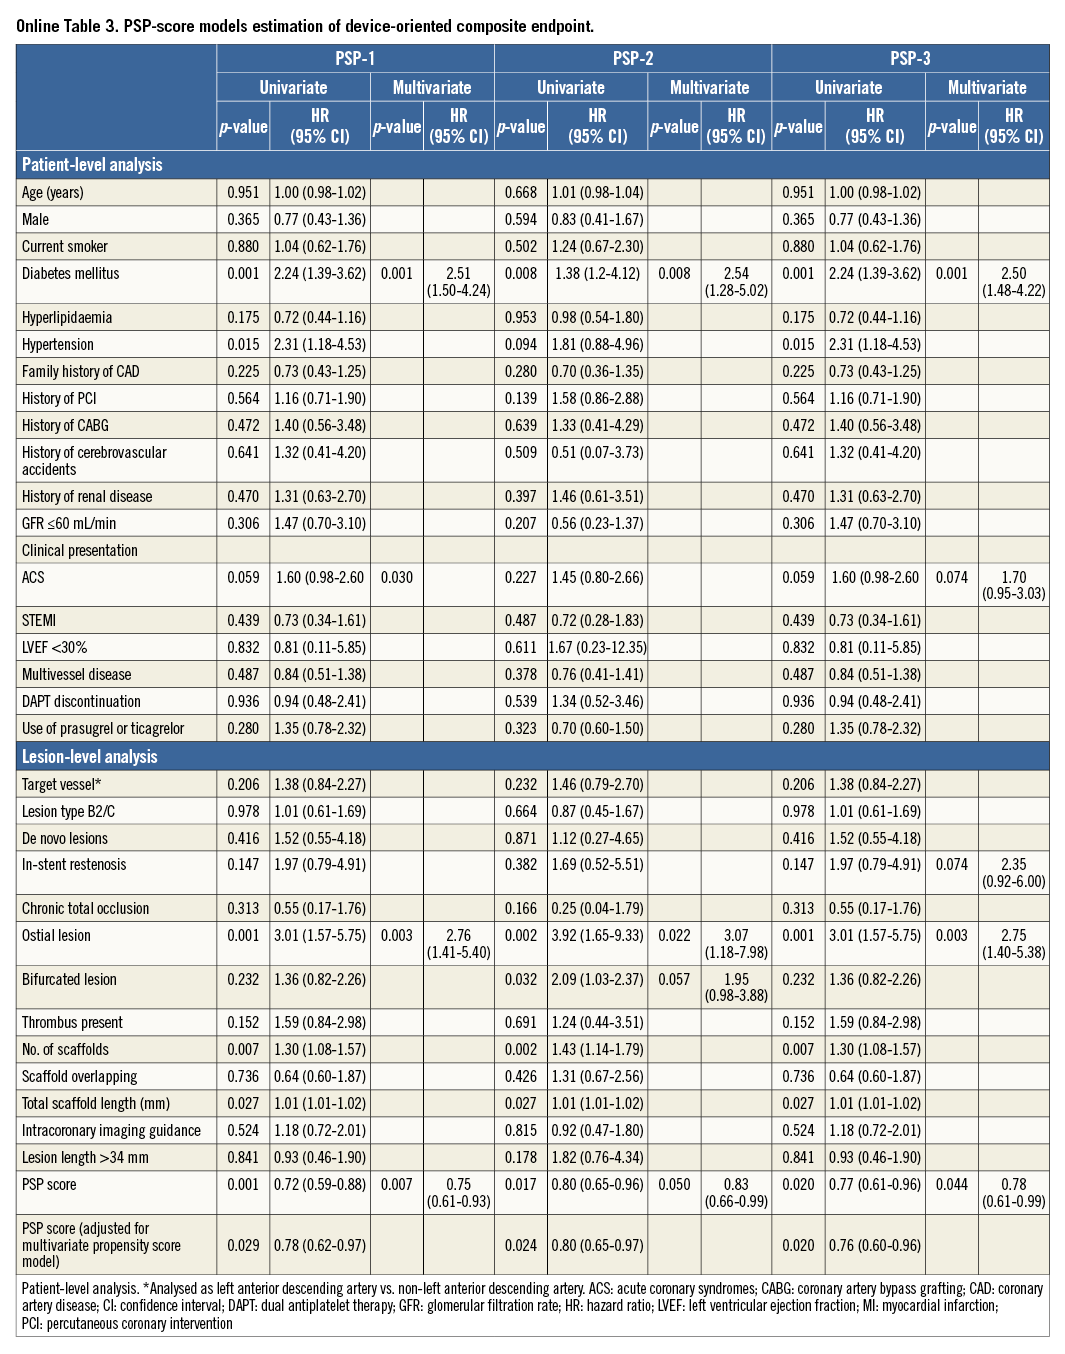
In the multivariate analysis, all the PSP models independently predicted DoCE (PSP-1: HR 0.75, 95% CI: 0.61-0.93; p=0.007, PSP-2: HR 0.83, 95% CI: 0.66-0.99; p=0.050, and PSP-3: HR 0.78, 95% CI: 0.61-0.99; p=0.044), even after adjustment for propensity score (PSP-1: HR 0.78, 95% CI: 0.62-0.97; p=0.029, PSP 2: HR 0.80, 95% CI: 0.65-0.96; p=0.017, and PSP-3: HR 0.76, 95% CI: 0.60-0.96; p=0.020) (Online Table 3).
Discussion
The main findings of our study are: 1) optimisation of BVS implantation can be simply quantified in a score model; 2) in both model estimation and internal validation, these score models independently predicted DoCE, but had poor discrimination and calibration at one-year follow-up; 3) patients with maximum PSP score exhibited a lower rate of events, mainly driven by a lower rate of MI, compared to patients with a non-maximum PSP score.
When BVS were first introduced, it seemed clear that these devices should be implanted following specific guidelines. In contrast to metallic stents, they aimed to scaffold rather than stretch plaque (i.e., by barotrauma); adequate lesion preparation was therefore required. Correct vessel sizing was also crucial because of limited expansion. Last but not least, as for first-generation thick-strut DES, post-dilation was a way to optimise the implantation further7. Despite these recommendations, quantifying the quality of BVS implantation remains an unmet clinical need.
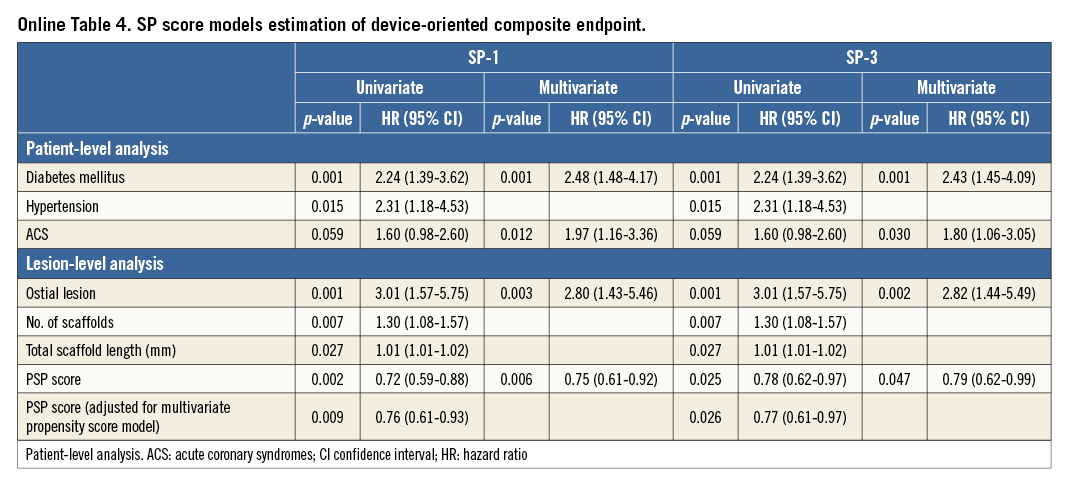
The present study explored the possibility of quantifying each of these three steps. Predilation was analysed as a binary variable (either performed or not performed) or by taking into account the QCA residual stenosis as an index of adequate lesion preparation. Notably, >95% of the GHOST cohort received predilation; therefore, use of a simplified (SP) score did not affect predictive value (Online Table 4, Online Figure 1).
The weight of post-dilation was also explored using two different approaches, maximum pressure and the sizing of the post-dilation balloon. Pressure >16 atmospheres did not add value as compared to post-dilation with a balloon with a larger diameter than the implanted BVS, up to a maximum of 0.5 mm.
Correct scaffold sizing is of utmost importance. The ABSORB III trial showed a higher incidence of thrombosis in vessels with a QCA RVD <2.25 mm compared to larger vessels2,15. Based on this result, the manufacturer has changed its vessel size recommendation, with BVS implantation in vessels ≤2.5 mm. Our analysis took this new recommendation into account, finding that almost 50% of the BVS implantations did not consider vessel sizing by QCA. This discrepancy between QCA and scaffold sizing confirmed the results of previous studies16. This observation, together with the weight given to sizing by hazard models in our analysis, further reinforces the idea that sizing is very important at the moment of BVS implantation; at the least, use of online QCA should be stressed by any interventional cardiologist6,7. The impact of correct scaffold sizing on the need for post-dilation was not assessed in our study and should be analysed in future studies. Based on manufacturers’ instructions, high-pressure post-dilation with a NC balloon –not exceeding scaffold thresholds– is strongly recommended to improve strut apposition and blood flow7.
Our analysis showed that the PSP score independently predicts DoCE; in particular, optimal BVS implantation, coded as the maximum score, was associated with a low rate of events. A previous report has shown that the one-year incidence of scaffold thrombosis could be reduced by use of an optimised implantation strategy6. Our analysis extends this observation from scaffold thrombosis to a device-oriented endpoint, quantifying each implantation step in a scoring model. Diabetes, acute coronary syndromes and ostial lesion location were other independent predictors of events in the model, as expected and as previously shown for metallic and for bioresorbable devices8.
Overall, each PSP-score model exhibited greater discrimination (AUC) than each individual step of the implantation technique (data not shown). Our score may have important clinical applications in daily practice, if its predictive ability can be confirmed in future studies.
The present study considered one-year follow-up data; longer-term follow-up is needed to validate the PSP-score models, especially considering the higher than expected very late events rate observed in the ABSORB II trial at three-year follow-up5. Validation in specific clinical scenarios in which the implantation technique may differ, such as ST-segment elevation myocardial infarction or chronic total occlusion, is also needed.
Limitations
This study has several limitations. First, the GHOST-EU is a retrospective registry; therefore, the data regarding clinical and procedural characteristics were not prospectively collected. Second, this registry lacked a central independent angiographic core lab and independent clinical events committee. Third, no post-procedural final QCA data were available. Fourth, data regarding the balloon size used for predilation were missing; however, as all the GHOST-EU centres are high-volume centres for ABSORB implantation, NC balloons with 1:1 size are always used. As the PSP score was developed in a derivation cohort and was internally validated, it will eventually require validation in an external population in order to determine its clinical value not only in BVS but also in metallic stent implantation.
Conclusions
The PSP score is a simple model for critical assessment of the quality of BVS implantation technique, being an independent predictor of one-year DoCE with poor discrimination and calibration. External validation and prospective studies are mandatory to determine the clinical utility of this score.
| Impact on daily practice The PSP score is a simple scoring model designed to be used in daily clinical practice with the objective of assessing scaffold implantation technique and identifying patients at high risk of adverse cardiac events; all the PSP models tested were independent predictors of DoCE at one-year follow-up. Regarding the quality of BVS implantation, patients with a maximum PSP-1 value had a significantly lower rate of DoCE, compared to those with a non-maximum value. Prospective studies are needed to confirm these results, further validate the predictive capacity of the PSP-score models, improve their quality, and determine their clinical value. |
Conflict of interest statement
The authors have no conflicts of interest to declare.
Supplementary data
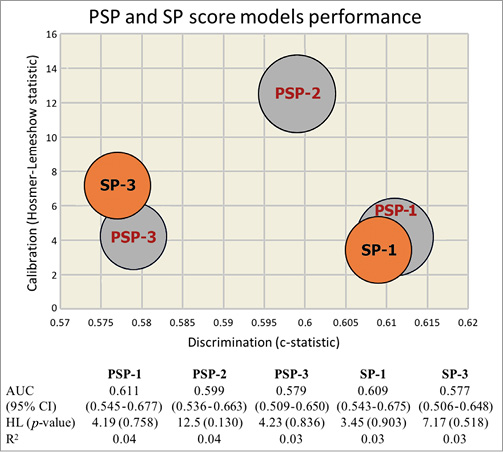
Online Figure 1. PSP and SP score models estimation and performance. AUC: area under the receiver-operating characteristic curve (95% confidence interval); HL: Hosmer-Lemeshow (p-value); R2: Nagelkerke’s R2
