Abstract
Background: Evidence of prognostic factors for stent failure after drug-eluting stent implantation for calcified nodules (CNs) is limited.
Aims: We aimed to clarify the prognostic risk factors associated with stent failure among patients who underwent drug-eluting stent implantation for CN lesions using optical coherence tomography (OCT).
Methods: This retrospective, multicentre, observational study included 108 consecutive patients with CNs who underwent OCT-guided percutaneous coronary intervention (PCI). To evaluate the quality of CNs, we measured their signal intensity and analysed the degree of signal attenuation. All CN lesions were divided into dark or bright CNs according to the half width of signal attenuation, greater or lower than 332, respectively.
Results: During the median follow-up period of 523 days, 25 patients (23.1%) experienced target lesion revascularisation (TLR). The 5-year cumulative incidence of TLR was 32.6%. Multivariable Cox regression analysis revealed that younger age, haemodialysis, eruptive CNs, dark CNs assessed by pre-PCI OCT, disrupted fibrous tissue protrusions, and irregular protrusions assessed by post-PCI OCT were independently associated with TLR. The prevalence of in-stent CNs (IS-CNs) observed at follow-up OCT was significantly higher in the TLR group than in the non-TLR group.
Conclusions: Factors such as younger age, haemodialysis, eruptive CNs, dark CNs, disrupted fibrous tissue, or irregular protrusions were independently related to TLR in patients with CNs. The high prevalence of IS-CNs might indicate that the main cause of stent failure implanted in CN lesions could be the recurrence of CN progression in the stented segment.
Introduction
As the population ages, the frequency of percutaneous coronary intervention (PCI) for patients with coronary artery calcification (CAC) is increasing1. PCI for CAC is associated not only with procedural problems but with subsequent poor prognosis. Thus, PCI for calcified lesions remains an unsolved clinical issue, even in the era of new-generation drug-eluting stents (DES)234.
Among various types of CAC, recent studies have demonstrated that calcified nodules (CNs), defined as calcified plaques protruding into the lumen, have one of the poorest prognoses and are associated with major adverse cardiac events (MACE) in patients with coronary artery disease (CAD)5678. However, only limited data are reported on the poor prognosis of CNs, making it difficult to predict the corresponding prognosis after DES implantation for CN lesions.
Optical coherence tomography (OCT) devices offer high-resolution imaging that enables more accurate quantitative and qualitative assessments of intracoronary findings than intravascular ultrasound9. We speculated that OCT could have the potential to reveal some of the characteristics related to the prognosis of CN lesions after DES implantation. Thus, this study aimed to clarify the prognostic factors associated with stent failure among patients who undergo DES implantation for CN lesions using OCT.
Methods
Study design
In this retrospective, multicentre, observational study, consecutive CAD patients who had undergone PCI at four institutions (Kobe University Hospital, Osaka Saiseikai Nakatsu Hospital, Hyogo Prefectural Awaji Medical Centre, and Hyogo Prefectural Himeji Cardiovascular Centre) were enrolled. The inclusion criteria were (1) patients who had undergone OCT-guided PCI from August 2013 to October 2020; (2) patients whose culprit lesion had CN detected by pre-PCI OCT; and (3) patients ≥20 years old. CNs were defined as high-backscattering masses protruding into the lumen adjacent to calcified plaques, seen as poor signal regions with sharply delineated borders on OCT. The exclusion criteria were (1) patients who had not been implanted with DES (i.e., those treated with drug-coated balloon [DCB] and those treated with percutaneous old balloon angioplasty [POBA] or rotational atherectomy [RA] alone); (2) those with in-stent restenosis; (3) those with coronary artery bypass grafted lesions; (4) those with missing data; (5) those with insufficient OCT data quality; and (6) those who had died within a year after the index PCI. This study protocol complied with the Declaration of Helsinki and was approved by the ethics committee of Kobe University Hospital. Informed consent was obtained in the form of an opt-out on the website of the Division of Cardiovascular Medicine, Kobe University Graduate School of Medicine. This study was registered in the University Hospital Medical Information Network Clinical Trial Registry (UMIN 000048490).
OCT image analysis and definitions
We retrospectively collected OCT images obtained with a frequency-domain OCT (ILUMIEN; Abbott Vascular) or an optical domain frequencing system (OFDI; LUNAWAVE; Terumo) pre-PCI and immediately after the index PCI. If patients received follow-up OCT examinations, the OCT images were also analysed. Follow-up OCT was performed at the physician’s discretion. Offline OCT analysis was performed using dedicated software (LightLab Imaging Inc. and LUNAWAVE Offline Viewer; Terumo) by independent observers blinded to the clinical presentations and lesion characteristics of the patient. For quantitative analysis, cross-sectional OCT images were analysed at 1 mm intervals.
As a qualitative analysis of pre-PCI OCT, we classified CNs into eruptive CNs (ECNs) or calcified protrusions (CPs) (Figure 1A, Figure 1B). ECNs were defined as high-backscattering masses protruding into the lumen with an irregular surface, and CPs were defined as protruding calcific masses with a smooth surface6. We classified the CN as an ECN if it had a significant surface irregularity on at least one OCT cross-section, whereas other CNs were classified as CPs. Regarding the qualitative analysis of post-PCI OCT images, we evaluated stent edge dissection, incomplete stent apposition, and in-stent protrusion (smooth, disrupted fibrous tissue, and irregular) (Figure 1C-Figure 1G). Detailed OCT analysis is described in Supplementary Appendix 1.
We evaluated the presence of in-stent CNs (IS-CNs) on follow-up OCT images. IS-CNs were defined as neointimal tissues that appeared as high-backscattering masses protruding into the lumen with an irregular surface (Figure 1H)10. We further examined whether the IS-CN was located within 5 mm of the CN observed on the index PCI. All qualitative analyses were conducted based on every frame analysis.
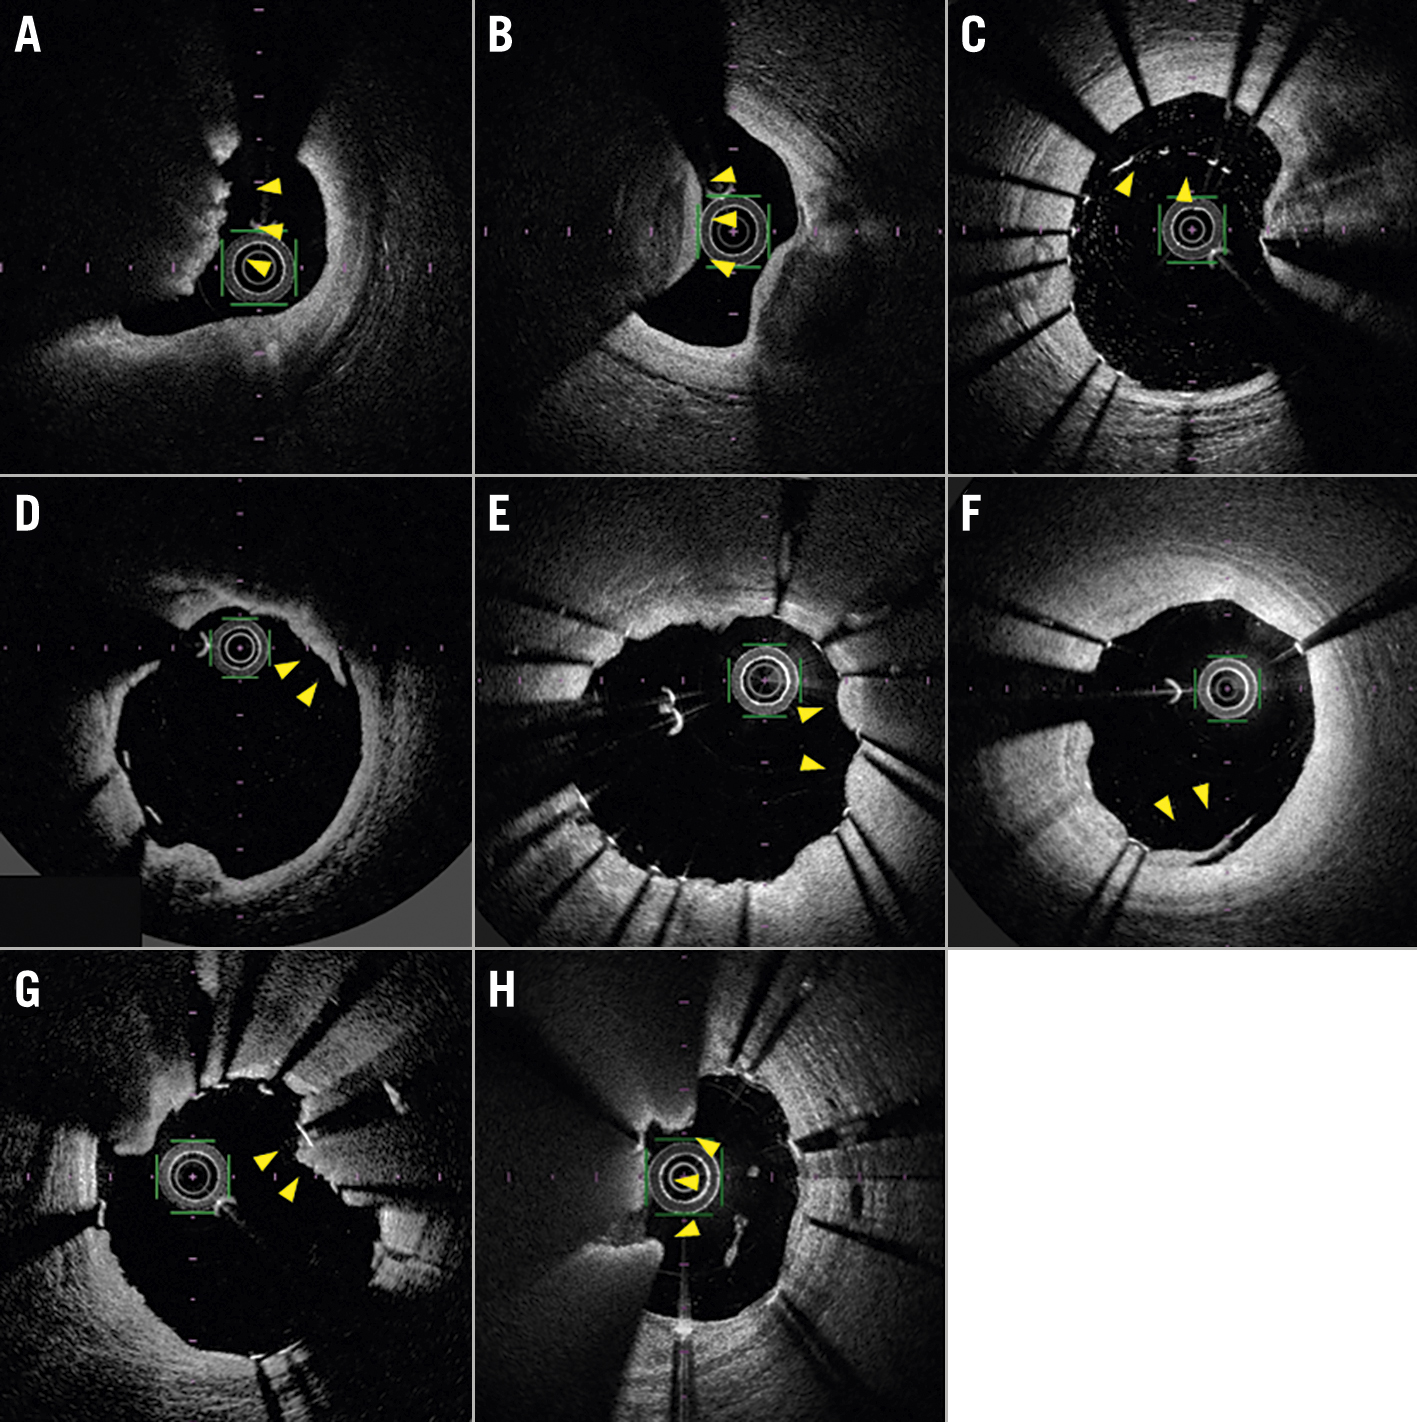
Figure 1. Representative optical coherence tomography (OCT) images. A) An eruptive calcified nodule (ECN) characterised by the expulsion of a cluster of small calcified nodules into the lumen (arrowheads). B) A calcified protrusion (CP) characterised by a protruding calcific mass without small eruptive calcific nodules (arrowheads). C) Incomplete stent apposition (arrowheads). D) Stent edge dissection (arrowheads). E) Smooth protrusion (arrowheads). F) Disrupted fibrous tissue protrusion (arrowheads). G) Irregular protrusion (arrowheads). H) An in-stent calcified nodule (IS-CN) (arrowheads).
Quantitative evaluation of signal attenuation of CN
For the qualitative evaluation of CNs, we analysed the degrees of signal attenuation, referring to a previous study on coronary arterial thrombus11. First, we selected five cross-sections: one within, two proximal, and two distal to the lesion of interest, with the largest CN in the middle. Then, on each cross-section, signal intensity was measured from the centre of the OCT catheter in the direction of the CN (Figure 2A). Since the signal intensity of CNs gradually decreases from the surface to the inside, they can be analysed by fitting the signal intensity curve to a single exponential function (y =Ae−0.693x/Dh, where A is the peak intensity and Dh is the half width, defined as the distance from the peak intensity to its 1/2 intensity) (Figure 2B). Moreover, signal attenuations were measured clockwise in the range of 5 degrees forwards and backwards from the centre of the CN for each cross-section (Figure 2C). Finally, the median of all values of the half width were taken as representative of the CN for a given case.
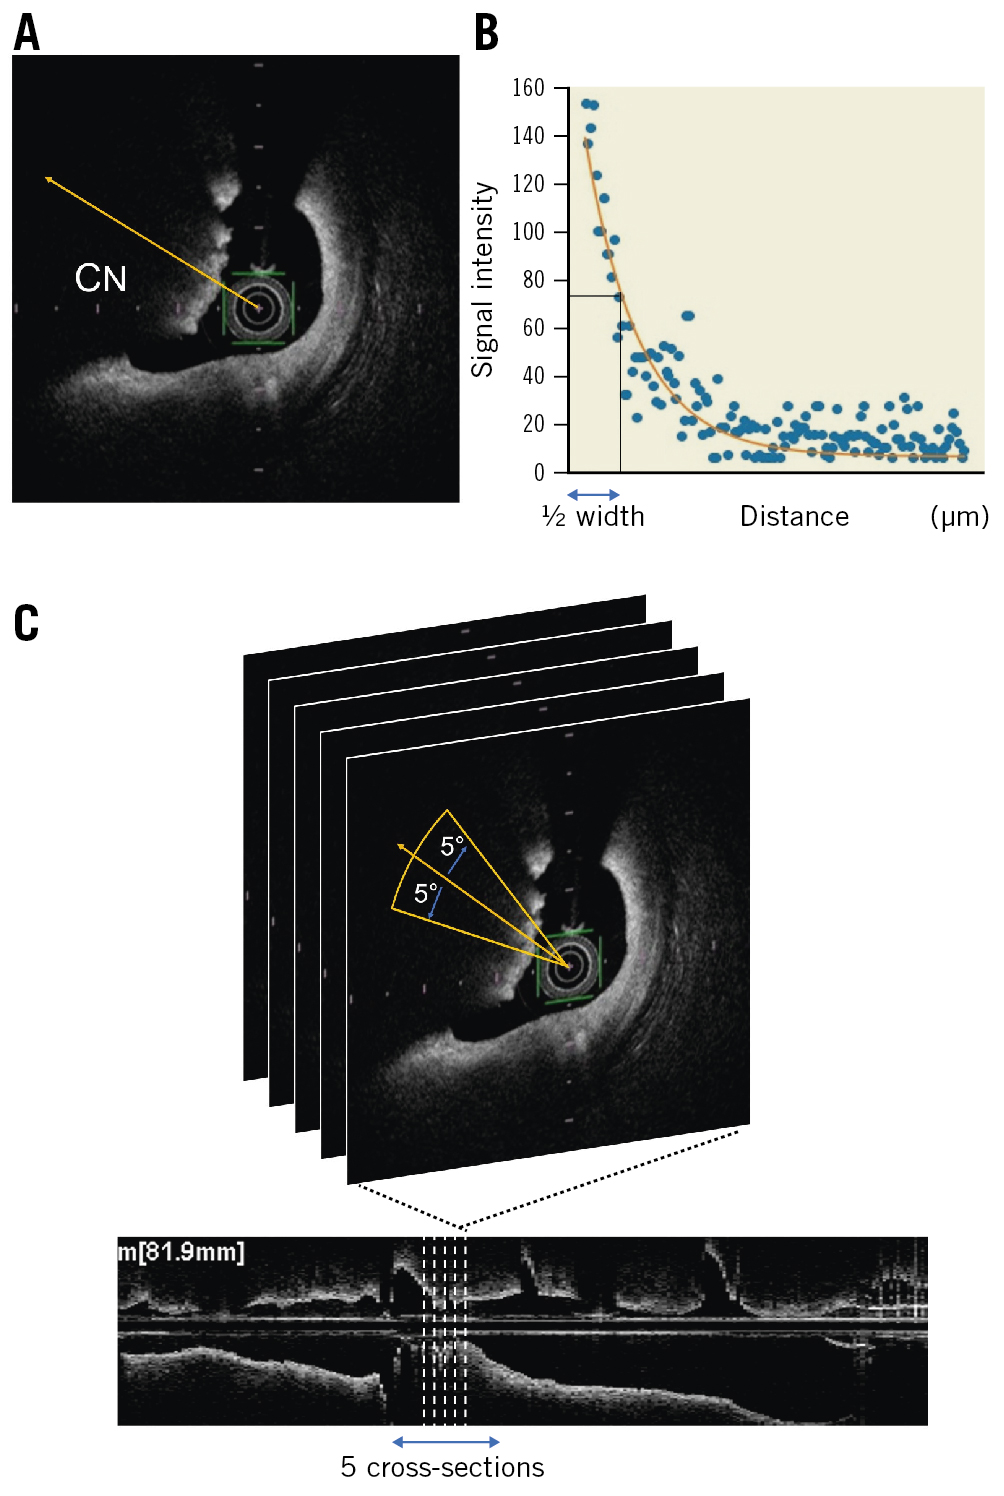
Figure 2. Characteristics of a calcified nodule. A) Signal intensity was measured from the centre of the OCT catheter in the direction of the CN. B) The signal intensity of the CN was analysed by fitting the signal intensity curve to a single exponential function (y =Ae−0.693x/Dh, where A is the peak intensity and Dh is the half width, which was defined as the distance from the peak intensity to its 1/2 intensity). C) Five cross-sectional images were measured, one within, two proximal, and two distal to the lesion of interest. Moreover, signal attenuations were clockwise and measured in the range of 5 degrees forwards and backwards from the centre of the CN for each single cross-section image. CN: calcified nodule; OCT: optical coherence tomography
Outcomes
The primary outcome was target lesion revascularisation (TLR). TLR was defined as a repeated PCI or repeated coronary artery bypass graft of the target lesion. Cardiovascular events were ascertained from a review of medical records and confirmed by direct contact with the patients, families, or physicians. Details of the statistical analyses are described in Supplementary Appendix 2.
Results
Study population
Of 204 patients with CNs who underwent OCT-guided PCI from August 2013 to October 2020, 52 patients treated with DCB, 5 patients treated with POBA or RA alone, 20 patients with missing data, 5 patients with insufficient OCT data quality, and 14 patients who died within a year after PCI were excluded. Finally, 108 patients were enrolled and analysed (Supplementary Figure 1). Among them, 23 patients (21.3%) presented with acute coronary syndrome (ACS).
During the median follow-up period of 523 (interquartile range [IQR] 318-1,321) days, 25 patients (23.1%) experienced TLR. Among all patients, 19 with TLR and 32 without TLR underwent a follow-up OCT examination (Supplementary Figure 1). The median duration from the index procedure to the follow-up OCT examination was 315 (IQR 214-369) days. The overall cumulative 5-year incidence of TLR in patients with CNs was 32.6%.
Comparisons of baseline and lesion characteristics between the TLR and non-TLR groups
Table 1 shows the baseline patient and lesion characteristics of the TLR and non-TLR groups. The TLR group was significantly younger, had a higher prevalence of diabetes mellitus and haemodialysis, had higher serum creatinine and blood urea nitrogen levels, and had numerically higher serum phosphorus and brain natriuretic peptide levels. TLR lesions were more frequently observed in proximal lesions and the right coronary artery or the left main trunk. Patients in the TLR group had significantly larger stent diameters than those in the non-TLR group. Left ventricular ejection fraction, medications at discharge, use of RA or orbital atherectomy, burr to lumen ratio, and stent types were similar between the two groups (Table 1). Comparisons of baseline and lesion characteristics between ECNs and CPs are described in Supplementary Appendix 3 and Supplementary Table 1.
Table 1. Baseline and lesion characteristics.
| TLR (+) N=25 | TLR (-) N=83 | p-value | ||
|---|---|---|---|---|
| Age, yrs | 67.1±8.0 | 73.7±9.3 | 0.002 | |
| Male | 20 (80.0) | 55 (66.3) | 0.19 | |
| BMI, kg/m2 | 25.1±3.6 | 23.7±4.3 | 0.16 | |
| Hypertension | 18 (72.0) | 64 (77.1) | 0.60 | |
| Diabetes mellitus | 21 (84.0) | 50 (60.2) | 0.03 | |
| Dyslipidaemia | 16 (64.0) | 46 (55.4) | 0.45 | |
| Haemodialysis | 13 (52.0) | 15 (18.1) | <0.001 | |
| Smokers | 4 (16.0) | 12 (14.5) | 0.85 | |
| Prior MI | 7 (28.0) | 12 (14.5) | 0.12 | |
| Prior stents | 14 (56.0) | 36 (43.4) | 0.27 | |
| Cerebrovascular disease | 2 (8.0) | 14 (16.9) | 0.28 | |
| Peripheral artery disease | 9 (36.0) | 21 (25.3) | 0.30 | |
| Clinical presentation | CCS | 19 (76.0) | 66 (79.5) | 0.71 |
| ACS | 6 (24.0) | 17 (20.5) | ||
| Laboratory findings | Cre, mg/dL | 5.04±4.78 | 2.15±2.84 | <0.001 |
| BUN, mg/dL | 30.7±22.0 | 23.1±14.6 | 0.046 | |
| eGFR, mL/min/1.73 m2 | 36.5±32.7 | 54.1±29.5 | 0.01 | |
| HDL-Chol, mg/dL | 50.6±13.8 | 48.7±11.3 | 0.49 | |
| LDL-Chol, mg/dL | 88.7±25.7 | 87.3±28.1 | 0.83 | |
| TG, mg/dL | 118.8±43.0 | 119.2±65.3 | 0.97 | |
| HbA1c, % | 6.6±1.0 | 6.5±1.0 | 0.78 | |
| Ca, mg/dL | 9.1±0.4 | 9.2±0.6 | 0.32 | |
| P, mg/dL | 4.7±1.5 | 4.0±1.3 | 0.10 | |
| BNP, pg/mL | 161.8 (39.1-726.7) | 99.2 (39.3-286.8) | 0.13 | |
| LVEF, % | 53.6±12.8 | 56.4±12.3 | 0.33 | |
| Medication | Aspirin | 25 (100.0) | 82 (98.8) | 0.58 |
| Clopidogrel | 9 (36.0) | 29 (34.9) | 0.92 | |
| Prasugrel | 16 (64.0) | 54 (65.1) | 0.92 | |
| Warfarin | 1 (4.0) | 0 (0.0) | 0.07 | |
| OAC | 2 (8.0) | 3 (3.6) | 0.36 | |
| ACEi/ARB | 14 (56.0) | 54 (65.1) | 0.41 | |
| Beta blocker | 18 (72.0) | 51 (61.4) | 0.34 | |
| Statin | 17 (68.0) | 63 (75.9) | 0.43 | |
| Insulin | 8 (32.0) | 14 (16.9) | 0.10 | |
| Oral hypoglycaemic agents | 10 (40.0) | 40 (48.2) | 0.47 | |
| Target lesion | RCA | 13 (52.0) | 36 (43.4) | 0.02 |
| LAD | 5 (20.0) | 35 (42.2) | ||
| LCx | 5 (20.0) | 12 (14.5) | ||
| LMT | 2 (8.0) | 0 (0.0) | ||
| Lesion | Proximal | 17 (68.0) | 40 (48.2) | 0.06 |
| Mid | 8 (32.0) | 40 (48.2) | ||
| Distal | 0 (0.0) | 3 (3.6) | ||
| Use of RA | 22 (88.0) | 60 (72.3) | 0.11 | |
| Use of OA | 1 (4.0) | 2 (2.4) | 0.67 | |
| Stent diameter, mm | 3.39±0.37 | 3.14±0.47 | 0.02 | |
| Stent length, mm | 23.7±8.9 | 25.6±9.2 | 0.36 | |
| Stent type | EES | 16 (64.0) | 51 (62.2) | 0.83 |
| ZES | 3 (12.0) | 14 (17.1) | ||
| SES | 4 (16.0) | 13 (15.9) | ||
| BES | 2 (8.0) | 4 (4.9) | ||
| Multiple stents | 10 (40.0) | 27 (32.5) | 0.49 | |
| Bifurcation lesion | 6 (24.0) | 27 (32.5) | 0.38 | |
| Pre-balloon diameter, mm | 2.97±0.47 | 2.75±0.48 | 0.06 | |
| Post-balloon diameter, mm | 3.48±0.41 | 3.59±1.52 | 0.80 | |
| Max rota burr size, mm | 1.81±0.24 | 1.73±0.28 | 0.20 | |
| Burr to lumen ratio | 0.77±0.14 | 0.77±0.16 | 0.88 | |
| Values are expressed as mean±standard deviation, median (interquartile range) or n (%). ACEi: angiotensin-converting enzyme inhibitor; ACS: acute coronary syndrome; ARB: angiotensin receptor blocker; BES: biolimus-eluting stent; BMI: body mass index; BNP: brain natriuretic peptide hormone; BUN: blood urea nitrogen; Ca: calcium; CCS: chronic coronary syndrome; Cre: creatinine; EES: everolimus-eluting stent; eGFR: estimated glomerular filtration rate; HbA1c: haemoglobin A1c; HDL-Chol: high-density lipoprotein cholesterol; LAD: left anterior descending artery; LCx: left circumflex artery; LDL-Chol: low-density lipoprotein cholesterol; LMT: left main trunk; LVEF: left ventricular ejection fraction; MI: myocardial infarction; OA: orbital atherectomy; OAC: oral anticoagulant; P: phosphorus; RA: rotational atherectomy; RCA: right coronary artery; SES: sirolimus-eluting stent; TG: triglyceride; TLR: target lesion revascularisation; ZES: zotarolimus-eluting stent | ||||
Comparisons of OCT findings between the TLR and non-TLR groups
Regarding pre-PCI OCT measurements, the maximum and mean calcium angles tended to be larger (Table 2), and the prevalence of ECN was significantly higher in the TLR group than in the non-TLR group (76.0% vs 41.0%; p=0.002). The inter- and intra-observer κ coefficients for the assessment of ECNs and CPs were 0.84 and 0.93, respectively.
Regarding the qualitative evaluation of CNs, OCT signal attenuation analysis demonstrated that the half width of signal attenuation behind CNs was significantly shorter in the TLR group than in the non-TLR group. Receiver operating characteristic analysis of the half width of signal attenuation behind CNs showed that the cut-off value of this parameter for identifying patients with subsequent TLR was 332 (sensitivity, 80.0%; specificity, 57.8%; area under the curve, 0.68; p=0.007) (Supplementary Figure 2). According to this cut-off value, we classified CN lesions with a half width ≤332 as dark CNs and those with a half width >332 as bright CNs. The prevalence of dark CNs was significantly higher in the TLR group than in the non-TLR group (80.0% vs 43.4%; p=0.001) (Table 2).
Regarding post-PCI OCT measurements, the reference lumen area, minimum lumen area (MLA), and minimum stent area (MSA) tended to be larger in the TLR group than in the non-TLR group. The acute lumen area gain was numerically larger, and the frequency of disrupted fibrous tissue and irregular protrusions was significantly higher in the TLR group than in the non-TLR group (disrupted fibrous tissue protrusion, 60.0 % vs 37.3%; p=0.046; irregular protrusion, 80.0% vs 38.6%; p<0.001) (Table 2). Additionally, the tissue protrusion volume and maximum tissue protrusion area were considerably larger in the TLR group than in the non-TLR group (Table 2).
Table 2. OCT findings.
| TLR (+) N=25 | TLR (-) N=83 | p-value | ||
|---|---|---|---|---|
| Pre-PCI measurements | ||||
| Reference lumen area, mm2 | 6.96±2.43 | 6.30±2.65 | 0.27 | |
| Minimum lumen area, mm2 | 1.86±1.01 | 1.68±0.72 | 0.33 | |
| Calcium length, mm | 22.3±13.7 | 23.9±11.4 | 0.55 | |
| Maximum calcium angle, ° | 325.8±54.5 | 297.4±69.6 | 0.06 | |
| Mean calcium angle, ° | 196.3±63.1 | 175.3±60.3 | 0.13 | |
| Mean CN angle, ° | 118.2±20.4 | 116.4±26.1 | 0.75 | |
| Classification of CN | Eruptive calcified nodule | 19 (76.0) | 34 (41.0) | 0.002 |
| Calcified protrusion | 6 (24.0) | 49 (59.0) | ||
| OCT signal attenuation analysis | ||||
| 1/2 width | 248.4 (204.4-327.1) | 351.3 (269.6-431.6) | 0.008 | |
| Classification by signal attenuation | Dark CN | 20 (80.0) | 36 (43.4) | 0.001 |
| Bright CN | 5 (20.0) | 47 (56.6) | ||
| Post-PCI measurements | ||||
| Reference lumen area, mm2 | 7.94±2.53 | 6.89±2.67 | 0.08 | |
| Minimum lumen area, mm2 | 6.71±2.25 | 5.82±1.98 | 0.06 | |
| Minimum stent area, mm2 | 6.31±2.24 | 5.62±1.96 | 0.14 | |
| Mean lumen area, mm2 | 8.30±2.39 | 7.62±2.37 | 0.21 | |
| Mean stent area, mm2 | 8.00±2.09 | 7.17±2.29 | 0.11 | |
| Mean stent expansion ratio, % | 0.81±0.21 | 0.86±0.26 | 0.37 | |
| Mean stent symmetry index | 0.84±0.05 | 0.85±0.04 | 0.26 | |
| Stent symmetry index at MSA site | 0.82±0.09 | 0.83±0.10 | 0.60 | |
| Acute lumen area gain, mm2 | 4.86±1.86 | 4.14±2.00 | 0.12 | |
| Stent edge dissection | 3 (12.0) | 19 (22.9) | 0.24 | |
| CS with incomplete stent apposition | 16 (64.0) | 54 (65.1) | 0.92 | |
| CS with tissue protrusion | 23 (92.0) | 66 (79.5) | 0.15 | |
| Classification of plaque protrusion | Smooth | 17 (68.0) | 47 (56.6) | 0.31 |
| Disrupted fibrous tissue | 15 (60.0) | 31 (37.3) | 0.046 | |
| Irregular | 20 (80.0) | 32 (38.6) | <0.001 | |
| Quantitative analysis of tissue protrusion | Tissue protrusion volume, mm3 | 1.56 (0.57-2.26) | 0.57 (0.09-0.97) | 0.001 |
| Mean tissue protrusion area, mm2 | 0.19 (0.10-0.27) | 0.13 (0.04-0.21) | 0.050 | |
| Maximum tissue protrusion area, mm2 | 0.42 (0.18-0.61) | 0.22 (0.07-0.38) | 0.009 | |
| Values are expressed as mean±standard deviation, median (interquartile range) or n (%). CN: calcified nodule; CS: cross-section; MSA: minimum stent area; OCT: optical coherence tomography; PCI: percutaneous coronary intervention; TLR: target lesion revascularisation | ||||
Factors associated with TLR
The results of univariable and multivariable Cox regression analyses for clinical factors and pre-PCI OCT findings associated with TLR are summarised in Table 3. The multivariable model 1 showed that haemodialysis (hazard ratio [HR] 3.08, 95% confidence interval [CI]: 1.38-6.87; p=0.006) was independently associated with TLR. The multivariable models 2 and 3 showed that younger age (model 2: HR 0.95, 95% CI: 0.91-0.99; p=0.008), the presence of ECN (model 2: HR 2.87, 95% CI: 1.13-7.28; p=0.026), and dark CNs (model 3: HR 3.50, 95% CI: 1.31-9.41; p=0.013) were independently associated with TLR. Table 4 shows Cox regression analysis of post-PCI OCT findings associated with TLR. The multivariable analysis showed that younger age (HR 0.95, 95% CI: 0.91-0.99; p=0.028), disrupted fibrous tissue protrusions (HR 2.59, 95% CI: 1.11-6.05; p=0.028), and irregular protrusions (HR 3.44, 95% CI: 1.27-9.29; p=0.015) were independently associated with TLR. The MLA and MSA, stent expansion ratio, mean stent symmetry index, stent edge dissection, and incomplete stent apposition were associated with subsequent TLR.
Table 3. Uni- and multivariable Cox regression analysis of clinical factors and pre-PCI OCT findings associated with TLR.
| Univariable analysis | Multivariable model 1 | Multivariable model 2* | Multivariable model 3* | |||||||||
|---|---|---|---|---|---|---|---|---|---|---|---|---|
| HR | 95% CI | p-value | HR | 95% CI | p-value | HR | 95% CI | p-value | HR | 95% CI | p-value | |
| Age | 0.94 | 0.91-0.98 | 0.004 | – | – | – | 0.95 | 0.91-0.99 | 0.008 | 0.95 | 0.91-0.98 | 0.006 |
| Male | 2.20 | 0.82-5.90 | 0.12 | – | – | – | – | – | – | – | – | – |
| BMI | 1.06 | 0.97-1.16 | 0.23 | |||||||||
| HT | 0.78 | 0.32-1.88 | 0.57 | |||||||||
| DM | 3.21 | 1.10-9.37 | 0.03 | – | – | – | ||||||
| DL | 1.54 | 0.66-3.61 | 0.32 | |||||||||
| HD | 3.31 | 1.50-7.30 | 0.003 | 3.08 | 1.38-6.87 | 0.006 | ||||||
| Smokers | 1.16 | 0.40-3.39 | 0.79 | |||||||||
| Prior MI | 2.18 | 0.90-5.25 | 0.08 | – | – | – | ||||||
| Prior stents | 1.51 | 0.69-3.33 | 0.31 | |||||||||
| ACS | 1.61 | 0.64-4.09 | 0.32 | |||||||||
| LDL-Chol | 1.00 | 0.99-1.01 | 0.91 | |||||||||
| HbA1c | 1.03 | 0.71-1.51 | 0.87 | |||||||||
| P | 1.23 | 0.79-1.91 | 0.36 | |||||||||
| BNP | 1.00 | 1.00-1.00 | 0.12 | – | – | – | ||||||
| LVEF | 0.99 | 0.96-1.02 | 0.45 | |||||||||
| RCA | 1.28 | 0.57-2.85 | 0.55 | |||||||||
| LAD | 0.40 | 0.15-1.07 | 0.07 | – | – | – | ||||||
| Proximal lesion | 2.05 | 0.88-4.76 | 0.09 | – | – | – | ||||||
| RLA | 1.11 | 0.95-1.29 | 0.19 | |||||||||
| MLA | 1.39 | 0.89-2.17 | 0.15 | – | – | – | – | – | – | |||
| Calcium length | 0.99 | 0.95-1.03 | 0.62 | |||||||||
| Maximum calcium angle | 1.01 | 1.00-1.01 | 0.14 | – | – | – | – | – | – | |||
| Eruptive calcified nodule | 3.13 | 1.24-7.90 | 0.016 | 2.87 | 1.13-7.28 | 0.026 | ||||||
| Dark CN | 3.65 | 1.36-9.77 | 0.010 | 3.50 | 1.31-9.41 | 0.013 | ||||||
| ACS: acute coronary syndrome; BMI: body mass index; BNP: brain natriuretic peptide hormone; CI: confidence interval; CN: calcified nodule; DL: dyslipidaemia; DM: diabetes mellitus; HbA1c: haemoglobin A1c; HD: haemodialysis; HR: hazard ratio; HT: hypertension; LAD: left anterior descending artery; LDL-Chol: low-density lipoprotein cholesterol; LVEF: left ventricular ejection fraction; MI: myocardial infarction; MLA: minimum lumen area; P: phosphorus; RCA: right coronary artery; RLA: reference lumen area. *Variables were included in the multivariable analysis if the p-values in the univariable analysis were less than 0.15. Factors not selected by the stepwise algorithm are shown with "-". Multivariable model 1 includes clinical factors; multivariable model 2 and 3 include age, sex, and pre-PCI OCT findings. Different multivariable models (model 2 and 3) are shown due to the significant correlation between eruptive calcified nodules and dark CN. | ||||||||||||
Table 4. Uni- and multivariable Cox regression analysis of post-PCI OCT findings associated with TLR.
| Univariable analysis | Multivariable analysis | |||||
|---|---|---|---|---|---|---|
| HR | 95% CI | p-value | HR | 95% CI | p-value | |
| Age | 0.94 | 0.90-0.98 | 0.002 | 0.95 | 0.91-0.99 | 0.028 |
| Male | 2.26 | 0.84-6.07 | 0.11 | – | – | – |
| RLA | 1.15 | 1.00-1.31 | 0.049 | |||
| MSA | 1.19 | 0.98-1.45 | 0.08 | – | – | – |
| Stent expansion ratio | 0.53 | 0.10-2.89 | 0.46 | |||
| Mean stent symmetry index | 0.95 | 0.88-1.03 | 0.23 | |||
| Stent edge dissection | 0.55 | 0.16-1.84 | 0.33 | |||
| Incomplete stent apposition | 0.94 | 0.41-2.13 | 0.88 | |||
| Smooth protrusion | 1.55 | 0.67-3.58 | 0.31 | |||
| Disrupted fibrous tissue protrusion | 2.75 | 1.20-6.33 | 0.017 | 2.59 | 1.11-6.05 | 0.028 |
| Irregular protrusion | 4.60 | 1.72-12.3 | 0.002 | 3.44 | 1.27-9.29 | 0.015 |
| CI: confidence interval; HR: hazard ratio; MSA: minimum stent area; OCT: optical coherence tomography; PCI: percutaneous coronary intervention; RLA: reference lumen area; TLR: target lesion revascularisation | ||||||
Comparison of the cumulative incidence of TLR among four patient groups
According to the Cox regression analysis of pre-PCI OCT findings, we classified patients into four groups based on the presence of dark or bright CNs and ECNs or CPs. The Kaplan-Meier curve demonstrated that the cumulative 5-year incidence of TLR in patients with dark CNs and ECNs was significantly higher than those with bright CNs and CPs (53.2% vs 8.5%, HR 5.34, 95% CI: 1.55-18.3; p=0.008). The cumulative 5-year incidence of TLR in patients with dark CNs and ECNs tended to be higher than in those with dark CNs and CPs (53.2% vs 26.5%, HR 2.66, 95% CI: 0.78-9.14; p=0.12) and those with bright CNs and ECNs (53.2% vs 30.0%, HR 3.50, 95% CI: 0.80-15.20; p=0.10) (Figure 3).
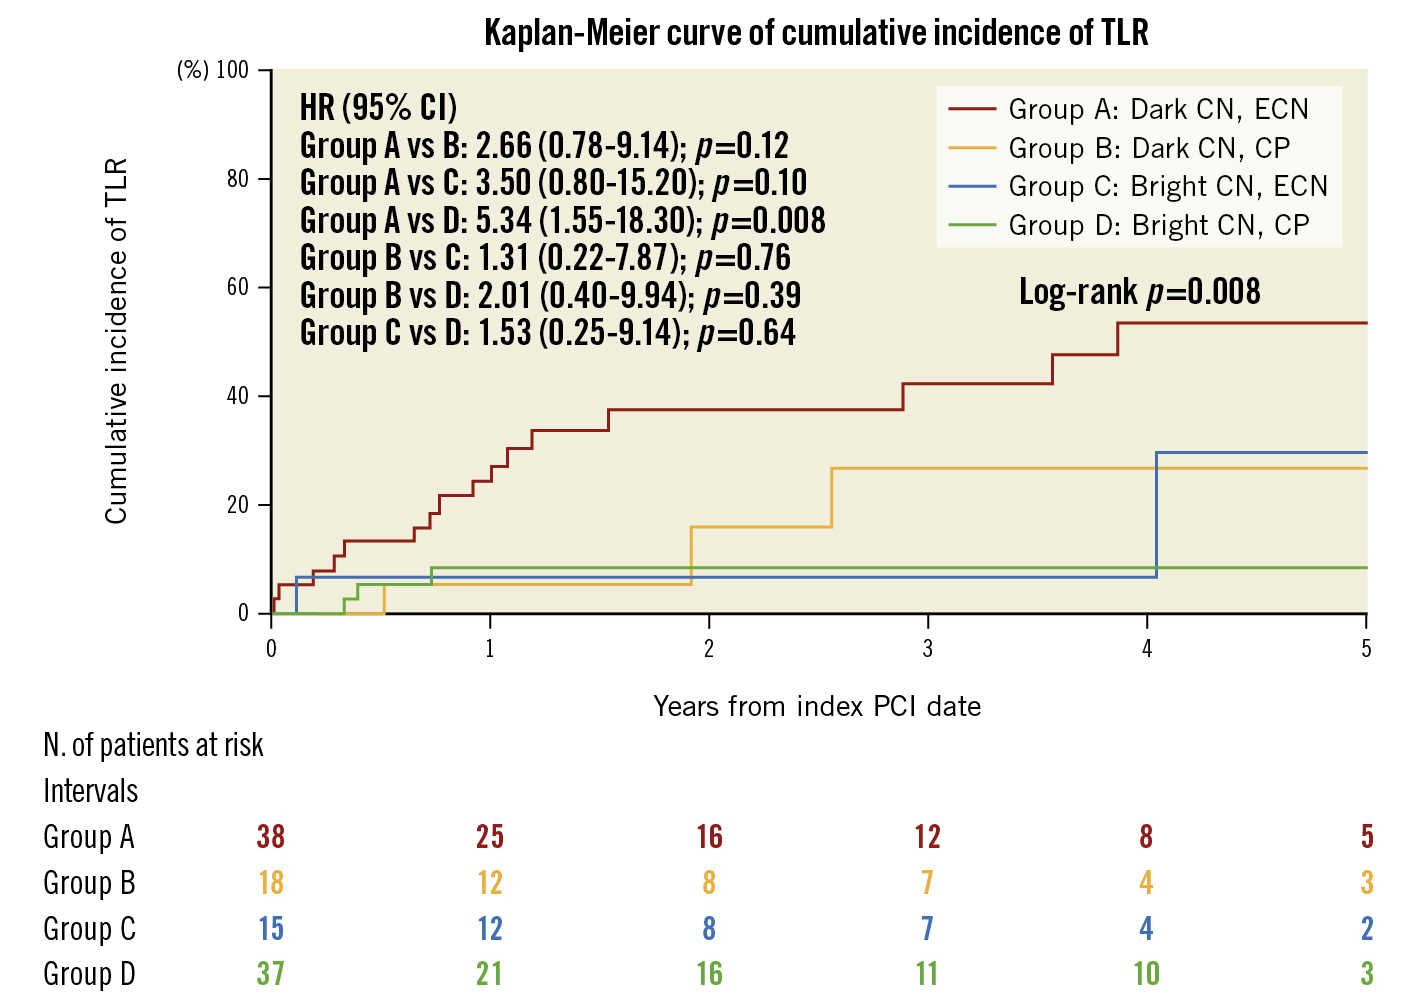
Figure 3. Kaplan-Meier curve showing the difference in the cumulative incidence of TLR between the four patient groups. CI: confidence interval; CN: calcified nodule; CP: calcified protrusion; ECN: eruptive calcified nodule; HR: hazard ratio; PCI: percutaneous coronary intervention; TLR: target lesion revascularisation
Comparison of the OCT findings at follow-up
Supplementary Table 2 shows the comparison of OCT findings at follow-up. The MLA and mean lumen area were significantly smaller, and late lumen area loss was significantly larger, in the TLR group. The prevalence of IS-CNs was significantly higher in the TLR group (57.9% vs 21.9%; p=0.010). All IS-CNs were located within 5 mm of the CNs observed at index PCI. Representative cases are described in Supplementary Figure 3.
Discussion
The main findings of the current study are as follows: (1) the overall 5-year cumulative incidence of TLR in patients with CNs was 32.6%; (2) in addition to clinical characteristics such as younger age and haemodialysis, ECNs and dark CNs observed pre-PCI as well as disrupted fibrous tissue protrusions and irregular protrusions observed post-PCI were independently associated with subsequent TLR; (3) patients with dark CNs and ECNs had a >5-fold higher incidence of TLR than patients with bright CNs and CPs; (4) among patients who underwent follow-up OCT, the prevalence of IS-CNs was considerably higher in the TLR group, at 58%.
Several studies have shown that CN lesions are associated with worse clinical outcomes than non-CN lesions after PCI561213. Morofuji et al reported that the cumulative 5-year incidence of clinically driven TLR in CN lesions treated with second-generation DES following rotational atherectomy was 23.2%12. Sugane et al reported that over one-third of ACS patients receiving PCI for CN lesions required TLR within 3 years5. In line with these reports, the cumulative 5-year incidence of TLR in patients with CNs was 32.6% in our study. Given the 6-9% 5-year cumulative TLR rate in non-CN lesions1415, PCI for CN lesions can be considered an unsolved issue in PCI using current-generation DES.
Although several studies have clarified morphological features of CNs as a predictor of poor prognosis after PCI, no studies, thus far, have investigated the value of qualitative evaluations of CNs. Therefore, for the first time, we tried to evaluate the qualitative characteristics of CNs for a more accurate risk stratification. Accordingly, we applied a unique evaluation method of OCT signal attenuation behind CNs, which made it possible to classify CNs as either dark or bright. As a result, we found that the presence of dark CNs was independently associated with TLR at 5 years after stenting. Kume et al reported the possibility of differentiating red and white thrombi by analysing the pattern of the OCT signal attenuation behind the thrombus in autopsy cases11. Red thrombus, a cell-rich structure consisting mainly of red blood cells, scatters light signals extensively and can be identified as high-backscattering protrusions. CNs also appear as high-backscattering protruding masses and are visualised as low-intensity areas with a diffuse border on OCT images16. Why CNs appear as low-signal intensity regions with diffuse borders has been speculated on in previous post-mortem studies; CNs are reported to contain fibrin between the bony spicules and osteoblasts, osteoclasts, and inflammatory cells17 as well as haemosiderin deposits with macrophage infiltration18. Another report showed that CNs are related to plaque haemorrhage caused by damage to the surrounding capillaries and arterioles19. These components of CNs are observed as low signal attenuated regions, and the degree of signal attenuation may vary from case to case depending on the number of such components inside the CN. Torii et al described relatively flexible, less tensile calcifications as “necrotic core calcifications” in their pathological study and proposed the hypothesis that the necrotic core calcifications sandwiched between heavily calcified plaques tend to receive external mechanical forces like “hinge motion”, thus leading to the formation of CNs18. Although we could not compare the signal intensity patterns with pathological findings in vitro, we currently speculate that OCT-derived dark CNs contain much more necrotic core calcification than bright ones; therefore, they are prone to TLR.
Furthermore, in addition to clinical factors such as younger age and haemodialysis, we found that the presence of ECNs was independently associated with subsequent TLR. According to a previous OCT study, calcified plaques can be classified into ECNs, CPs, and superficial calcific sheets (SC)20. Based on this classification, Iwai et al revealed that ECNs, rather than CPs and SC, were independently associated with a higher MACE rate after PCI in patients with calcified plaques6, which is consistent with our results. Although sometimes confused, OCT-derived ECNs correspond to pathological “calcified nodules”, whereas OCT-derived CPs correspond to pathological “nodular calcifications”20. The difference between the two is determined by whether the CN has a healed fibrous cap18. Pathological studies suggested that the eruption of CNs causes disruption of the endothelium and serves as a nidus for subsequent thrombus formation1921. In fact, our study demonstrated that the frequency of irregular protrusion observed immediately after PCI was considerably higher in lesions with ECNs than in those with CPs. Furthermore, the frequency of irregular or disrupted fibrous tissue protrusions, as well as the amount of tissue protrusion, was markedly higher in the TLR group than in the non-TLR group. Thus, we currently speculate that the presence of ECNs in the target lesion might accelerate subsequent thrombus formation after stent implantation, potentially leading to the regrowth of CNs in the stented segment. These series of local vessel reactions might result in subsequent TLR after stent implantation.
In our study, we classified patients with CNs into four groups according to the presence of dark or bright CNs and ECNs or CPs. As a result, we found that this classification was significantly associated with their prognosis. Notably, patients with dark CNs and ECNs had a >5-fold higher incidence of TLR than patients with bright CNs and CPs, and the cumulative 5-year incidence was as high as 53.2%. Although we reported a high incidence of TLR in CN lesions, >60% of them were able to avoid TLR, thereby denoting that CNs do not have an equally poor prognosis and that TLR could be avoided if some criteria, such as patient condition, lesion, and procedural characteristics, are met. Indeed, patients with bright CNs and CPs had a relatively low TLR rate (8.5%) during 5-year follow-up. Our results indicate that an OCT-based combined approach with a morphological and qualitative evaluation of PCI target lesions might provide more accurate prognostic risk stratification of cases with CNs (Central illustration).
While dark CNs and ECNs were associated with TLR, none of the conventional procedural risk factors, such as stent underexpansion, stent edge dissection, incomplete stent apposition, and asymmetric stent expansion, were significantly related to subsequent TLR in PCI to CN lesions. Although post-intervention MSA is the most powerful predictor for TLR in non-CN lesions2223, it was not significantly different between the TLR and non-TLR groups in our study; rather, it was larger in the TLR group. We consider that one of the most plausible reasons was that the main aetiology of TLR could be progressive regrowth of CNs in the stented segment. In a large-scale retrospective registry including 657 ACS patients, Sugane et al reported that IS-CNs were present in 82.4% of the TLR cases in CN lesions and in 0% of the non-TLR cases5. Similarly, we demonstrated that the presence of IS-CNs was significantly more common in TLR cases than in non-TLR cases (57.9% vs 21.9%; p=0.010) and that all IS-CNs were observed in the same lesion where CNs were observed on pre-PCI OCT images. Thus, we considered that the regrowth of CNs in a stented segment might be the main aetiology of TLR in CN cases. Traditionally, neointimal hyperplasia was considered a common cause of in-stent restenosis. Since a well-expanded stent can provide more space for neointimal hyperplasia than an unexpanded stent, MSA was considered a strong predictor for TLR24. In contrast, it is speculated that irrespective of however large the stent is expanded, preventing in-stent restenosis by CN protrusion followed by calcifying fibrin thrombus, is difficult25. These speculations possibly explain why MSA was not associated with the occurrence of TLR in the CN cases. Recently, several studies have reported on the efficacy and safety of intravascular lithotripsy in severely calcified coronary lesions26. Interestingly, Warisawa et al recently reported a case whereby a massive CN was successfully treated by intravascular lithotripsy27. However, since a different mechanism of TLR is speculated in CN lesions, further studies are required to evaluate the safety and efficacy of intravascular lithotripsy in lesions with CN.
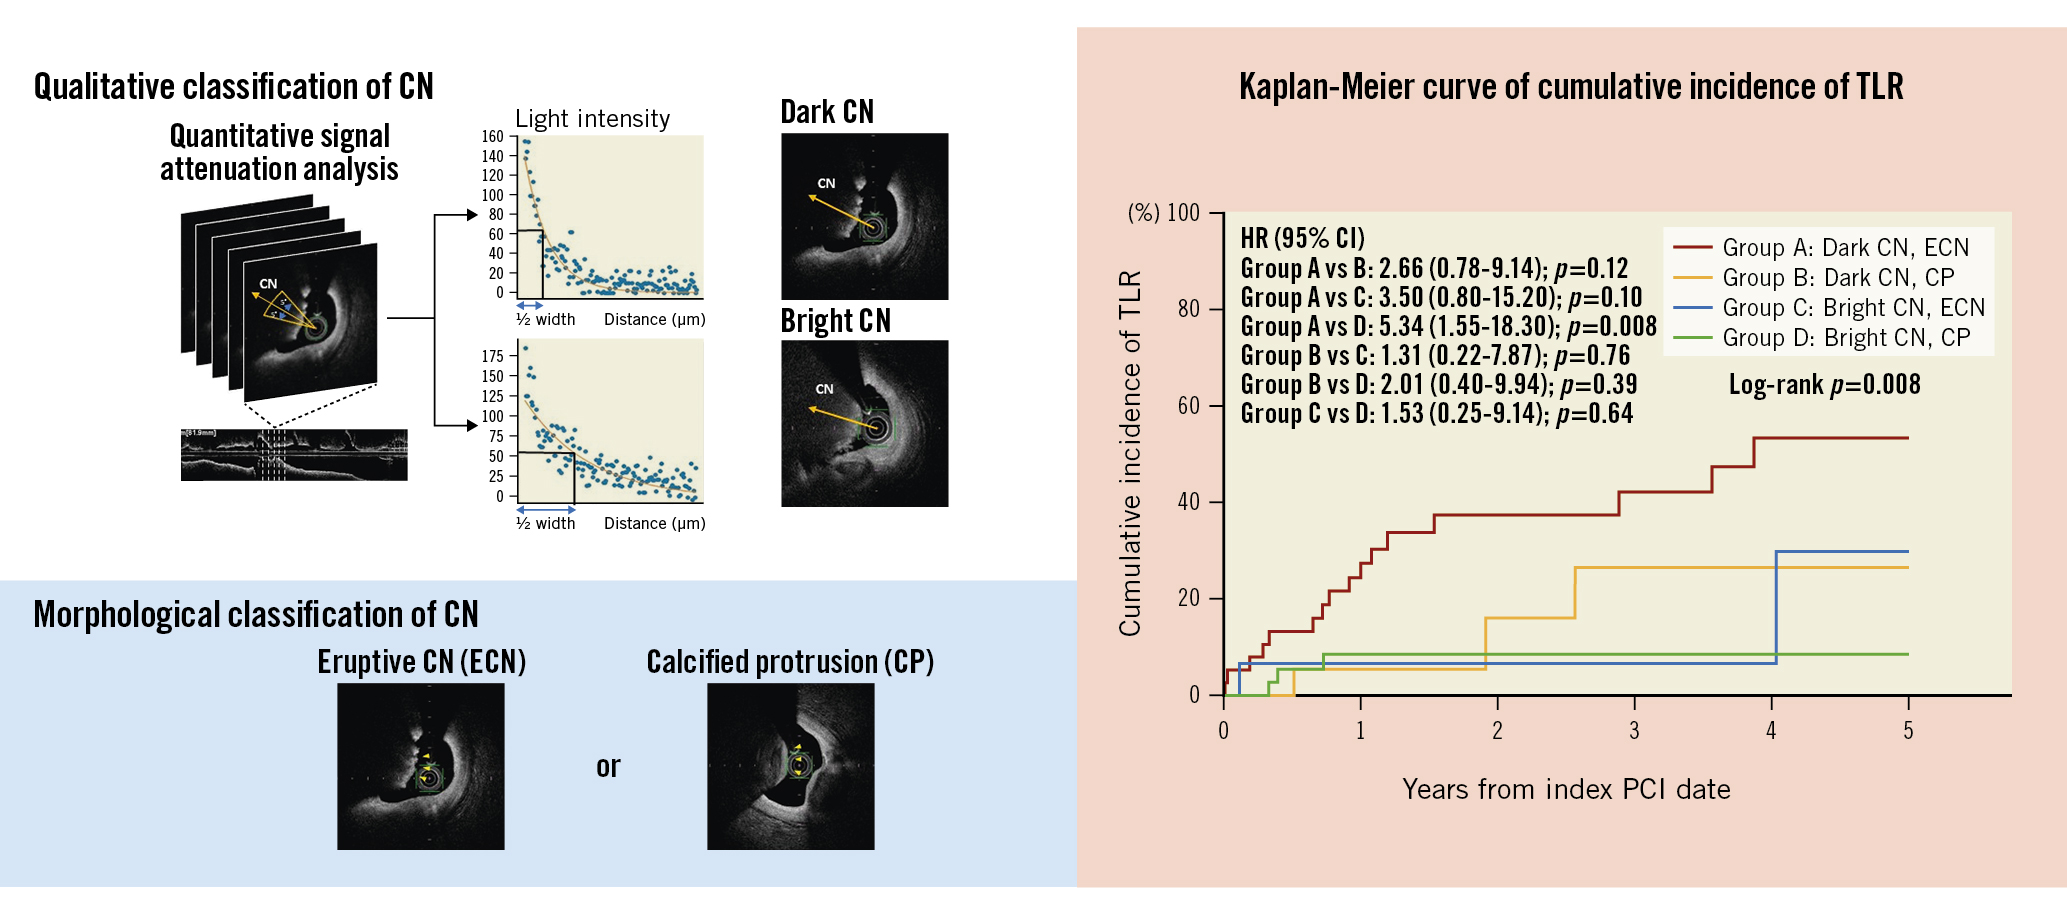
Central illustration. Predictors of target lesion revascularisation in calcified nodule lesions. To qualitatively classify CNs, the signal attenuation of CNs was analysed. CNs were divided into dark CNs or bright CNs according to the half width of signal attenuation, greater or lower than 332, respectively. Morphologically, CNs can be classified into ECN or CP. The Kaplan-Meier curve showed that patients with dark CNs and ECNs had a more than 5-fold higher incidence of TLR than patients with bright CNs and CPs (HR 5.34, 95% CI: 1.55-18.30; p=0.008). CI: confidence interval; CN: calcified nodule; CP: calcified protrusion; ECN: eruptive calcified nodule; HR: hazard ratio; PCI: percutaneous coronary intervention; TLR: target lesion revascularisation
Limitations
There are several limitations of the present study. First, this was a retrospective, observational study, allowing the possibility of selection bias. Second, the incidence of ACS was lower than that of previous studies. ECN (pathologically “calcified nodules”) was originally classified as the aetiology of ACS17 but has recently been described as a cause of stable angina as well2829. Nonetheless, there might be a discrepancy between the lower incidence of ACS observed in our study population and that of real-world populations. Third, follow-up OCT was performed at the physician’s discretion, and we excluded patients who died within a year after the index PCI, hence the interpretation of follow-up OCT results required careful attention. Fourth, there was a lack of pathological assessment; we identified some OCT features associated with TLR; however, we could not reveal what the OCT features indicated pathologically. Specifically, as an inherent limitation, OCT could have misdiagnosed CNs with red thrombi because of the potential overlap between them. However, we currently consider that it is possible to distinguish CNs from pure red thrombi relatively accurately by identifying the presence of calcium proximal and/or distal to the lesion and examining its continuity. Fifth, we initially intended to identify ways to avoid subsequent TLR in the CN cases. However, there were no interventional procedural factors in the index PCI. Further investigation is warranted to improve clinical outcomes, such as stent-free treatment for CNs, intravascular lithotripsy, or effective medical treatment to suppress IS-CNs.
Conclusions
The 5-year cumulative incidence of TLR in patients with CNs was 32.6%. Younger age, haemodialysis, ECNs, dark CNs, disrupted fibrous tissue, and irregular protrusions were independently associated with the occurrence of TLR. A combination of morphological and qualitative characteristics allowed us to stratify the risk for stent failure in CN cases. Considering that IS-CNs were seen in 57.9% of the TLR lesions on follow-up OCT images, the regrowth of CNs in the stented segment could be the main aetiology of stent failure in CN cases.
Impact on daily practice
This is the first report to demonstrate the prognostic factors associated with TLR among CN lesions. Younger age, haemodialysis, eruptive CNs and dark CNs observed at pre-OCI OCT, and disrupted fibrous tissue or irregular protrusions observed at post-PCI OCT were independently related to subsequent TLR. Although we could not identify any interventional factors that could help prevent TLR, our results suggest that careful follow-up is warranted when PCI is performed for high-risk CN lesions.
Conflict of interest statement
The authors have no conflicts of interest to declare.
Supplementary data
To read the full content of this article, please download the PDF.