Abstract
Aims: Evaluation of aortic stenosis (AS) is based on echocardiographic measurement of mean pressure gradient (MPG), flow velocity (Vmax) and aortic valve area (AVA). The objective of the present study was to analyse the impact of systemic haemodynamic variables and concomitant mitral regurgitation (MR) on aortic MPG, Vmax and AVA in severe AS.
Methods and results: A pulsatile circulatory model was designed to study function and interdependence of stenotic aortic (AVA: 1.0 cm², 0.8 cm² and 0.6 cm²) and insufficient mitral prosthetic valves (n=8; effective regurgitant orifice area [EROA] <0.2 cm² vs. >0.4 cm²) using Doppler ultrasound. In the absence of severe MR, a stepwise increase of stroke volume (SV) and a decrease of AVA was associated with a proportional increase of aortic MPG. When MR with EROA <0.2 cm² vs. >0.4 cm² was introduced, forward SV decreased significantly (70.9±1.1 ml vs. 60.8±1.6 ml vs. 47.4±1.1 ml; p=0.02) while MR volume increased proportionally. This was associated with a subsequent reduction of aortic MPG (57.1±9.4 mmHg vs. 48.6±13.8 mmHg vs. 33.64±9.5 mmHg; p=0.035) and Vmax (5.09±0.4 m/s vs. 4.91±0.73 m/s vs. 3.75±0.57 m/s; p=0.007). Calculated AVA remained unchanged (without MR: AVA=0.53±0.04 cm² vs. with MR: AVA=0.52±0.05 cm²; p=ns). In the setting of severe AS without MR, changes of vascular resistance (SVR) and compliance (C) did not impact on aortic MPG (low SVR and C: 66±13.8 mmHg and 61.1±20 mmHg vs. high SVR and C: 60.9±9.2 mmHg and 71.5±13.5 mmHg; p=ns) In concomitant severe MR, aortic MPG and Vmax were not significantly reduced by increased SVR (36.6±2.2 mmHg vs. 34.9±5.6 mmHg, p=0.608; 3.89±0.18 m/s vs. 3.96±0.28 m/s; p=ns).
Conclusions: Systemic haemodynamic variables and concomitant MR may potentially affect diagnostic accuracy of echocardiographic AS evaluation. As demonstrated in the present study, MPG and Vmax are flow-dependent and significantly reduced by a reduction of forward SV from concomitant severe MR, resulting in another entity of low-flow low-gradient aortic stenosis. In contrast, calculated AVA appears to be a robust parameter of AS evaluation if severe MR is present. Changes of SVR and C did not affect the diagnostic accuracy of AS evaluation.
Abbreviations
AS: aortic stenosis
AVA: aortic valve area
C: arterial compliance
CW: continuous wave Doppler
EF: ejection fraction
EROA: effective regurgitant orifice area
HR: heart rate
LV: left ventricle
MPG: mean pressure gradient
MR: mitral regurgitation
PW: pulsed wave Doppler
SV: stroke volume
SVR: systemic vascular resistance
Vmax: maximum transaortic flow velocity
Introduction
The measurement of mean pressure gradient (MPG), maximum flow velocity (Vmax) and calculation of aortic valve area (AVA) are well established to evaluate the severity of aortic stenosis (AS). According to current guidelines, AS is severe when MPG and Vmax are above 40 mmHg and 4 m/s and AVA is below 1.0 cm2, respectively1. However, as MPG and Vmax are flow-generated and depend on stroke volume (SV), they are susceptible to the effect of changing haemodynamic circulatory variables as well as the effect of concomitant mitral valve disease2-6. Particularly in patients with decreased LV stroke volumes, the diagnosis of severe AS frequently represents a challenge7-10.
Therefore, the purpose of this study was to analyse the impact of different circulatory variables as well as concomitant mitral regurgitation on echocardiographic measurement (MPG, Vmax, AVA) in stenotic aortic valves in a standardised circulatory model.
Methods
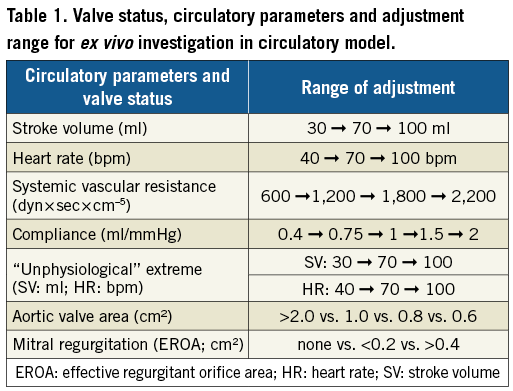
A pulsatile mock circulatory model was designed to facilitate the controlled adjustment of multiple circulatory parameters as well as aortic and mitral valve function (Figure 1, Table 1). The system is driven by a pulsatile pump (Harvard Apparatus, Holliston, MA, USA) generating total left ventricular (LV) stroke volumes of 15-100 ml. The pump rate (heart rate [HR]) was from 10 to 100 beats per minute (bpm) and the output phase ratio (ratio of systole length and diastole length in %) from 25/75-50/50. A water-glycerol solution (70% water, 30% glycerol) approximating the viscosity of blood at a temperature of 21°C was used to prime the circuit; cornstarch (10 g/l) was added to facilitate Doppler measurements. An immersion heater was used to hold the temperature constant at 21°C and an agitator was used to prevent the settling of cornstarch in the venous capacity module. A polyethylene air chamber was integrated to adjust different values of arterial compliance (C) within the range from 0.4-2.0 ml/mmHg. The systemic vascular resistance (SVR) of the circulation was adapted by narrowing the tube diameter using a spherical valve.
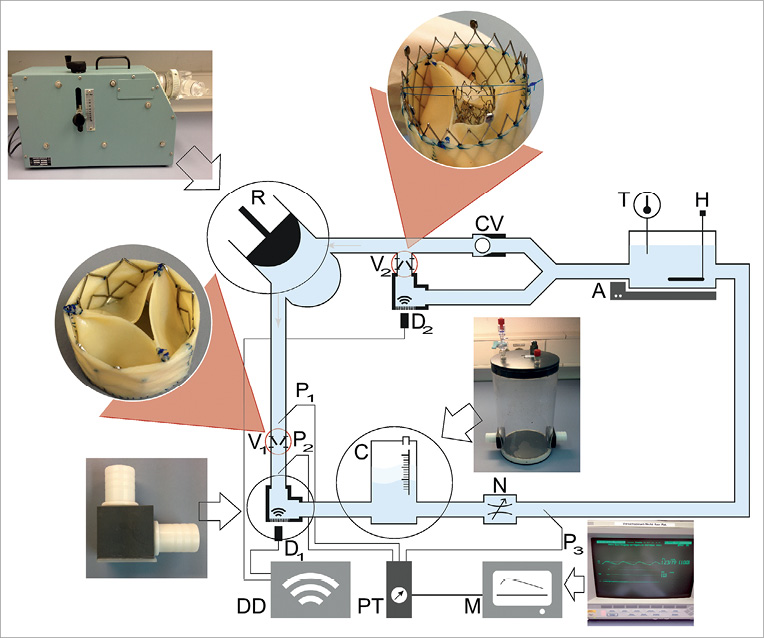
Figure 1. Illustration of the pulsatile mock circulatory model. A circulatory model was designed to investigate the impact of systemic circulatory parameters and concomitant mitral valve dysfunction on transaortic haemodynamics in aortic stenosis. A: agitator; C: compliance element; CV: check valve; D: Doppler probe; DD: Doppler device; H: heating; M: monitor; N: narrowing valve; P: pressure measuring; PT: pressure transducer; R: reciprocating pump; T: temperature; V: valve
Two self-expanding biological valves were positioned on the inflow (mitral) and outflow (aortic) of the ventricle. A rectangular bend with a silicone membrane was integrated to facilitate a coaxial view on the stenotic or insufficient jet without angular adjustment (α=0°). Invasive pressure measurement was recorded and controlled with a pressure monitor (Viridia Component Monitoring System [CMS]; Hewlett Packard, Palo Alto, CA, USA) and the flow was simultaneously recorded with a Doppler ultrasound machine (CX50; Philips Medical Systems, Andover, MA, USA). The results and measured values of this set-up are comparable to the in vivo setting.
IMPLEMENTATION OF AORTIC STENOSIS AND MITRAL REGURGITATION IN THE MOCK CIRCUIT
A self-expanding biological valve (diameter 26 mm; length 20 mm) was used in the aortic position. Aortic stenosis was created by a centripetal suture along the commissures of the valve (Figure 2A). AVA was reduced stepwise from >2.0 cm2 to 1.0 cm², 0.8 cm² and 0.6 cm² for the creation of moderate and severe AS, respectively. A total of 15 prosthetic valves (five per AVA) were tested in the circulatory model and assessed non-invasively under varying haemodynamic conditions.
Mitral regurgitation was introduced into the circuit by positioning a nitinol stent with a defined lumen area across the leaflets of the mitral prosthesis to prevent full leaflet coaptation (Figure 2B). Severity of MR was adapted using different stent sizes, thus causing different effective regurgitant orifice areas (EROAs). Hence, a mitral regurgitation was created from moderate (EROA <0.2 cm²) to severe (EROA >0.4 cm²) regurgitation.
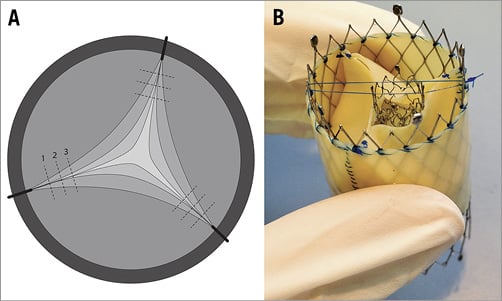
Figure 2. Functional status of aortic and mitral valves. A) Aortic stenosis was created by suturing the valve leaflets and reducing AVA from >2.0 cm² to 1.0 cm2, 0.8 cm2 and 0.6 cm2. B) Mitral regurgitation was created by positioning a coronary stent across the mitral leaflets to prevent full leaflet coaptation. Stent sizes were modified to generate MR with an EROA <0.2 cm² or EROA >0.4 cm².
TEST PROTOCOL
The test protocol included four measurement cycles combining different grades of aortic stenosis with different grades of mitral regurgitation as well as per protocol defined adjustment steps of the stroke volume, heart rate, systemic vascular resistance and arterial compliance (Figure 3, Table 1). Depending on the measurement cycle, the output parameters were either fixed at SV=80 ml, HR=70 bpm, SVR=1,200 dyn×sec×cm–5, and C=1 ml/mmHg or adjusted according to predefined steps.
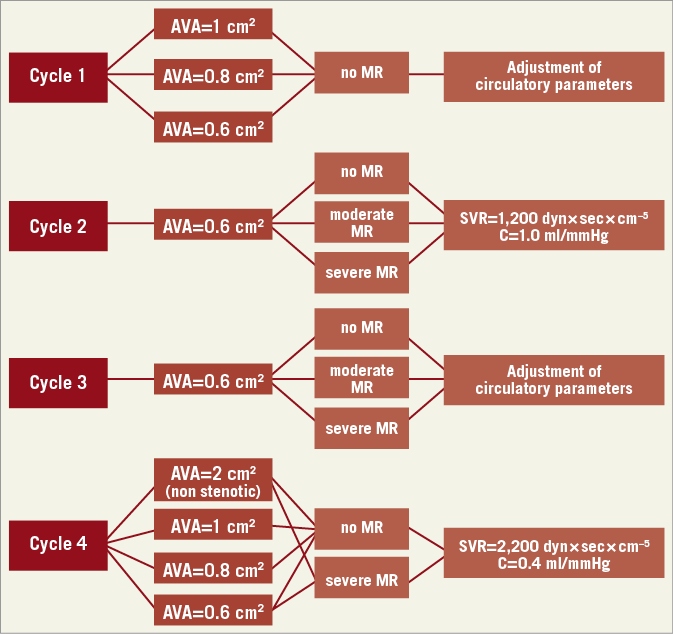
Figure 3. Overview of measurement cycles 1-4. Cycle 1. Impact of aortic valve area, systemic vascular resistance and compliance on transvalvular flow and gradient. Cycle 2. Impact of mitral regurgitation on forward stroke volume, MPG, flow velocity and calculated AVA in severe AS. Cycle 3. Impact of systemic vascular resistance and arterial compliance in severe AS and concomitant MR. Cycle 4. Impact of maximum LV afterload (minimal C, maximal SVR).
To evaluate the potential concordant effects of arterial compliance and systemic vascular resistance on aortic valve haemodynamics in severe AS, arterial compliance was minimised and systemic vascular resistance was maximised in measurement cycle 4 (“maximum LV afterload”), including the evaluation of mitral regurgitation in this setting. For each measurement cycle, the circuit was recalibrated and resistance and compliance were adjusted to the predefined baseline parameters.
MEASURING TECHNIQUES
MPG, AVA and maximum flow velocity (Vmax) were measured by a continuous wave (CW), pulsed wave (PW) Doppler (Philips Medical Systems ultrasound machine). The maximum flow velocity across the aortic valve was recorded and the pressure gradient and AVA were calculated by the simplified Bernoulli and continuity equations, respectively. Ventricular, aortic and venous pressures were measured invasively using standard fluid-filled catheters and transducers.
STATISTICAL ANALYSIS
The analysis was performed with SPSS software (IBM Corp., Armonk, NY, USA). The comparison of different groups was analysed using the Kruskal-Wallis test for independent samples. All results are expressed with the mean and standard deviation and the test of statistical significance (p<0.05).
Results
CYCLE 1. IMPACT OF AORTIC VALVE AREA, SYSTEMIC VASCULAR RESISTANCE AND COMPLIANCE ON TRANSVALVULAR FLOW AND GRADIENT
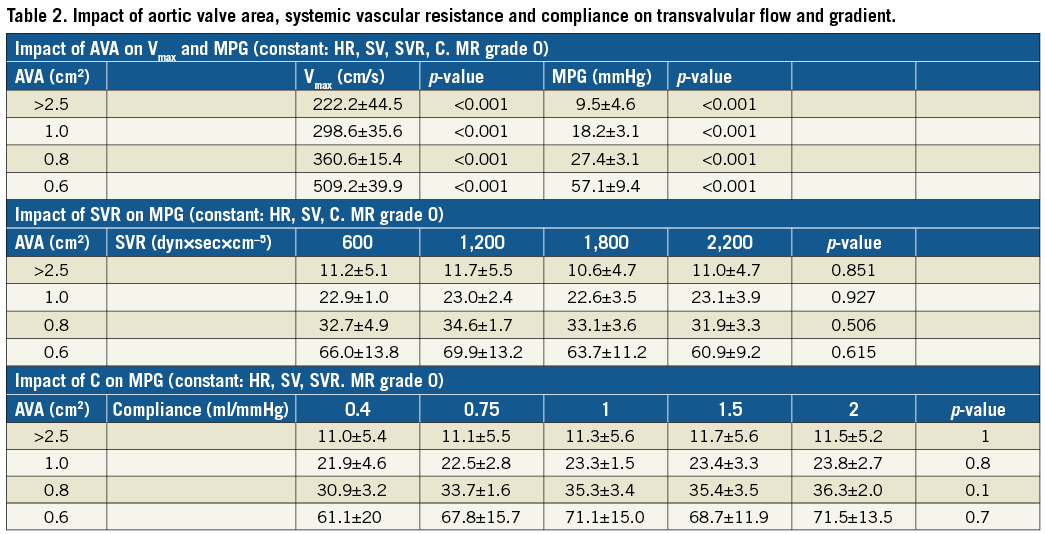
When SV, SVR and C were constant, a reduction of valve opening area (representing progressive stenosis) was associated with a significant increase of Vmax and MPG (Figure 4A). When AVA reduced from >2.0 cm2 to 0.6 cm2, flow velocity across the AV increased significantly from 222.2±44.5 cm/s to 509.2±39.9 cm/s (p=0.002). Also, in severe AS (AVA=0.6 cm2), a stepwise increase of SV (30 ml-100 ml) was associated with a significant increase of MPG from 20.2±3.1 mmHg (SV=30 ml) to 92.7±20.4 mmHg (SV=100 ml) (p=0.002). In contrast, in non-stenotic valves, the MPG increased non-significantly by 9.7 mmHg when SV increased from 30 ml to 100 ml.
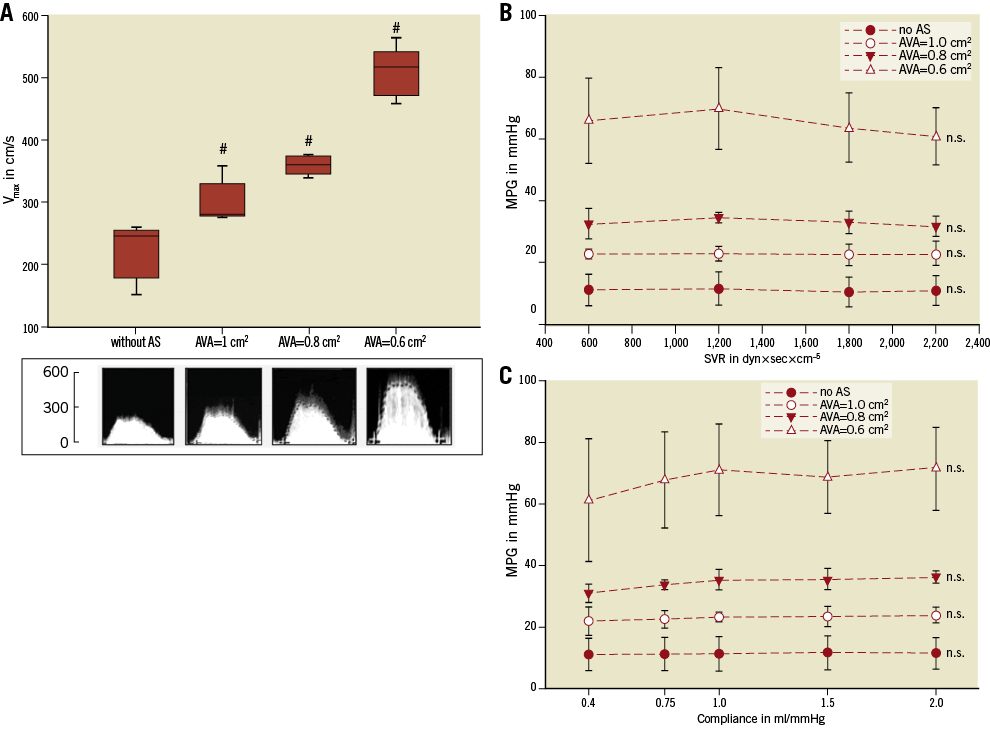
Figure 4. Impact of aortic valve area, systemic vascular resistance and compliance on transvalvular flow and gradient (MR grade 0). Impact of AVA (A), SVR (B) and compliance (C) on Vmax and MPG. Neither SVR nor arterial compliance has an impact on transaortic MPG. The results of each measurement are based on the evaluation of five valves. #: significant (p<0.05) difference between the groups. n.s.: not significant (p≥0.05) versus baseline.
To investigate the impact of C and SVR on aortic haemodynamics, MPG was recorded with a stepwise increase of either SVR (600-2,200 dyn×sec×cm–5) or arterial compliance (0.4-2 ml/mmHg) in different grades of AS. Neither changes of SVR nor changes of C had a significant impact on MPG when the other parameters remained unchanged (Figure 4B, Figure 4C). Changes of haemodynamics during different measurement cycles are detailed in Table 2.
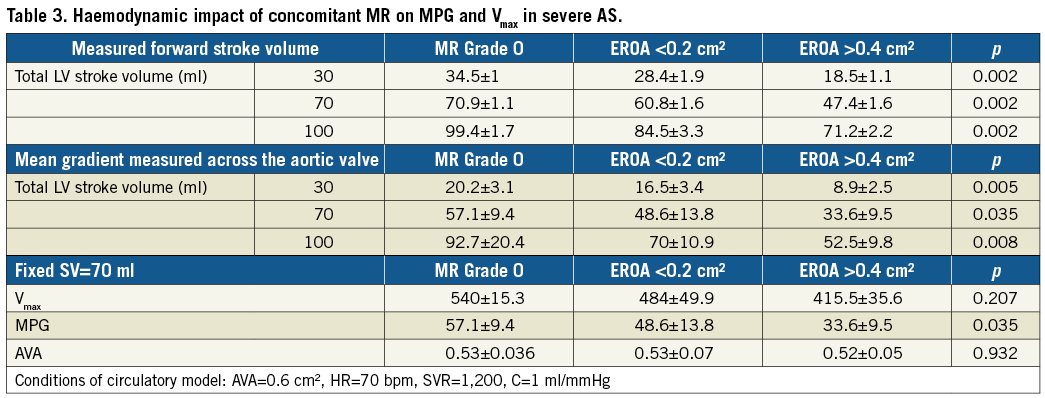
CYCLE 2. IMPACT OF MITRAL REGURGITATION ON FORWARD STROKE VOLUME, MPG, FLOW VELOCITY AND CALCULATED AVA IN SEVERE AS
Forward stroke volume was measured in severe AS (AVA=0.6 cm2) at varying pre-set total stroke volumes of the Harvard ventricle (30 ml, 60 ml, 100 ml) and varying concomitant grades of mitral regurgitation.
Without MR, no significant difference between the total SV and the forward SV was detected. With concomitant MR with an EROA >0.4 cm², forward SV decreased significantly from 70±1.0 ml to 60.8±1.6 ml (p=0.003) and 47.4±1.1 ml (p=0.002), at a pre-set stroke volume of 60 ml (Figure 5A). With the introduction of severe MR into the model, transaortic MPG and flow velocity across severe AS (AVA=0.6 cm²) decreased proportionally from 57.1±9.5 mmHg and 540.0±15.3 cm/s without MR to 33.6±9.5 mmHg (p=0.03) and 415.0±35.6 cm/s (p=0.02) with concomitant severe MR (EROA >0.4 cm²), respectively (Figure 5B, Figure 5C). MR-associated reduction of the transaortic gradient in severe AS was higher in higher LV stroke volumes (Table 3). In contrast, calculated AVA remained unchanged irrespective of mitral valve function: without MR the AVA was 0.53±0.04 cm², with MR with EROA <0.2 cm² and EROA >0.4 cm² AVA was 0.53±0.07 cm² and 0.52±0.05 cm² (p=0.932), respectively (Figure 5D).
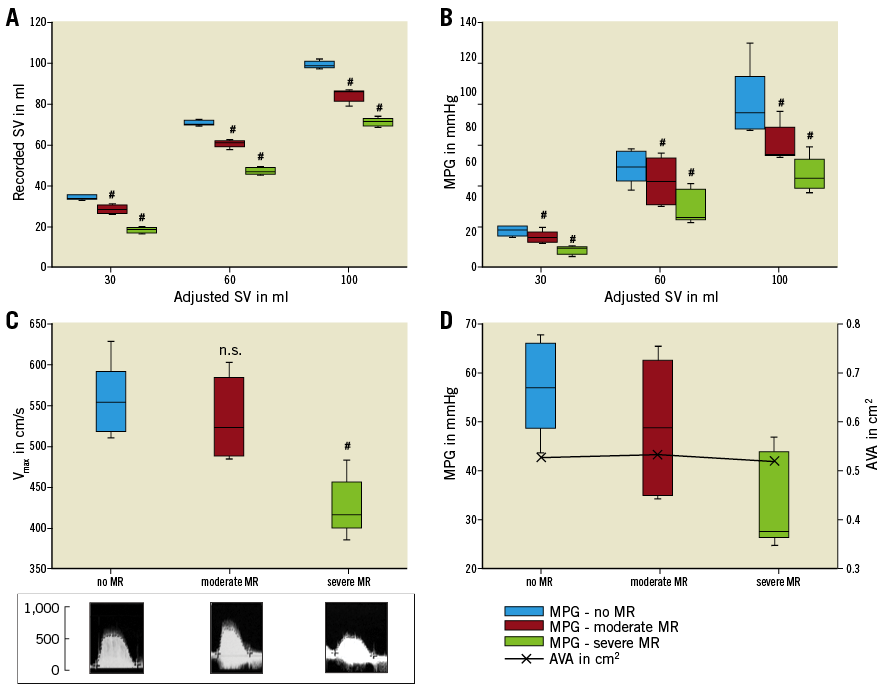
Figure 5. Impact of concomitant MR on transaortic flow, gradient and calculated AVA in severe AS. Concomitant MR results in a significant reduction of forward stroke volume (A), mean pressure gradient (B) and flow velocity (C) across severe aortic stenosis. In contrast, concomitant MR has no effect on AVA (calculated according to continuity equation) (D). The results of each measurement are based on the evaluation of five valves. #: significant (p<0.05) difference between the groups of MR. n.s.: not significant (p≥0.05).
CYCLE 3. IMPACT OF SVR AND ARTERIAL C IN SEVERE AS AND CONCOMITANT MR
To evaluate the effect of changing conditions of SVR or C on aortic haemodynamics with concomitant MR, MPG and AVA were recorded with EROA <0.2 cm² versus EROA >0.4 cm² and with either a stepwise increase of the SVR (600-2,200 dyn×sec×cm–5) or a stepwise increase of arterial C (0.4-2 ml/mmHg).
Neither changes of SVR nor changes of C had an effect on aortic haemodynamics, irrespective of mitral valve function (Figure 6A-Figure 6D).
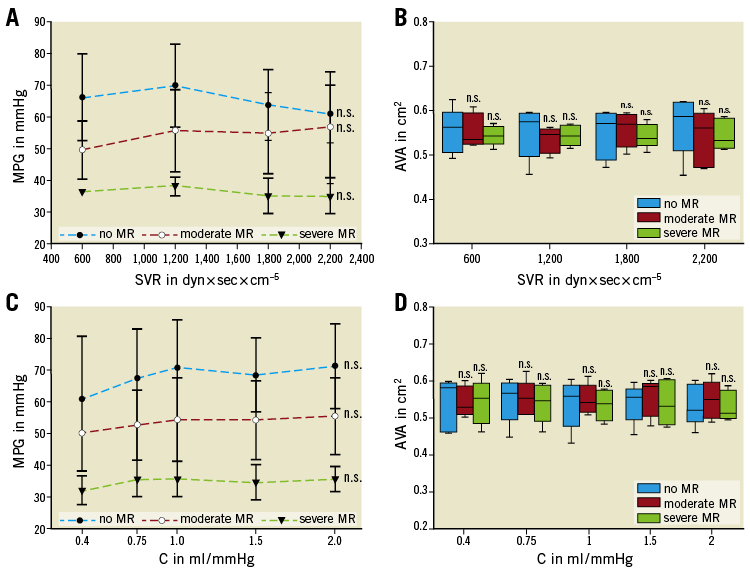
Figure 6. Impact of SVR and compliance on transaortic gradient and aortic valve area. Transaortic MPG and AVA were not affected by changes of SVR (A & B) or compliance (C & D). The results of each measurement are based on the evaluation of five valves. n.s: not significant (p≥0.05).
CYCLE 4. IMPACT OF MAXIMUM LV AFTERLOAD (MINIMAL C, MAXIMAL SVR)
The concept of maximum LV afterload conditions was introduced into the model to unmask potential concordant effects of arterial C and SVR on aortic valve haemodynamics. In vivo, these rather “unphysiologic” conditions can potentially occur under maximum vasoconstriction in a low compliant arterial system and call into question the reliability of non-invasive echocardiographic evaluation of AS outside of physiologic boundaries.
In this experimental set-up, C is minimal (C 0.4 ml/mmHg) and SVR is maximal (SVR=2,200 dyn×sec×cm–5). The following results compare physiologic standard conditions (SV=80 ml; HR=70 bpm; SVR=1,200 dyn×sec×cm–5; C=1 ml/mmHg) with the result of the maximum LV afterload conditions.
In this set-up, only with an AS=0.6 cm² and an MR with EROA >0.4 cm² does the MPG significantly decrease from 58.7±13.7 to 28.1±3.1 mmHg versus standard conditions (no MR: 67.1±10.7 mmHg; EROA >0.4 cm2: 41.1±5.9 mmHg; p=0.02), thus rendering this parameter less reliable for AS evaluation. In contrast, calculated AVA remains stable irrespective of MR severity, SVR or C. Therefore, AVA appears to be a robust parameter for AS evaluation even under maximum LV afterload conditions (Figure 7A, Figure 7B).
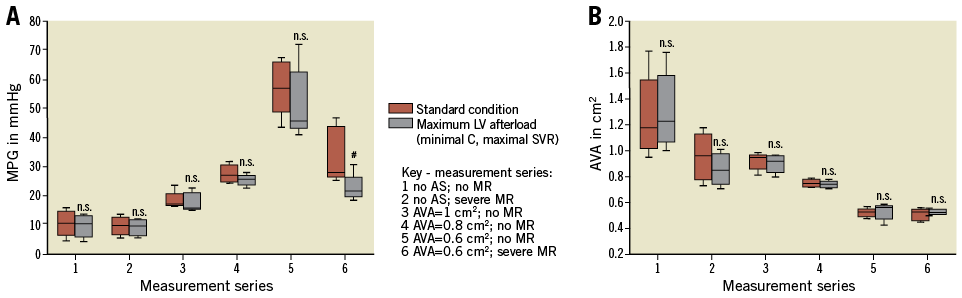
Figure 7. Comparison of MPG and AVA under standard and maximum afterload conditions. A) MPG. B) AVA. The results of each measurement are based on the evaluation of five valves. #: significant (p<0.05) difference between the groups. n.s.: not significant (p≥0.05).
Discussion
Non-invasive echocardiographic evaluation of the aortic valve using Doppler-based calculation of the mean gradient and AVA is generally accepted as a reliable and robust technique for grading aortic stenosis11. However, there is a complex association between transvalvular aortic flow, left ventricular stroke volume, concomitant mitral valve disease and systemic circulatory variables which may impact on the diagnostic accuracy of the standard parameters used for echo evaluation of AS severity. Therefore, the purpose of the present study was to evaluate systematically the effect of the above variables on MPG, Vmax and AVA in an ex vivo circulatory model.
As the present study demonstrates, MPG and Vmax across the aortic valve mainly depend on AVA and LV forward stroke volume. A decrease in AVA and an increase in LV stroke volume results in a rise of MPG and Vmax –a well-established relationship, which is described by the simplified Bernoulli and continuity equations12,13. In the present study, this association is confirmed: an increase of SV results in an increase of MPG and Vmax in all grades of AS severity (measurement cycles 1 & 2). MPG and Vmax are affected by LV forward SV whereas alterations of systemic parameters –such as vascular resistance or arterial compliance– do not impact on these parameters.
As confirmed by the present analysis, changes of SVR and C do not affect the diagnostic accuracy of transaortic MPG or Vmax through a wide physiologic range14,15. This observation is of clinical relevance, as patients with severe AS also frequently present with reduced arterial compliance16. As reported by Briand et al, reduced systemic arterial compliance in patients with severe AS contributes significantly to left ventricular afterload17. The present study now confirms that increased LV afterload itself does not impact on MPG, Vmax and AVA, and therefore does not affect the diagnostic accuracy of echocardiographic evaluation.
However, in the ex vivo model the impact of systemic variables on AS changes profoundly when low arterial compliance coincides with high SVR and severe mitral regurgitation: then, despite severe AS, MPG is significantly reduced (measurement cycle 4) due to a reduction of LV forward stroke volume whereas AVA remains unchanged. Therefore, in this subtype of low-flow, low-gradient AS, MPG and Vmax are not reliable for AS severity grading. Instead, AVA calculated by the continuity equation should preferably be used in this setting as it is independent of flow and seems to be a robust parameter in a wide range of haemodynamic conditions.
In patients with multivalvular heart disease, MR frequently coexists with severe AS18-20. The present study also investigated the effect of concomitant MR on aortic haemodynamics in a wide range of ex vivo scenarios. In all these measurement cycles, severe MR had a significant impact on LV forward stroke volume and resulted in low-gradient AS (cycles 2, 3 and 4). When MR was introduced and EROA increased further from <0.2 cm² to >0.4 cm², forward SV decreased significantly from 70.9±1.1 ml (without MR) to 60.8±1.6 ml (EROA <0.2 cm2) and to 47.4±1.1 ml (EROA >0.4 cm2, p=0.002), whereas MR volume increased proportionally (EROA <0.2 cm²: 13.6±2.4 ml; EROA >0.4 cm²: 27.7±2.8 ml), respectively.
This association between EROA of MR and a reduced transvalvular gradient in patients with severe AS confirms what has been observed clinically and reported as a possible cause of another entity of low-flow, low-gradient AS (LGAS). However, this phenomenon has only been observed in few cases and has not yet been studied systematically21. Although other causes of LGAS –including LV systolic dysfunction or paradoxical low stroke volume with preserved EF– are much better understood, the prevalence of LGAS due to severe MR is probably a very common yet underestimated pathophysiology in patients with low-gradient severe AS1,22-24. However, in patients with multivalvular heart disease, an effect of mitral regurgitation on transaortic gradient has been observed due to the reduction of forward stroke volume25.
In contrast to MPG, AVA remained unchanged irrespective of mitral valve function. In the present study, AVA was 0.53±0.04 cm² without MR and unchanged at 0.52±0.05 cm² with severe MR (p=0.932). Therefore, calculation of AVA seems to be a very robust parameter for evaluation of aortic stenosis severity as it is independent of stroke volume.
Limitations
The purpose of the present study was to investigate the impact and interdependence of systemic haemodynamic parameters and concomitant mitral regurgitation on gradient, flow and AVA and the reliability of these parameters for grading of AS. Although an ex vivo circulatory model allows the isolated adjustment of all of the above variables and thus generates valuable insights into their haemodynamic effect, it only partially reproduces their complex in vivo interaction and cannot reproduce the preload and afterload dependent effects of the Frank-Starling mechanism. Therefore, the above observations require further studies in human physiology.
Conclusions
Systemic haemodynamic variables and concomitant MR may potentially affect transvalvular gradient, flow and AVA in severe aortic stenosis and thus impact on the diagnostic accuracy of non-invasive echocardiographic evaluation of AS. As demonstrated in the present study, MPG and Vmax are flow-dependent and significantly reduced by a reduction of forward SV from concomitant severe MR, resulting in another specific entity of low-flow low-gradient aortic stenosis despite preserved LV function and normal or even elevated LV total stroke volume. In contrast, calculated AVA appears to be a robust parameter of AS evaluation if severe MR is present. Changes of SVR and C did not affect the diagnostic accuracy of AS evaluation. Physicians should be aware of this phenomenon as it has an inherent risk of underestimating AS severity. Further clinical confirmation will be required.
| Impact on daily practice In severe aortic stenosis, mean transvalvular gradient (MPG) and maximum flow velocity (Vmax) are dependent on forward stroke volume (SV). As observed in the present study, MPG and Vmax can be significantly reduced from concomitant severe MR by forward SV reduction, resulting in another specific entity of low-flow, low-gradient aortic stenosis despite preserved LV function and normal or even elevated LV total stroke volume. In contrast, calculated aortic valve area appears to be a robust parameter of AS evaluation if severe MR is present. Physicians should be aware of this phenomenon as it carries an inherent risk of underestimating AS severity. |
Acknowledgements
The authors thank Mrs Annette Schmidt, FSU Jena, for her assistance in conducting the above experiments.
Funding
Friedrich-Schiller University Jena, Institutional Funding (no grant number).
Conflict of interest statement
The authors have no conflicts of interest to declare.