Abstract
Background: The detrimental effects of long-standing severe aortic stenosis (AS) often include left ventricular hypertrophy (LVH) and exhaustion of coronary flow reserve (CFR), the reversibility of which is unclear after valve replacement.
Aims: Our aims were to 1) investigate whether CFR in the left anterior descending artery (LAD) would improve following valve replacement, and if the change was related to changes in hyperaemic coronary flow (QLAD) and minimal microvascular resistance (Rμ,LAD); and 2) investigate the relationship between changes in CFR and changes in left ventricular mass (LVM) and stroke work (LVSW).
Methods: We measured intracoronary bolus thermodilution-derived CFR, and continuous thermodilution-derived QLAD and Rμ,LAD before and 6 months after aortic valve replacement. Cardiac magnetic resonance imaging was used to quantify left ventricular anatomy and function for the calculation of LVM and LVSW.
Results: Thirty-four patients were included (17 patients had transcatheter aortic valve implantation; 14 had surgical valve replacement with a bioprosthesis and 3 with a mechanical prosthesis) who underwent invasive assessment in the LAD. CFR increased from 2.5 (interquartile range [IQR] 1.5-3.3) at baseline to 3.1 (IQR 2.2-5.1) at follow-up (p=0.005), despite no significant change in QLAD (230±106 mL/min to 250±101 mL/min; p=0.26) or Rμ,LAD (347 [IQR 247-463] to 287 [IQR 230-456]; p=0.20). When indexed for LVM, QLAD was 39% (IQR 8-98%) higher at follow-up compared with baseline (p<0.001). The improvement in CFR was correlated with ΔLVSW, r= −0.39; p=0.047.
Conclusions: CFR in the LAD increased significantly at follow-up although global hyperaemic flow and minimal microvascular resistance remained unchanged. Thus, a decrease in resting flow was the cause of CFR improvement. CFR improvement was associated with reduction in LVSW.
Introduction
The impact of long-standing severe aortic stenosis (AS) often extends beyond the aortic valve, i.e., the myocardium of the left ventricle becomes hypertrophied1, and the coronary flow reserve (CFR) is exhausted2; both predicting an unfavourable prognosis3456. Although regression of left ventricular hypertrophy (LVH) after valve replacement is a well-documented phenomenon3789, the reversibility of coronary physiological abnormalities is less clear. Several small studies have compared long-term changes in coronary haemodynamics after valve replacement in patients without coronary lesions, but have reported conflicting findings including both unchanged and increased CFR81011121314. Today it is possible to characterise coronary haemodynamics invasively with bolus thermodilution-derived CFR15 and continuous thermodilution-derived absolute coronary blood flow and resistance16. We used these techniques in the left anterior descending coronary artery (LAD), in combination with cardiac magnetic resonance imaging (CMR), to quantify myocardial mass and left ventricular stroke work. Our study population consisted of patients with severe AS without focal epicardial lesions. They underwent coronary physiological assessment and CMR before and 6 months after aortic valve replacement. The LAD was chosen due to its large myocardial territory and exclusive supply to the left ventricle which is subjected to the AS-induced pressure overload. As such, we reasoned that changes induced by valve replacement would be most pronounced in the LAD. Our aims were 1) to investigate whether CFR would change following valve replacement and if the change was due to a change in absolute hyperaemic blood flow (QLAD) and the minimal microvascular resistance (Rμ,LAD); and 2) to investigate the relationship between the change in CFR and the change in left ventricular stroke work (LVsw). We hypothesised that CFR would would improve at follow-up and that it would change in proportion with the change in LVsw.
Methods
Study design and patient population
This was a prospective observational study undertaken in two centres. Inclusion required severe AS and a Heart Team referral for either surgical aortic valve replacement (SAVR) or transcatheter aortic valve implantation (TAVI). Exclusion criteria were left ventricular ejection fraction (LVEF) <45%, estimated glomerular filtration rate <30 mL/min/1.73m2, focal coronary lesions with diameter stenosis >50%, and moderate or severe disease in other heart valves. Indices of AS severity were derived from echocardiography according to guidelines17. Coronary physiology was assessed following a diagnostic coronary angiogram performed as part of a routine work-up before aortic valve replacement. CMR was performed after coronary angiography but before valve replacement. A follow-up angiography with coronary physiological measurements as well as CMR was performed 6 months after TAVI/SAVR. The study complied with the Declaration of Helsinki, and the protocol was approved by the regional research ethics committee. All patients provided informed written consent.
Coronary catheterisation
Coronary catheterisation was performed via radial access using a 6 Fr sheath and 6 Fr guide catheter. As per standard practice, patients were given intravenous heparin (100 IU/kg plus supplemental heparin every 30 minutes to achieve an activated clotting time [ACT] of 250-350 s) and intracoronary nitroglycerine (0.2 mg). Invasive physiological measurements were performed in the LAD in all patients using a sensor-tipped guidewire for combined pressure and temperature measurement (PressureWire X; Abbott). Wire pressure and aortic pressure were equalised with the pressure sensor positioned at the tip of the guide catheter. All data from the guidewire were transmitted wirelessly to a computer with dedicated software (CoroFlow v.3.01; Coroventis). Physiological indices included CFR15 and index of microcirculatory resistance (IMR)18 measured with a bolus thermodilution of saline, whereas QLAD and Rμ,LAD were measured with continuous saline thermodilution using a dedicated infusion catheter (RayFlow; Hexacath)16. For CFR and IMR measurements, hyperaemia was induced with intravenous adenosine infusion (140 μg/kg/min). For QLAD and Rμ,LAD measurements, hyperaemia was induced by the saline infusion which was set to 20 mL/min19. The positions of the guidewire and infusion catheter were recorded angiographically at baseline and used for reference during the follow-up procedure.
Bolus thermodilution
The mean transit time (Tmn) of blood through a fixed volume of a vessel is inversely related to the volumetric flow rate through that same volume, such that a short Tmn corresponds to a large flow rate and vice versa. Tmn can therefore be considered as a surrogate for volumetric flow. Tmn was derived by the software based on thermodilution curves generated by the quick injection of a 3 mL bolus of room-temperature saline directly into the coronary artery through the guide catheter. The ratio of the average of three Tmn measurements at rest and during hyperaemia was used to calculate CFR15. IMR utilises the property of Tmn as a flow surrogate to express microvascular resistance. IMR is defined as Pd∙Tmn where Pd is the distal coronary pressure. IMR is measured during maximal hyperaemia.
Continuous thermodilution
Room-temperature saline was infused via a pump (Angiomat Illumena; Liebel-Flarsheim) into the proximal part of the LAD such that flow in its entire territory was measured16. The guidewire was placed 4-6 cm distal to that point and thus measured the temperature of the mixed blood and saline. With the mixed temperature (T), the infusion temperature (Ti), and the infusion rate (Qi), the software calculated QLAD as
QLAD=Qi∙(Ti/T)∙1.08 [mL∙min-1]
The constant 1.08 accounts for differences in the specific heat capacity of blood and saline20. Using the simultaneously recorded Pd, the software calculated Rμ,LAD as
Rμ,LAD=Pd/QLAD [mmHg∙min∙L-1]
mmHg∙min∙L-1 is also known as Wood Units. We assumed that the ratio of the LAD territory to the total left ventricular mass (LVM) did not change after valve replacement. Based on this assumption we calculated the relative change in QLAD indexed to LVM from baseline to follow-up. Likewise, to estimate the relative change in resting flow per gram of myocardium, we calculated the relative change in resting Tmn indexed to LVM (calculated as 1/[Tmn∙LVM]).
Cardiac magnetic resonance
CMR was performed on a 1.5 Tesla scanner (MAGNETOM Aera; Siemens). Scout images and electrocardiographic (ECG)-gated breath hold steady-state free precession (SSFP) images in 2-, 4-, and 3-chamber views were used to prepare short-axis (SAX) plane imaging. An ECG-triggered balanced SSFP SAX cine stack consisting of adjoining 10 mm slices perpendicular to the septum was used to calculate left ventricular mass, volume and function. Endocardial and epicardial contours were traced using the automatic tracing function and then reviewed individually for accuracy and adjusted when necessary. LVM was measured in end-diastole and included the papillary muscles. CMR analyses were done blinded to coronary physiological data, using dedicated software (cvi42 v5.11.2; Circle Cardiovascular Imaging). Body surface area (BSA), was calculated using the formula by Tikuisis et al21. LVH was defined as LVM/BSA >74 g/m2 for women and >87 g/m2 for men22. In patients without a baseline CMR, the change in LVM was not available. In these patients, the baseline LVM was derived from computed tomography (CT) and used to determine if LVH was present using CT-specific cut-offs for LVM/BSA23. LVM concentricity was estimated as LVM divided by left ventricular end-diastolic volume24. The upper limit for men was defined as 0.9 g/mL and 0.8 g/mL for women22.
Left ventricular stroke work
Left ventricular stroke work (LVsw) before and after valve replacement was calculated as the sum of the mean aortic valve gradient (MG) and systolic arterial blood pressure times left ventricular stroke volume (SV)25. We reported LVsw using the unit centijoule (cJ). Indexed LVsw (LVsw,index) was calculated with SV indexed to BSA. Stroke work density (LVswd) was calculated as LVsw/LVM.
Statistical analysis
Continuous variables are expressed as mean±standard deviation (SD) or median and interquartile range. Categorical variables are expressed as percentages. Changes in continuous paired data points (CFR, Rμ, LVM, etc.) were tested with Wilcoxon’s signed-rank test or the paired t-test. McNemar’s test was used for changes in paired categorical variables. Correlations were tested with Pearson’s or Spearman’s correlation. The predictive power of changes in left ventricular stroke work on measures of coronary physiology and LVM was tested with linear regression. Two-tailed p-values <0.05 were considered significant. SPSS Statistics for Windows, version 25 (IBM) was used for statistical analyses, and figures were made in Prism version 9.0 for Windows (GraphPad) and at BioRender.com.
Results
A total of 34 patients with a mean age of 72±8 years were included and underwent assessment of coronary physiology in the LAD before and 6 months after valve replacement. None of the patients underwent revascularisation of any coronary artery during the follow-up period. Twenty-four (71%) had a tricuspid native valve. Seventeen (50%) patients underwent TAVI, 14 (41%) SAVR with a biological valve and 3 (9%) SAVR with a mechanical valve. In 7 cases, gathering complete CMR data was not possible due to logistical reasons (n=4), pacemaker implantation after valve replacement (n=2) and unacknowledged claustrophobia (n=1). The left ventricular mass index (LVMi) ranged from 53 g/m2 to 117 g/m2 at baseline, where 17 (50%) patients had LVH. General characteristics for the cohort at baseline and follow-up are summarised in Table 1.
Table 1. Patient characteristics at baseline and 6-month follow-up
| Baseline (n=34) | Follow-up | p-value | ||
|---|---|---|---|---|
| Male sex | 22 (65) | - | - | |
| Age, years | 72±8 | - | - | |
| Comorbidities | Diabetes | 5 (15) | - | - |
| Hypercholesterolaemia | 20 (59) | - | - | |
| Hypertension | 24 (71) | - | - | |
| Previous MI* | 1 (3) | - | - | |
| Previous PCI | 3 (9) | - | - | |
| Symptoms | NYHA II-IV | 29 (85) | 7 (21) | <0.001 |
| Angina (CCS 1-4) | 18 (53) | 3 (9) | <0.001 | |
| Medication | Statin | 22 (65) | 23 (68) | 1.00 |
| Beta blocker | 9 (26) | 11 (32) | 0.63 | |
| Calcium-channel blocker | 6 (18) | 11 (32) | 0.06 | |
| Nitroglycerine | 3 (9) | 0 (0) | 0.25 | |
| ARB or ACE inhibitor | 18 (53) | 20 (59) | 0.50 | |
| Thiazides | 7 (21) | 10 (29) | 0.45 | |
| Loop-diuretics | 3 (9) | 4 (12) | 1.00 | |
| Aldosterone antagonists | 1 (3) | 3 (9) | 0.50 | |
| Biochemistry | Creatinine, µmol/L | 87 (73-99) | 84 (71-93) | 0.35 |
| eGFR, mL/min/1.73m2 | 74 (60-85) | 74 (65-84) | 0.46 | |
| proBNP, pmol/L | 36 (20-112) | 21 (11-33) | 0.009 | |
| Haemoglobin, mmol/L | 8.7±1.0 | 8.1±0.9 | <0.001 | |
| Aortic stenosis severity | AVA (VTI), cm2 | 0.73±0.19 | 2.02±0.61 | <0.001 |
| MG, mmHg | 51±15 | 11±6 | <0.001 | |
| PG, mmHg | 81±24 | 20±10 | <0.001 | |
| Moderate AR | 3 (9) | 1 (3) | 0.63 | |
| Data are presented as number (%), mean±SD or median and 25-50% percentiles. *The one patient with previous MI had their MI >12 months before enrolment in this study.ACE: angiotensin converting enzyme; AR: aortic regurgitation; ARB: angiotensin II receptor blocker; AVA: aortic valve area; CCS: Canadian Cardiovascular Society angina score; eGFR: estimated glomerular filtration rate; MG: mean aortic valve pressure gradient; MI: myocardial infarction; NYHA: New York Heart Association Functional Class; PCI: percutaneous coronary intervention; PG: peak aortic valve pressure gradient; proBNP: pro-brain natriuretic peptide; VTI: velocity time integral | ||||
Changes in myocardial mass and left ventricular stroke work
There was a mean reduction of 18.5 g/m2 (20%) in LVMi and a mean reduction of 0.26 g/mL (19%) in LV concentricity; p<0.001 for both (Table 2). LVsw decreased from 20.8±3.8 cJ to 17.9±6.4 cJ (p=0.04) and LVsw,index from 10.4±2.2 cJ/m2 to 8.9±3.1 cJ/m2 (p=0.03). Accordingly, proBNP was significantly reduced following valve replacement (Table 1). LVswd did not change from baseline to follow-up (0.12±0.03 cJ/g vs 0.13±0.04 cJ/g; p=0.32).
Table 2. Cardiac magnetic resonance imaging characteristics at baseline and follow-up.
| Baseline | Follow-up | p-value | |
|---|---|---|---|
| LVEF, % | 66±10 | 70±7 | 0.08 |
| LVEDVi, mL/m2 | 70±15 | 69±14 | 0.70 |
| LVESVi, mL/m2 | 25±12 | 21±7 | 0.12 |
| SVi, mL/m2 | 46±8 | 48±10 | 0.25 |
| CI, L/min/m2 | 3.1 (2.9-3.6) | 3.2 (3.0-4.0) | 0.34 |
| Heart rate, min–1 | 72±11 | 72±10 | 0.99 |
| LVM, g | 174±43 | 137±36 | <0.001 |
| LVMi, g/m2 | 86±21 | 68±15 | <0.001 |
| Concentricity, g/mL | 1.26±0.38 | 1.00±0.26 | <0.001 |
| Data are presented as mean±SD or median and 25-50% percentiles. Data only shown for patients with cardiac magnetic resonance data (n=27). BSA: body surface area; CI: cardiac index; LVEDVi: left ventricular end-diastolic volume indexed to BSA; LVEF: left ventricular ejection fraction; LVESVi: left ventricular end-systolic volume indexed to BSA; LVM: left ventricular mass; LVMi: left ventricular mass indexed to BSA; LVSD: left ventricular systolic diameter; SVi: stroke volume indexed to BSA | |||
Changes in coronary physiology
Fractional flow reserve (FFR), IMR, QLAD and Rμ,LAD were not significantly different at follow-up compared with baseline (Table 3). Although there were no net changes in QLAD and Rμ,LAD, they showed considerable changes on the individual patient level (Figure 1). Moreover, QLAD indexed to LVM was 39% (IQR 8-98%) higher at follow-up compared with baseline (p<0.001). Median CFR improved significantly at follow-up (Table 3), with 24 (71%) patients showing an increased CFR (Figure 2). In patients undergoing TAVI, CFR improved in 14 (82%) cases, as opposed to 10 (59%) cases in those patients undergoing SAVR (p=0.13). Resting mean transit time – a surrogate for resting flow – was significantly longer at follow-up, whereas hyperaemic transit time was unchanged (Table 3, Figure 3). Resting mean transit time indexed to LVM did not change after valve replacement (4% [IQR -27 to 26%] lower at follow-up compared with baseline; p=0.61).
Table 3. Coronary physiology in the left anterior descending artery at baseline and follow-up.
| Baseline | Follow-up | p-value | |
|---|---|---|---|
| Heart rate, min–1 | 79±13 | 81±9 | 0.26 |
| Pd, rest, mmHg | 76±13 | 77±12 | 0.85 |
| Pa, rest, mmHg | 82±14 | 82±13 | 0.96 |
| Pd/Pa, rest | 0.93 (0.92-0.95) | 0.95 (0.92-0.97) | 0.40 |
| Pd, hyperaemia, mmHg |
65±16 | 67±14 | 0.60 |
| Pa, hyperaemia, mmHg |
73±17 | 74±13 | 0.73 |
| FFR | 0.90 (0.87-0.92) | 0.91(0.87-0.95) | 0.39 |
| Resting Tmn, sec | 0.51±0.38 | 0.71±0.50 | 0.005 |
| Hyperaemic Tmn, sec | 0.20±0.12 | 0.19±0.11 | 0.52 |
| CFR | 2.5 (1.5-3.3) | 3.1 (2.2-5.1) | 0.005* |
| IMR, mmHg∙sec | 13±8 | 13±7 | 1.00 |
| QLAD, mL/min | 230±106 | 250±101 | 0.26 |
| Rµ,LAD, WU | 347 (247-463) | 287 (230-456) | 0.20 |
| Data are presented as mean±SD or median and 25-50% percentiles. *Results were similar with FFR corrected CFR. CFR: coronary flow reserve; FFR: fractional flow reserve; IMR: index of microcirculatory resistance; LAD: left anterior descending artery; Pa: aortic blood pressure; Pd: distal coronary blood pressure; QLAD: absolute hyperaemic coronary flow in the LAD; Rµ,LAD: minimal microvascular resistance in the LAD; Tmn: mean transit time; WU: Wood Units | |||
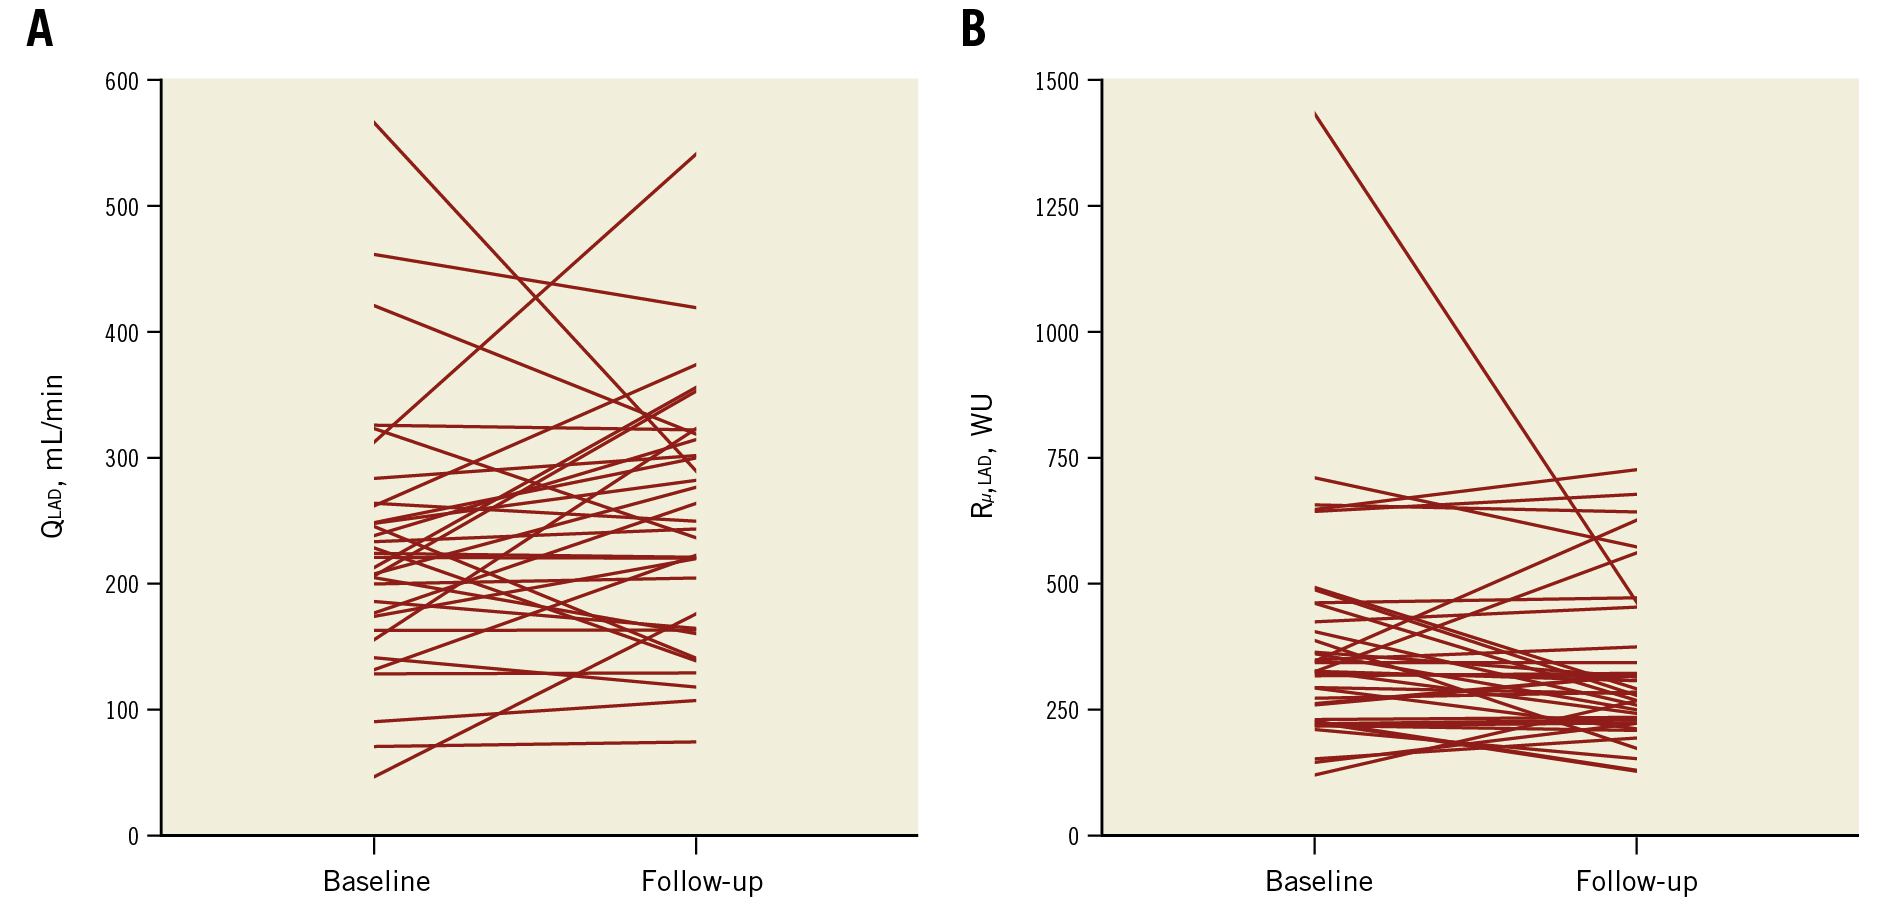
Figure 1. Patient-level changes in hyperaemic flow and microvascular resistance. A) Patient-level changes in hyperaemic blood flow (QLAD) and B) minimal microvascular resistance (Rµ,LAD) in the LAD. LAD: left anterior descending artery; WU: Wood Units Patient-level changes in hyperaemic flow and microvascular resistance. A) Patient-level changes in hyperaemic blood flow (QLAD) and B) minimal microvascular resistance (Rµ,LAD) in the LAD. LAD: left anterior descending artery; WU: Wood Units
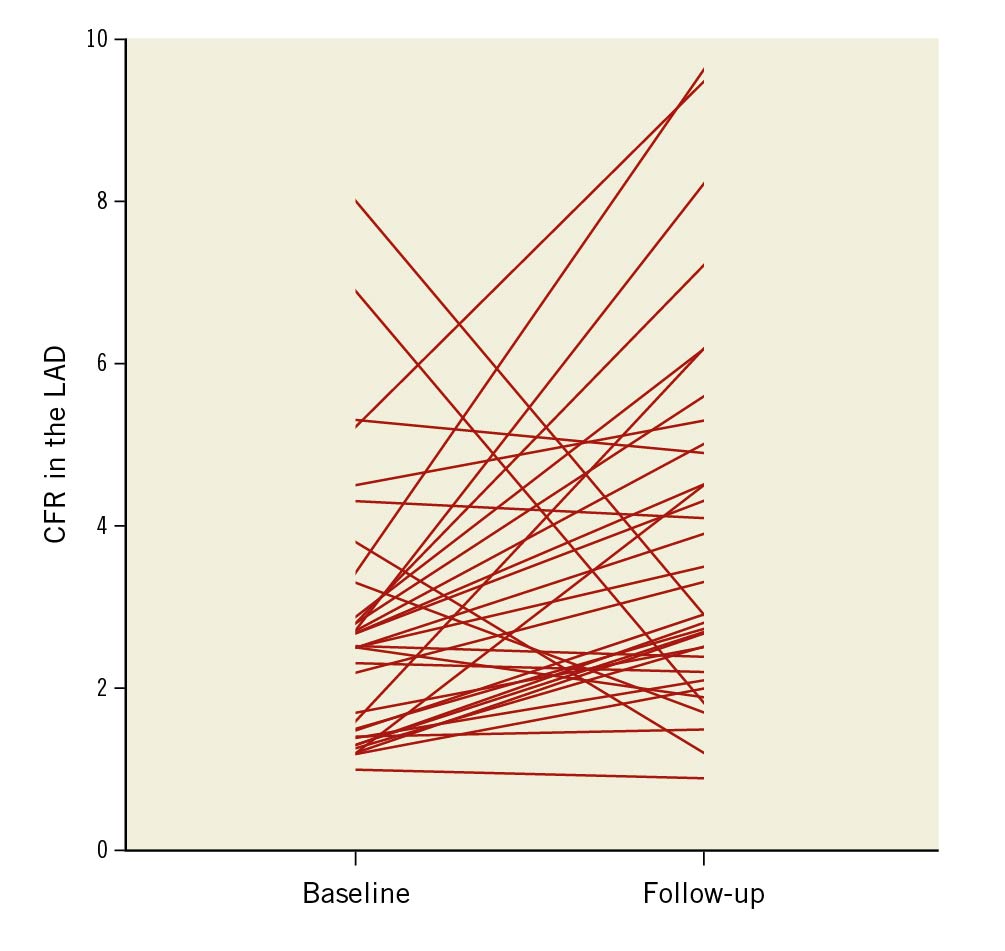
Figure 2. Patient-level changes in CFR. LAD CFR at 6-month follow-up after aortic valve replacement. CFR: coronary flow reserve; LAD: left anterior descending artery
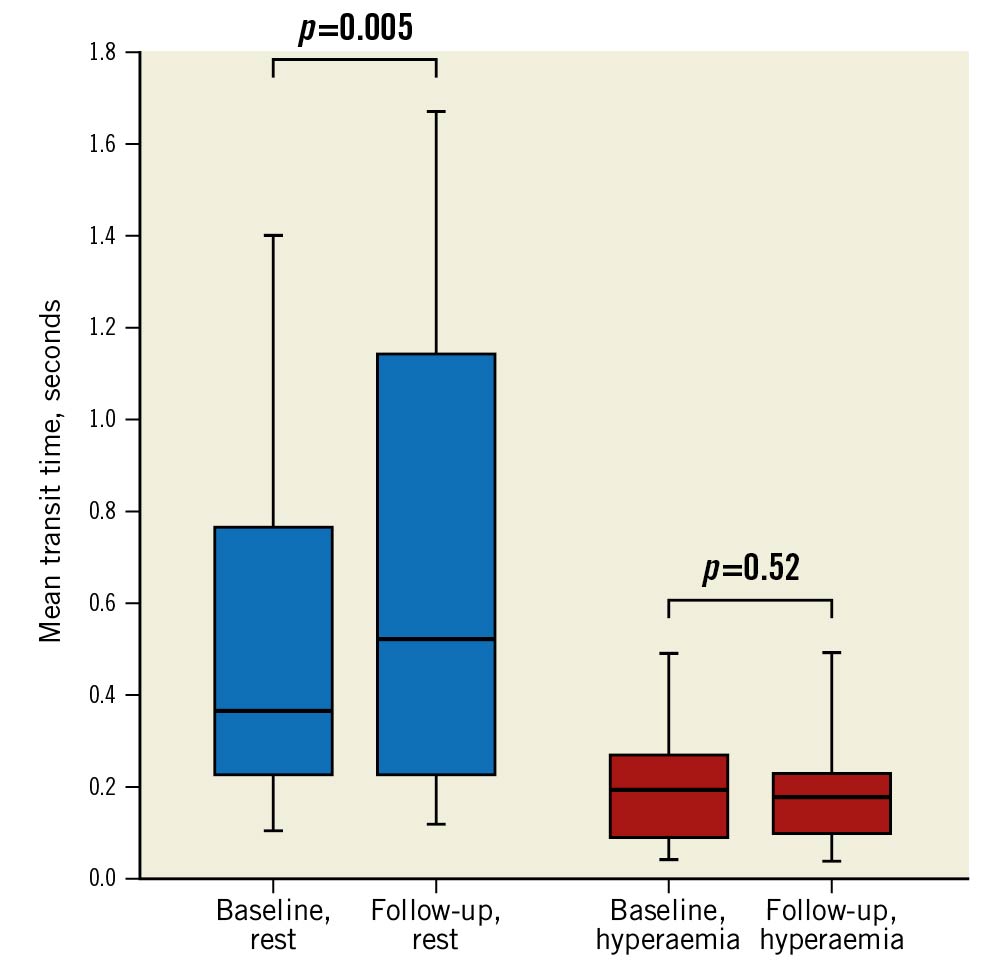
Figure 3. Baseline and follow-up mean transit times in the LAD. Box and whisker plot of the changes in resting and hyperaemic mean transit times from baseline to follow-up after aortic valve replacement. The centre line represents the median; the edges of the boxes show the interquartile range; the whiskers represent the minimum and maximum values. LAD: left anterior descending artery
Correlations between LV stroke work, mass and coronary physiology
Absolute reduction in LVsw,index was correlated with absolute reduction in LVMi (r=0.48; p=0.01). Likewise, a reduction in LVsw,index and LVMi predicted the increase in resting Tmn (Figure 4, Figure 5).
The absolute reduction in LVsw,index was correlated with both the increase in CFR and with follow-up CFR (r= −0.39; p=0.047 and r= −0.40; p=0.041, respectively; similar results with ΔLVsw). However, ΔLVMi was not significantly correlated with ΔCFR or follow-up CFR (r= −0.30; p=0.13 and r= −0.22; p=0.27, respectively). There was no significant correlation between baseline LVsw and LVM (r=0.23; p=0.09), but at follow-up the correlation was significant (r=0.52; p=0.005). Finally, LVMi was not correlated with CFR at baseline or at follow-up, r= −0.03; p=0.87 and r= −0.10; p=0.62, respectively.
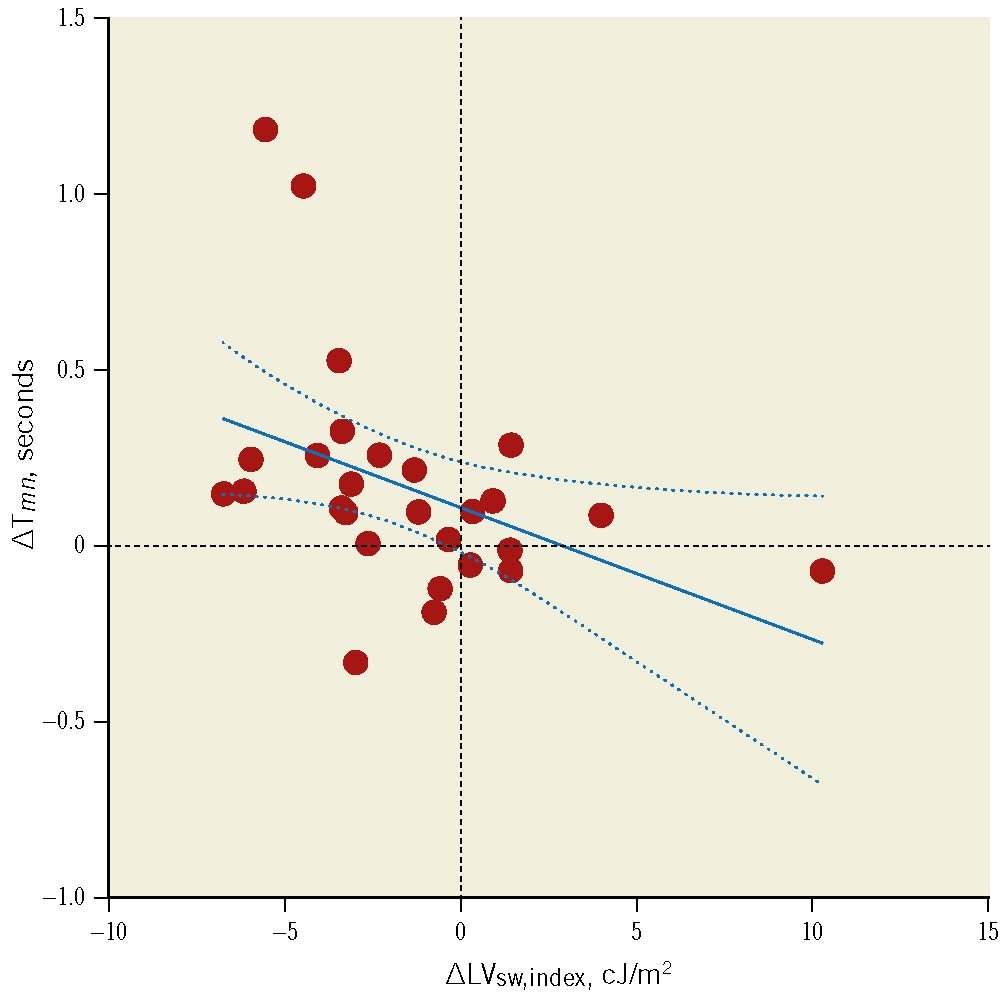
Figure 4. Change in left ventricular stroke index vs change in resting mean transit time. Association between the change in left ventricular stroke work indexed to body surface area (∆LVsw,index, x-axis) and the change in resting mean transit time (∆Tmn, y-axis). Results were similar with ∆LVsw. Regression line equation: y= −0.03765x+0.1144, r= −0.42; p=0.03 (Spearman’s rho= −0.56; p=0.002). Dashed lines represent 95% confidence intervals. cJ: centijoule
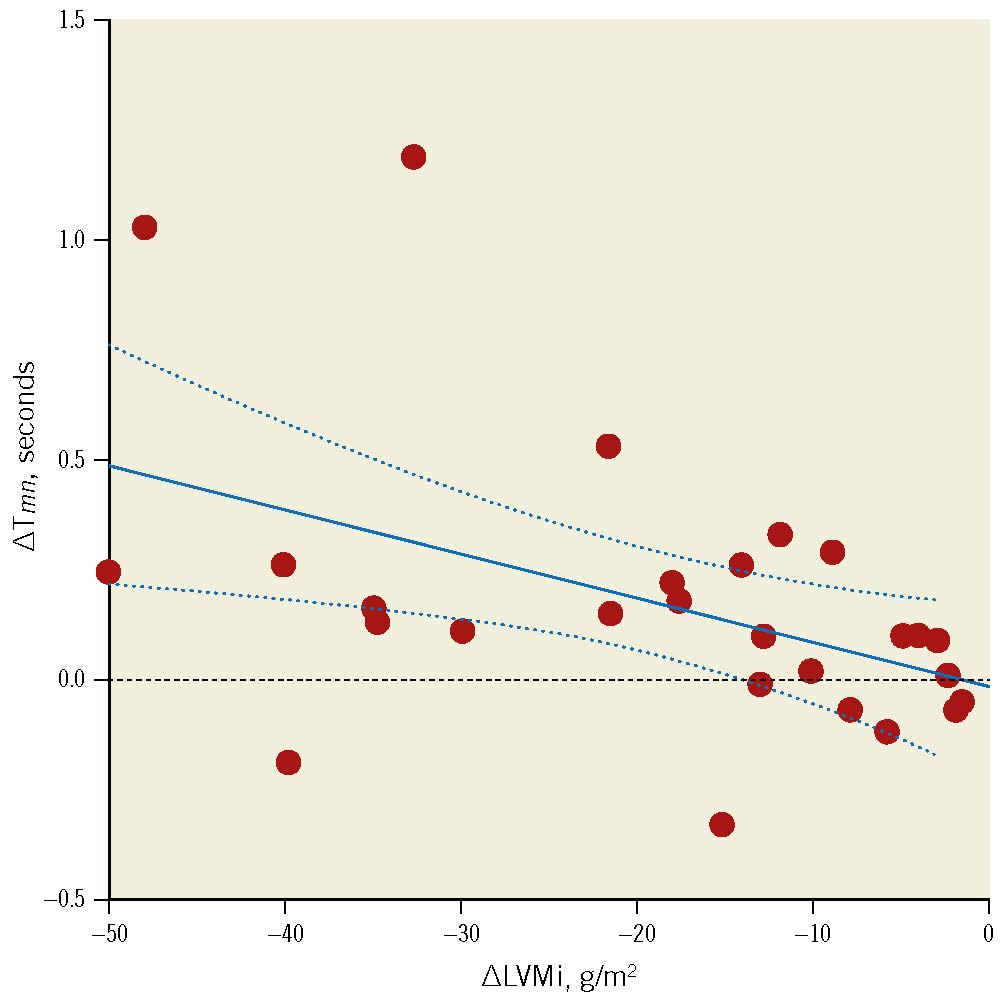
Figure 5. Change in left ventricular mass index vs change in resting transit mean time. Association between the change in left ventricular mass index (∆LVMi) and the change in resting mean transit time (∆Tmn). Regression line equation: y=−9.98∙10−3x–0.01, r= –0.46; p=0.015 (Spearman’s rho= –0.51; p=0.007). Dashed lines represent 95% confidence intervals.
Discussion
This study explored the long-term effects of aortic valve replacement on coronary physiology in the LAD in patients with severe AS. The main findings were 1) CFR in the LAD increased significantly at follow-up despite no significant changes in QLAD or Rμ,LAD, and 2) the improvement in CFR was associated with a reduction in ΔLVsw.
LVM decreased at follow-up compared with baseline. Therefore, the results of this study are discussed from both a global and regional vantage point, i.e., without indexing to LVM and after indexing to LVM, respectively.
Minimal microvascular resistance
Rμ,LAD was numerically lower at follow-up, but surprisingly, the difference was not significant. It is commonly assumed that severe AS increases microvascular resistance due to intramyocardial compression of the vascular bed. As such, one would expect Rμ,LAD to be consistently lower after valve replacement. However, our results suggest that Rμ,LAD in the LAD territory was largely unaffected by the presence of severe AS, as has been shown in animal models26. In fact, both baseline and follow-up values of Rμ,LAD in the present study were comparable to that of normal controls, estimated by Fournier et al to be 325 WU27. Likewise, Lumley et al found similar minimal microvascular resistance in patients with severe AS and healthy controls28. Lastly, we found the IMR to be unchanged at follow-up, which is in line with the finding of comparable IMR in AS patients and controls by Nishi et al29.
These results may be interpreted as an impaired ability of the vascular bed to proliferate and adapt to the increases in myocardial mass and workload associated with severe AS303132. However, it is unclear if this represents a true physiological failure mode. It may be such that concentric remodelling of the left ventricle facilitates a more efficient contraction in terms of oxygen consumption, and thus attenuates the need for adaptive expansion of the vascular bed in the face of greater stroke work. The increased myocardial intercapillary distance in LVH due to pressure overload33 may result in a larger oxygen gradient, which in turn could increase oxygen extraction and thus limit the need for increasing blood flow (through lower microvascular resistance). Another aspect is the fact that Rμ,LAD is measured under maximal hyperaemia. As such, it represents the upper limit of the system. Physiologically, this limit is determined by the maximal myocardial demand. Patients with severe AS likely do not reach this limit as they tend to restrict physical exertion to curb symptoms and are usually instructed to avoid physical exertion until after valve replacement. As such, one may assume that there is no strong stimulus coercing the heart to lower minimal microvascular resistance beyond what may be considered a default level. Instead, increased myocardial demand due to AS seems to be accommodated simply by seizing more of the CFR; it is not obvious that this in and of itself would constitute a strong physiological signal for proliferative remodelling of the vascular bed.
Changes in CFR, stroke work and left ventricular mass
On the global scale, CFR did not improve because of a higher QLAD but rather due to a lowered resting flow, as evidenced by the significantly longer resting Tmn at follow-up. However, on the regional scale, matters appeared reversed; here results indicated that CFR increased because of a higher hyperaemic flow per gram of myocardium whereas mass-indexed resting flow – expressed through the surrogate Tmn – remained constant. These results were mirrored in the global and regional left ventricular stroke work; we found a significant drop in global stroke work but no change in stroke work per gram of myocardium. Reduction in global stroke work did in fact predict the increase in resting Tmn and was significantly correlated with both the increase in CFR and the actual CFR at follow-up.
Interestingly, the reduction in LVMi was not significantly associated with the improvement in CFR, echoing previous reports1213. This suggests that CFR is not as closely related to myocardial mass as it is to stroke work. Although LVM is usually supposed to be calibrated to cardiac work, the existence of so-called inappropriate hypertrophy is well documented1. Another explanation for the lack of correlation between CFR and LVMi is that half of the patients in this cohort did not have LVH at baseline despite the presence of severe AS. Finally, we found no correlation between LVsw and LVM at baseline. Thus, before valve replacement, LVH may simply be an unreliable bystander to the actual cause of CFR exhaustion, which is increased LVsw. The Central illustration provides a summary of the study results.
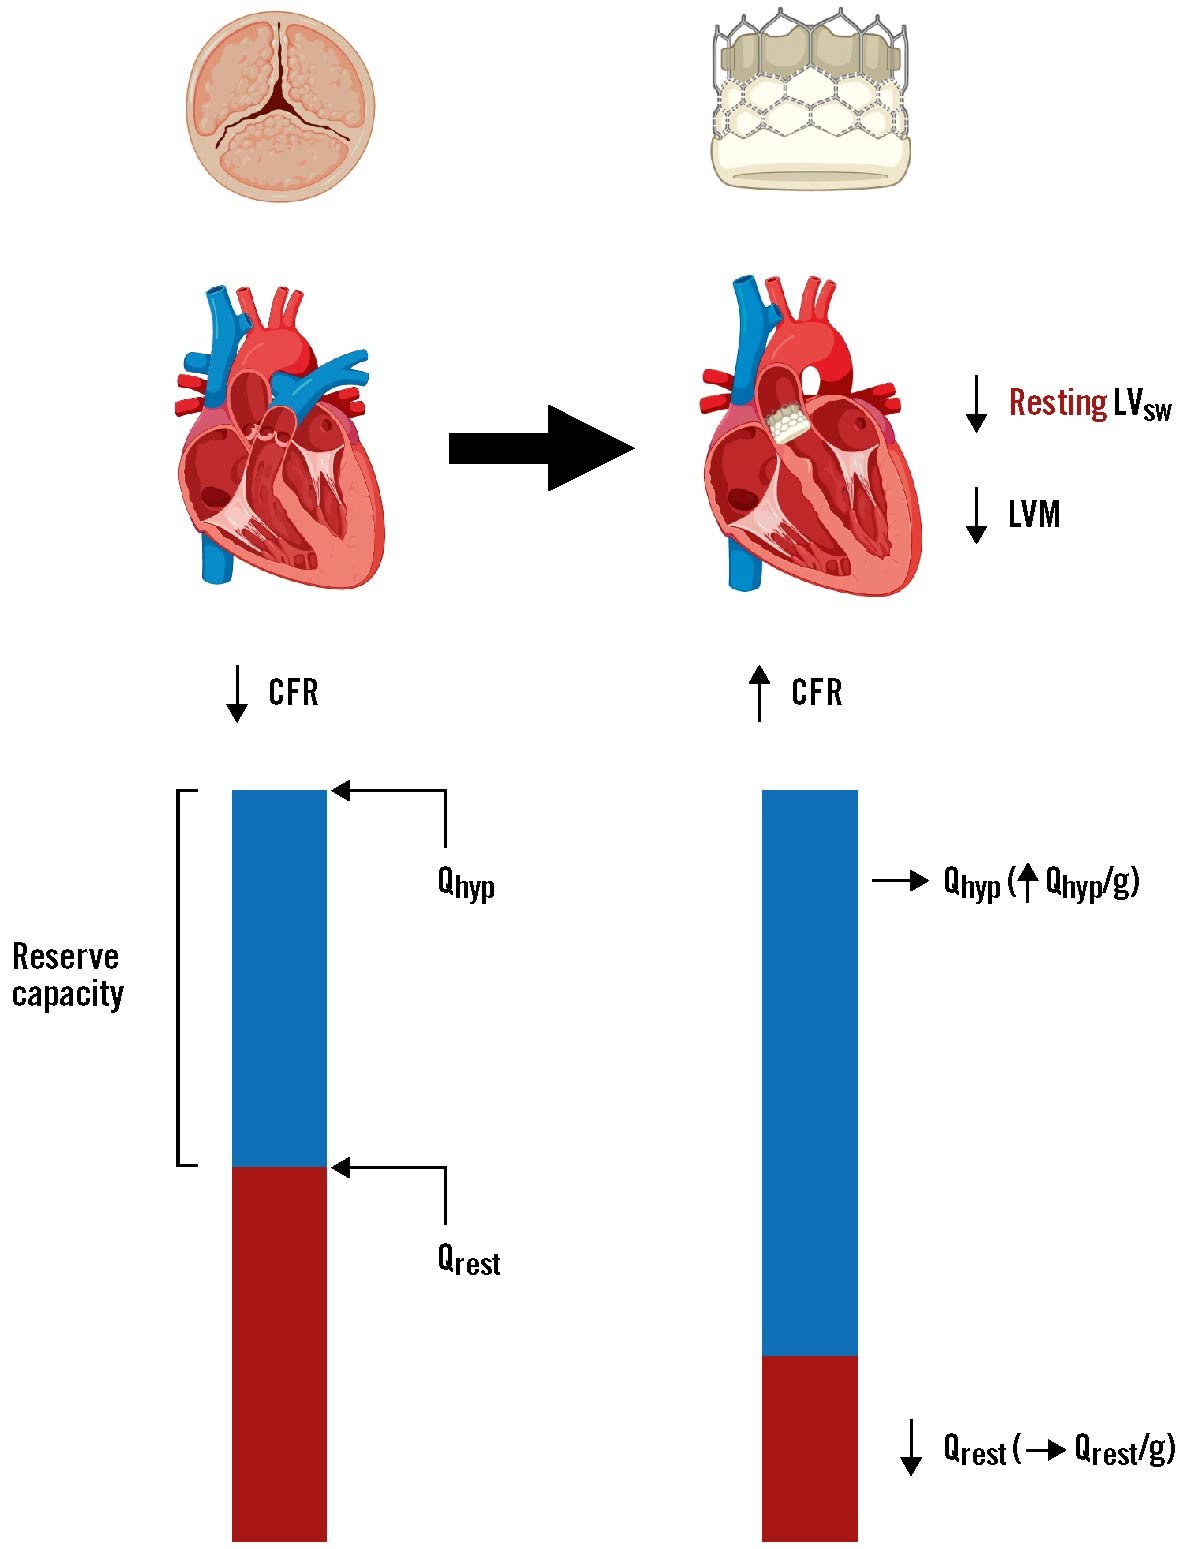
Central illustration. Summary of the changes in left ventricular stroke work, CFR and hyperaemic and resting flow after aortic valve replacement. Underlying changes mediating the improvement of coronary flow reserve (CFR) in the left anterior descending artery (LAD) following aortic valve replacement. The increase in CFR after valve replacement was driven predominantly by a decrease in global resting flow (Qrest), with little to no change in global hyperaemic flow (Qhyp). However, because left ventricular mass (LVM) was significantly reduced at follow-up, Qhyp per gram of myocardium was significantly higher relative to baseline. Thus, valve replacement lowers resting flow and increases regional hyperaemic flow in tandem with regression of left ventricular hypertrophy. Note, Qrest is used here for simplicity, in place of resting mean transit time which was the surrogate for resting flow we measured in the present study. LVsw: left ventricular stroke work
Potential clinical implications
As explained above, severe AS does not necessarily involve microvascular dysfunction per se2829. Instead, it appears that there is a fixed global “vascular ceiling” which is gradually reached at rest as stroke work increases progressively, ultimately resulting in reduced CFR. Relieving the patients from their valvular stenosis appeared to reverse this process in more than two-thirds of cases in this cohort. This is important in terms of understanding the impact of severe AS on commonly used pressure indices of coronary stenosis severity, such as fractional flow reserve (FFR) and the various non-hyperaemic indices currently in clinical use, e.g., instantaneous wave-free ratio (iFR) and resting full-cycle ratio (RFR); because, although regional hyperaemic flow is higher after valve replacement, global hyperaemic flow does not change appreciably in the LAD, and it is the latter on which FFR is based. As such, FFR ought to generally remain stable after valve replacement34. On the other hand, iFR and RFR – both of which are based on resting global flow – would be expected to be affected by valve replacement, as lower global resting flow results in a lower trans-stenotic pressure drop and thus a higher pressure ratio across a given coronary stenosis.
Limitations
This was an exploratory study with a limited sample size, yet it is the largest study of this type to date in patients with severe AS81011121314. Ideally, resting coronary blood flow and resting microvascular resistance should have been measured with continuous saline thermodilution, as bolus thermodilution-derived mean transit time is associated with larger variations under resting conditions. However, it was not known to be possible at the time study data were collected. It was only recently demonstrated that resting blood flow and baseline myocardial resistance can be measured with continuous saline thermodilution3536. However, resting Tmn served as a surrogate for resting flow in the sense that it allowed us to detect changes in serial measurements. The well-known variability of data obtained by bolus thermodilution may have impacted the accuracy of the estimates of temporal changes in CFR. Finally, we cannot rule out the possibility of different results if the follow-up period had been longer than 6 months.
Conclusions
In patients with severe AS, CFR in the LAD was significantly higher 6 months after aortic valve replacement compared with before valve replacement, despite unchanged global hyperaemic flow and minimal microvascular resistance. This indicated that decreased global resting flow was the cause of CFR improvement. However, when accounting for the concomitant regression of LVH, CFR appeared to improve due to higher hyperaemic flow per gram of myocardium. Lastly, improvements in CFR were associated with reductions in LV stroke work.
Impact on daily practice
In patients with severe AS and coronary artery disease, the reliability of fractional flow reserve (FFR) before valve replacement has been questioned. We have previously shown that TAVI does not lead to significant long-term changes in FFR34, and in the present study we corroborate those results by showing that global hyperaemic flow – on which FFR is based – remained unchanged 6 months after valve replacement.
Funding
This work was funded by a PhD grant (nr. R198-A8805-B44165), Rigshospitalet, Copenhagen University Hospital, Copenhagen, Denmark.
Conflict of interest statement
K. Arslani has received a research grant from the Swiss Academy of Medical Sciences and the Bangerter Foundation (YTCR 09/19) and the Swiss National Science Foundation (P500PM_202963) outside of the submitted work. The other authors have no conflicts of interest to declare.