Abstract
Background: Microvascular resistance reserve (MRR) is a validated measure of coronary microvascular function independent of epicardial resistances.
Aims: We sought to assess whether MRR is associated with adverse cardiac remodelling, a low-flow phenotype and extravalvular cardiac damage (EVCD) in patients with severe aortic stenosis (AS) undergoing transcatheter aortic valve implantation (TAVI).
Methods: Invasive thermodilution-based assessment of the coronary microvascular function of the left anterior descending artery was performed in a prospective, multicentre cohort of patients undergoing TAVI. Coronary microvascular dysfunction (CMD) was defined as the lowest MRR tertile of the study cohort. Haemodynamic measurements were performed at baseline and then repeated immediately after TAVI. EVCD and markers of a low-flow phenotype were assessed with echocardiography.
Results: A total of 134 patients were included in this study. Patients with low MRR were more frequently females, had a lower estimated glomerular filtration rate and a higher rate of atrial fibrillation. MRR was significantly lower in patients with advanced EVCD (median 1.80 [1.26-3.30] vs 2.50 [1.87-3.41]; p=0.038) and in low-flow, low-gradient AS (LF LG-AS) (median 1.85 [1.20-3.04] vs 2.50 [1.87-3.40]; p=0.008). Overall, coronary microvascular function tended to improve after TAVI and, in particular, MRR increased significantly after TAVI in the subgroup with low MRR at baseline. However, MRR was significantly impaired in 38 (28.4%) patients immediately after TAVI. Advanced EVCD (adjusted odds ratio 3.08 [1.22-7.76]; p=0.017) and a low-flow phenotype (adjusted odds ratio 3.36 [1.08-10.47]; p=0.036) were significant predictors of CMD.
Conclusions: In this observational, hypothesis-generating study, CMD was associated with extravalvular cardiac damage and a low-flow phenotype in patients with severe AS undergoing TAVI.
Introduction
Coronary microvascular dysfunction (CMD) in patients with aortic stenosis (AS) and its impact on extravalvular cardiac damage are poorly understood1. In the presence of severe AS, coronary physiology is characterised by increased resting coronary flow to match the augmented oxygen demand, leading to exhausted coronary flow reserve (CFR), even in the absence of significant epicardial coronary disease2. Microvascular resistance reserve (MRR) is a novel, validated marker of coronary microvascular function34. MRR is specific for the microcirculation and independent of myocardial mass and driving pressures. Patients with AS showed lower MRR compared with matched controls2.
Recent research focusing on extravalvular cardiac damage (EVCD) in AS demonstrated that right ventricular dysfunction, pulmonary vasculature impairment and a severe low-flow state reflect advanced cardiac damage and are associated with a worse outcome56.
Abnormally elevated microcirculatory resistances were associated with a low-flow state and markers of adverse remodelling in a small cohort of patients undergoing transcatheter aortic valve implantation (TAVI); however, the association between microvascular dysfunction, EVCD and low-flow state has not yet been clarified7.
We hypothesised that MRR can be a marker of the complex interplay between an aortic valve obstruction and the cardiac adaptive response. Progressive AS severity leads to increased left ventricular (LV) filling pressures, extravascular compression forces and LV positive remodelling. Ultimately, exhausted compensatory mechanisms may lead to adverse LV remodelling, subendocardial ischaemia, LV fibrosis, vascular remodelling, and CMD. In the course of time, a maladaptive LV response may also cause cardiac damage, including left atrial and right ventricular dysfunction and pulmonary hypertension568. In this study, we sought to assess the clinical features associated with impaired MRR in a prospective, multicentre, international cohort of patients with AS undergoing TAVI. In particular, we aimed to assess if low MRR was associated with a low-flow phenotype and advanced EVCD.
Methods
STUDY POPULATION
This is a patient-pooled analysis of 3 prospective observational studies conducted in 3 European interventional centres (Verona University Hospital, Italy; Aalst OLV Cardiovascular Center, Belgium; San Raffaele Hospital, Milan, Italy) between January 2021 and May 2023. Details of the studies conducted in Verona University Hospital and Aalst OLV Cardiovascular Center have been previously reported27.
In this analysis, we included severe AS patients undergoing TAVI with thermodilution-derived assessment of the coronary microvascular function in the left anterior descending artery (LAD) during the TAVI procedure, prior to valve implantation. A coronary thermodilution assessment was repeated immediately after TAVI.
The main exclusion criteria were significant angiographic epicardial stenosis in the LAD, previous coronary artery bypass graft surgery, previous anterior myocardial infarction, evidence of chronic total occlusion, haemodynamic instability, and severe chronic kidney disease.
Details of the inclusion and exclusion criteria for each cohort are reported in Supplementary Appendix 1. The study flowchart is presented in Supplementary Figure 1.
This study was conducted following the Declaration of Helsinki, and it was approved by the institutional review board of each centre involved. Written informed consent was collected from all patients.
TRANSCATHETER AORTIC VALVE IMPLANTATION
All patients underwent TAVI with transfemoral access under conscious sedation and local anaesthesia. All decisions about the technical aspects of TAVI procedures were left to the operator’s discretion. Technical TAVI success was defined according to the Valve Academic Research Consortium (VARC)-3 criteria9. Coronary angiography was performed in all the patients to exclude the presence of significant epicardial coronary artery disease, using radial or femoral arterial access with 6 Fr guiding catheters as per standard practice.
CORONARY MICROCIRCULATORY ASSESSMENT
Intracoronary microcirculatory assessment was performed using a pressure/temperature-sensor wire (PressureWire X Guidewire; Abbott) connected to a dedicated software (CoroFlow; Coroventis). Continuous thermodilution was performed by using a dedicated infusion microcatheter (RayFlow; Hexacath) placed in the proximal part of the artery, as previously described1011. Steady-state hyperaemia was induced by a continuous intracoronary infusion of saline at 20 mL/min or with an intravenous adenosine infusion (140 mcg/kg/min).
Microvascular resistance reserve (MRR) was derived based on intracoronary continuous or bolus thermodilution using a previously validated formula3:
(Formule 1)
Where CFR is coronary flow reserve, FFR is fractional flow reserve and Pa is the aortic pressure invasively measured at rest or during steady state hyperaemia.
Patients were stratified according to tertiles of MRR. Coronary microvascular dysfunction (CMD) was defined as low MRR, defined according to the lowest tertile of MRR.
Coronary microcirculatory assessment is discussed in further detail in Supplementary Appendix 2.

Formule 1.
PRE-TAVI ECHOCARDIOGRAPHY
Patients underwent complete two-dimensional (2D) and Doppler echocardiography. Data were saved digitally and subsequently analysed offline using TOMTEC-ARENA TTA2 (TOMTEC Imaging Systems GmbH) by experienced researchers (G. Benfari, P. Paolisso, P. Springhetti) blinded to the medical history of the patients.
Assessment of AS severity and conventional echocardiographic measurements of left and right chambers were performed according to the current recommendations121314. LV global longitudinal strain (LV GLS) and peak atrial longitudinal strain (PALS) were measured using dedicated speckle-tracking software packages (AutoStrain; TOMTEC Imaging Systems GmbH) applying the recommendations provided by recent documents151617.
AORTIC STENOSIS ASSESSMENT AND PHENOTYPING
AS was defined according to the latest international guidelines12. Normal-flow high-gradient aortic stenosis (NF HG-AS) was defined as a peak transvalvular velocity >4 m/s, a transvalvular mean gradient >40 mmHg and an aortic valve area <1 cm2 in normal-flow state (left ventricular ejection fraction [LVEF] >50% and stroke volume index [SVi] >35 ml/m2). Low-flow low-gradient AS (LF LG-AS) was defined as an aortic valve area <1cm2 but with a transvalvular mean gradient <40 mmHg and a peak transvalvular velocity <4 m/s in a low-flow state (SVi <35 ml/m2).
EVALUATION OF EXTRAVALVULAR CARDIAC DAMAG
The extent of extravalvular cardiac damage (EVCD) was categorised into 5 stages according to a model described by Généreux et al5, as reported in detail in Supplementary Appendix 3.
To evaluate the interaction between measures of coronary microvascular function and EVCD and increase the statistical power, cardiac damage was dichotomised18 into stages 0-2 (group 1: corresponding to isolated left heart dysfunction) compared with stages 3 and 4 (group 2: damage extending to the pulmonary circulation and right heart involvement) (Figure 1).
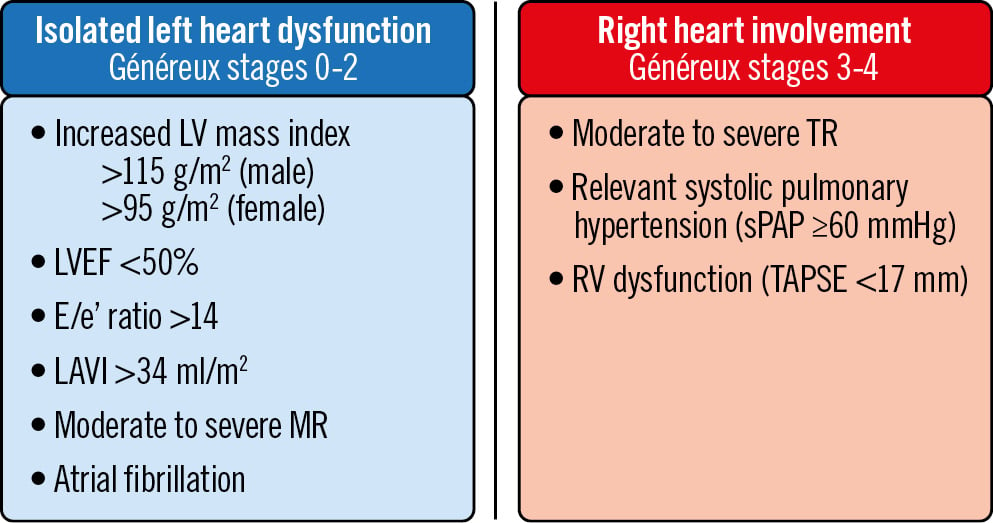
Figure 1. Definition of extravalvular cardiac damage. Généreux extravalvular cardiac damage (EVCD) classification was dichotomised into stages 0-2 (isolated left heart dysfunction) and stages 3-4 (advanced extravalvular cardiac damage with right heart involvement). LAVI: left atrial volume index; LV: left ventricular; LVEF: left ventricular ejection fraction; MR: mitral regurgitation; RV: right ventricular; sPAP: systolic pulmonary arterial pressure; TAPSE: tricuspid annular plane systolic excursion; TR: tricuspid regurgitation
STATISTICAL ANALYSIS
The normal distribution of variables was tested using the Shapiro-Wilk test and histograms. Continuous variables are reported as median and interquartile range (IQR) as appropriate. Categorical variables are reported as numbers and percentages.
Continuous variables were compared with the Mann-Whitney U test or Kruskal-Wallis test as appropriate. Frequencies were compared with Fisher’s exact test. The Wilcoxon test was used to evaluate variations in coronary physiology indices before and after TAVI. Linear regression models were fitted to evaluate the association between continuous variables. Spearman’s correlation coefficients were provided. Logistic regression analysis was performed to identify clinical and echocardiographic determinants of a low MRR and to identify predictors of early post-TAVI MRR improvement − defined as a change from the lowest tertile of pre-TAVI MRR to the intermediate or higher tertile of post-TAVI MRR, or as a change from the intermediate tertile of pre-TAVI MRR to the higher tertile of post-TAVI MRR. Variables with p-value<0.1 at univariable analysis were included in the multivariable regression model. The accuracy of the models was assessed with a receiving operator characteristic (ROC) curve-derived area under the curve (AUC) and compared with the DeLong method. All analyses were performed using SPSS 26 (IBM) and STATA 17 (Stata Corp). A p-value<0.05 was considered statistically significant.
Result
STUDY POPULATION AND BASELINE CHARACTERISTICS
A total of 134 patients with severe AS undergoing TAVI were included in this study. The clinical, echocardiographic, procedural, and physiological data of the study population are presented in Table 1.
Significant clinical differences were observed across the subgroups, which were defined by tertiles of MRR. In particular, patients in the lowest tertile of MRR were more frequently females (34 [75.6%] vs 28 [63.6%] and 21 [46.7%]; p=0.017) with lower estimated glomerular filtration rate (eGFR; median 55.0 [IQR 40.0-75.5] vs 70.5 [51.3-85.0] and 71.9 [54.7-87.0] ml/min/1.73 m²; p=0.031) and a higher rate of chronic atrial fibrillation (10 [22.2%] vs 0 [0%] and 8 [17.8%]; p=0.001) compared with the patients in the second tertile and highest tertile, respectively.
The median MRR was 1.40 (1.19-1.72) in the lowest tertile, 2.40 (2.18-2.63) in the second tertile, and 3.70 (3.27-4.29) in the highest tertile. Furthermore, patients with low MRR showed lower values of CFR (median 1.20 [1.00-1.47] vs 2.04 [1.72-2.30] and 3.22 [2.58-3.69]; p<0.0001) and resistive reserve ratio (RRR; median 1.20 [1.00-1.64] vs 2.23 [1.89-2.68] and 3.70 [3.16-4.95]; p<0.0001) compared with the rest of the study cohort. Conversely, FFR was not significantly different in the 3 subgroups (median 0.91 [0.87-0.94] vs 0.90 [0.85-0.94] and 0.88 [0.82-0.93]; p=0.211).
Table 1. Clinical, echocardiographic, procedural and physiological data according to MRR tertiles.
| All patients | MRR ≤2 | MRR >2 & ≤3 | MRR >3 | p-value overall | |
|---|---|---|---|---|---|
| Clinical data | |||||
| No. of patients | 134 (100) | 45 (33.6) | 44 (32.8) | 45 (33.6) | / |
| Female | 83 (61.9) | 34 (75.6) | 28 (63.6) | 21 (46.7) | 0.017 ¥ |
| Age, years | 83.5 (80.0-86.0) | 85.0 (80.0-87.5) | 83.0 (80.0-85.0) | 83.0 (78.5-86.0) | 0.343 |
| BMI, kg/m2 | 24.4 (23.2-27.8) | 24.3 (22.2-27.8) | 24.3 (23.0-27.6) | 24.8 (23.2-28.9) | 0.671 |
| Hypertension | 11 (82.8) | 36 (80.0) | 36 (81.8) | 39 (86.7) | 0.714 |
| Dyslipidaemia | 97 (72.4) | 33 (73.3) | 34 (77.3) | 30 (66.7) | 0.545 |
| Diabetes | 45 (33.6) | 17 (37.8) | 16 (36.4) | 12 (26.7) | 0.506 |
| Smoker (current or former) | 25 (18.7) | 8 (17.8) | 6 (13.6) | 11 (24.4) | 0.434 |
| eGFR CG, ml/min/1.73 m2 | 65.0 (47.0-84.1) | 55.0 (40.0-75.5) | 70.5 (51.3-85.0) | 71.9 (54.7-87.0) | 0.031 § ¥ |
| Paroxysmal AF | 18 (13.4) | 8 (17.8) | 4 (9.1) | 6 (13.3) | 0.515 |
| Chronic AF | 18 (13.4) | 10 (22.2) | 0 (0) | 8 (17.8) | 0.001 § † |
| AF (paroxysmal or chronic) | 36 (26.9) | 18 (40.0) | 4 (9.1) | 14 (31.1) | 0.002 § † |
| PVD | 24 (17.9) | 9 (20.0) | 6 (13.6) | 9 (20.0) | 0.693 |
| Previous PCI | 12 (9.0) | 2 (4.4) | 4 (9.1) | 6 (13.3) | 0.337 |
| Echocardiography | |||||
| Mean gradient, mmHg | 44.0 (36.5-55.0) | 40.0 (31.0-54.0) | 45.0 (40.0-57.0) | 43.5 (40.0-50.0) | 0.251 |
| AVA, cm2 | 0.7 (0.5-0.8) | 0.7 (0.5-0.8) | 0.6 (0.5-0.8) | 0.7 (0.5-0.8) | 0.465 |
| LVEF, % | 60 (53-64) | 60 (53.5-64) | 60 (58-65) | 58.5 (51.2-63.8) | 0.480 |
| LVEDV index, ml/m2 | 51 (43.2-64.7) | 53 (45.5-66) | 49 (42-64) | 51 (41-68) | 0.552 |
| LV SVi, ml/m2 | 38 (33-45) | 34 (29-38) | 40 (35-45) | 41 (33-48) | 0.002 § ¥ |
| LV GLS, −% * | 15 (11-17) | 14.2 (10.5-16.3) | 16.1 (13.0-18.0) | 14.5 (10.0-17.3) | 0.089 § |
| LV mass index, g/m2 | 114 (99-129) | 113 (101-128) | 115 (99-131) | 113 (97-127) | 0.836 |
| RWT | 0.51 (0.45-0.60) | 0.53 (0.46-0.61) | 0.50 (0.45-0.58) | 0.51 (0.44-0.60) | 0.548 |
| LV E/e' | 14 (11-19) | 15 (11-19) | 13 (11-18) | 14 (10-18) | 0.747 |
| LAV index, ml/m2 | 41 (32-49) | 40 (32-53) | 44 (37-51) | 38 (28-46) | 0.083 † |
| PALS, % ** | 18 (13-26) | 15 (10-21) | 20 (16-26) | 20 (11-28) | 0.026 § ¥ |
| MR more than mild | 41 (30.8) | 13 (28.9) | 15 (34.1) | 13 (29.5) | 0.891 |
| sPAP, mmHg | 35 (30-44) | 40 (31-50) | 31 (25-40) | 32 (28-36) | 0.012 § ¥ |
| TR more than mild | 23 (17.3) | 12 (26.7) | 5 (11.4) | 6 (13.6) | 0.138 |
| TAPSE, mm | 22 (19-24) | 20 (18-24) | 23 (22-26) | 21 (19-24) | 0.003 § † |
| EVCD and LF LG-AS | |||||
| LF LG-AS | 31 (23.1) | 17 (37.8) | 6 (13.6) | 8 (17.8) | 0.022 § ¥ |
| Généreux stages 3/4 | 31 (23.1) | 17 (37.8) | 5 (11.4) | 9 (20.0) | 0.011 § |
| Généreux stage 4 | 10 (7.5) | 8 (17.8) | 0 (0) | 2 (4.4) | 0.004 § |
| Généreux stage 3 | 21 (15.7) | 9 (20.0) | 5 (11.4) | 7 (15.6) | 0.557 |
| Généreux stage 2 | 86 (64.2) | 23 (51.1) | 33 (75.0) | 30 (66.7) | 0.064 § |
| Généreux stage 1 | 13 (9.7) | 4 (8.9) | 5 (11.4) | 4 (8.9) | 0.875 |
| Généreux stage 0 | 4 (3.0) | 1 (2.2) | 1 (2.3) | 2 (4.4) | 1.000 |
| Procedural data | |||||
| BE valve | 32 (23.9) | 14 (31.1) | 7 (15.9) | 11 (24.4) | 0.244 |
| Physiology data | |||||
| MRR pre-TAVI | 2.40 (1.70-3.32) | 1.40 (1.19-1.72) | 2.40 (2.18-2.63) | 3.70 (3.27-4.29) | <0.0001 § ¥ † |
| MRR post-TAVI | 2.66 (1.82-3.42) | 1.88 (1.42-2.76) | 2.57 (2.06-3.70) | 3.24 (2.67-3.92) | <0.0001 § ¥ |
| CFR pre-TAVI | 2.0 (1.43-2.67) | 1.20 (1.00-1.47) | 2.04 (1.72-2.30) | 3.22 (2.58-3.69) | <0.0001 § ¥ † |
| CFR post-TAVI | 2.12 (1.45-2.80) | 1.42 (1.02-2.28) | 2.11 (1.67-3.04) | 2.44 (1.89-3.00) | <0.0001 § ¥ |
| RRR pre-TAVI | 2.23 (1.38-3.36) | 1.20 (1.00-1.64) | 2.23 (1.89-2.68) | 3.7 (3.16-4.95) | <0.0001 § ¥ † |
| RRR post-TAVI | 2.42 (1.70-3.26) | 1.68 (1.11-2.69) | 2.41 (2.13-3.63) | 3.08 (2.45-3.43) | <0.0001 § ¥ |
| FFR pre-TAVI | 0.90 (0.84-0.94) | 0.91 (0.87-0.94) | 0.90 (0.85-0.94) | 0.88 (0.82-0.93) | 0.211 |
| FFR post-TAVI | 0.88 (0.83-0.94) | 0.90 (0.85-0.95) | 0.89 (0.83-0.95) | 0.87 (0.82-0.91) | 0.340 |
| Data are presented as number (%) or median (interquartile range). § p-value significant for comparison of 1 vs 2; ¥ p-value significant for comparison of 1 vs 3; † p-value significant for comparison of 2 vs 3; * missing values for 46 patients (43.3%); ** missing values for 49 patients (36.6%). AF: atrial fibrillation; AVA: aortic valve area; BE: balloon-expandable; BMI: body mass index; CFR: coronary flow reserve; eGFR CG: estimated glomerular filtration rate (Cockcroft-Gault method); EVCD: extravalvular cardiac damage; FFR: fractional flow reserve; GLS: global longitudinal strain; LAV: left atrial volume; LF LG-AS: low-flow low-gradient aortic stenosis; LV: left ventricular; LVEDV: LV end-diastolic volume; LVEF: left ventricular ejection fraction; MR: mitral regurgitation; MRR: microvascular resistance reserve; No.: number; PALS: peak atrial longitudinal strain; PCI: percutaneous coronary intervention; PVD: peripheral vascular disease; RRR: resistive reserve ratio; RWT: relative wall thickness; sPAP: systolic pulmonary arterial pressure; SVi: stroke volume index; TAPSE: tricuspid annular plane systolic excursion; TAVI: transcatheter aortic valve implantation; TR: tricuspid regurgitation | |||||
MRR AND ADVANCED EXTRAVALVULAR CARDIAC DAMAGE
Overall, 31 patients (23.1%) were characterised by advanced EVCD (Généreux stages 3-4). The clinical, echocardiographic, procedural, and physiological data of patients according to ECVD are presented in Table 2. MRR was significantly lower in patients with advanced EVCD (median 1.80 [1.26-3.30] vs 2.50 [1.87-3.41]; p=0.038) compared with patients in Généreux stages 0-2. Similarly, RRR was significantly reduced in patients with advanced EVCD (median 1.64 [1.13-2.96] vs 2.47 [1.68-3.45]; p=0.015). Conversely, CFR (median 1.79 [1.20-2.55] vs 2.07 [1.46-2.68]; p=0.193) and FFR (median 0.89 [0.82-0.94] vs 0.90 [0.84-0.94]; p=0.318) were not significantly different in the two subgroups (Central illustration). Patients in the lowest tertile of MRR were more frequently categorised as Généreux stages 3-4 compared with patients in the second and third tertiles of MRR (17 [37.8%] vs 5 [11.4%] vs 9 [20.0%]; p=0.011) (Table 1). The overall Généreux classification of EVCD is presented in Supplementary Figure 2. Patients in stage 4 showed lower values of MRR (p=0.033) and RRR (p=0.048) compared with the other subgroups (Supplementary Figure 2). Supplementary Table 1 shows the incidence of advanced EVCD (Généreux stages 3-4) in patients stratified according to different, previously described, cutoffs of MRR419.
Table 2. Clinical, echocardiographic, procedural and physiological data according to the degree of EVCD.
| All patients | Généreux stages 0-2 | Généreux stages 3-4 | p-value | |
|---|---|---|---|---|
| Clinical data | ||||
| No. of patients | 134 (100) | 103 (76.9) | 31 (23.1) | / |
| Female | 83 (61.9) | 61 (59.2) | 22 (71.0) | 0.294 |
| Age, years | 83.5 (80.0-86.0) | 82.0 (79.0-86.0) | 86.0 (82.0-88.0) | 0.002 |
| BMI, kg/m2 | 24.4 (23.2-27.8) | 24.4 (22.8-27.8) | 24.8 (23.5-26.7) | 0.492 |
| Hypertension | 11 (82.8) | 83 (80.6) | 28 (90.3) | 0.281 |
| Dyslipidaemia | 97 /72.4) | 74 (71.8) | 23 (74.2) | 1.000 |
| Diabetes | 45 (33.6) | 37 (35.9) | 8 (25.8) | 0.387 |
| Smoker (current or former) | 25 (18.7) | 20 (19.4) | 5 (16.1) | 0.797 |
| eGFR CG, ml/min/1.73 m2 | 65.0 (47.0-84.1) | 65.0 (48.0-85.0) | 64.0 (43.0-84.0) | 0.673 |
| Paroxysmal atrial fibrillation | 18 (13.4) | 13 (12.6) | 5 (16.1) | 0.564 |
| Chronic atrial fibrillation | 18 (13.4) | 9 (8.7) | 9 (29.0) | 0.007 |
| AF (chronic or paroxysmal) | 36 (26.9) | 22 (21.4) | 14 (45.2) | 0.012 |
| Peripheral vascular disease | 24 (17.9) | 22 (21.4) | 2 (6.5) | 0.065 |
| Previous PCI | 12 (9.0) | 7 (6.8) | 5 (16.1) | 0.148 |
| Echocardiographic data pre-TAVI | ||||
| Mean gradient, mmHg | 44.0 (36.5-55.0) | 45.0 (39.5-56.2) | 40.0 (32.0-47.0) | 0.058 |
| AVA, cm2 | 0.7 (0.5-0.8) | 0.7 (0.5-0.8) | 0.7 (0.5-0.9) | 0.844 |
| LVEF, % | 60 (53-64) | 60 (55-65) | 58 (52-60) | 0.019 |
| LVEDV index, ml/m2 | 51.0 (43.2-64.7) | 53.0 (43.0-66.5) | 49.0 (45.0-60.0) | 0.725 |
| LV SVi, ml/m2 | 38 (33-45) | 39 (34-46) | 35 (30-42) | 0.010 |
| LV GLS, −% * | 15 (11-17) | 15 (12-18) | 14 (10-16) | 0.155 |
| LV mass index, g/m2 | 114 (99-129) | 114 (99-129) | 115 (99-131) | 0.846 |
| RWT | 0.51 (0.45-0.60) | 0.51 (0.45-0.61) | 0.50 (0.43-0.57) | 0.186 |
| LV E/e' ** | 14 (11-19) | 14 (11-18) | 14 (11-21) | 0.594 |
| LAV index, ml/m2 | 41 (32-49) | 40 (32-48) | 45 (36-53) | 0.157 |
| PALS, % *** | 18 (13-26) | 21(14-27) | 15 (10-20) | 0.024 |
| MR more than mild | 41 (30.8) | 24 (23.5) | 17 (54.8) | 0.002 |
| sPAP, mmHg **** | 35 (30-44) | 31 (25-38) | 45 (35-55) | <0.0001 |
| TR more than mild | 23 (17.3) | 0 (0) | 23 (74.2) | <0.0001 |
| TAPSE, mm | 22 (19-24) | 22 (20-24) | 19 (16-25) | 0.050 |
| LF LG-AS | ||||
| LF LG-AS | 31 (23.1) | 21 (20.4) | 10 (32.3) | 0.224 |
| Procedural data | ||||
| Balloon-expandable valve | 32 (23.9) | 25 (24.3) | 7 (22.6) | 1.000 |
| Physiology data | ||||
| MRR pre-TAVI | 2.40 (1.70-3.32) | 2.50 (1.87-3.41) | 1.80 (1.26-3.30) | 0.038 |
| MRR post-TAVI | 2.66 (1.82-3.42) | 2.65 (1.82-3.44) | 2.69 (1.82-3.40) | 0.750 |
| CFR pre-TAVI | 2.00 (1.43-2.67) | 2.07 (1.46-2.68) | 1.79 (1.20-2.55) | 0.193 |
| CFR post-TAVI | 2.12 (1.45-2.80) | 2.09 (1.42-2.80) | 2.24 (1.52-2.71) | 0.625 |
| RRR pre-TAVI | 2.23 (1.38-3.36) | 2.47 (1.68-3.45) | 1.64 (1.13-2.96) | 0.015 |
| RRR post-TAVI | 2.42 (1.70-3.26) | 2.48 (1.70-3.28) | 2.36 (1.74-3.22) | 0.767 |
| FFR pre-TAVI | 0.90 (0.84-0.94) | 0.90 (0.84-0.94) | 0.89 (0.82-0.94) | 0.318 |
| FFR post-TAVI | 0.88 (0.83-0.94) | 0.88 (0.84-0.94) | 0.87 (0.80-0.92) | 0.196 |
| Data are presented as number (%) or median (interquartile range). * missing values for 46 patients (43.3%); ** missing values for 20 patients (14.9%); *** missing values for 49 patients (36.6%); **** missing values for 20 patients (14.9%). AF: atrial fibrillation; AVA: aortic valve area; BMI: body mass index; CFR: coronary flow reserve; eGFR CG: estimated glomerular filtration rate (Cockcroft-Gault method); EVCD: extravalvular cardiac damage; FFR: fractional flow reserve; GLS: global longitudinal strain; LAV: left atrial volume; LF LG-AS: low-flow low-gradient aortic stenosis; LV: left ventricular; LVEDV: LV end-diastolic volume; LVEF: left ventricular ejection fraction; MR: mitral regurgitation; MRR: microvascular resistance reserve; No.: number; PALS: peak atrial longitudinal strain; PCI: percutaneous coronary intervention; RRR: resistive reserve ratio; RWT: relative wall thickness; sPAP: systolic pulmonary arterial pressure; SVi: stroke volume index; TAPSE: tricuspid annular plane systolic excursion; TAVI: transcatheter aortic valve implantation; TR: tricuspid regurgitation | ||||
Central illustration. Coronary physiology data stratified according to extravalvular cardiac damage Coronary microvascular function expressed by MRR (A) and RRR (C) was significantly impaired in patients with advanced extravalvular cardiac damage. CFR and FFR were not significantly different between patients with and without advanced extravalvular cardiac damage (B and D). CFR: coronary flow reserve; FFR: fractional flow reserve; MRR: microvascular resistance reserve; RRR: resistive reserve ratio; TAVI: transcatheter aortic valve implantation
MRR AND A LOW-FLOW LOW-GRADIENT PHENOTYP
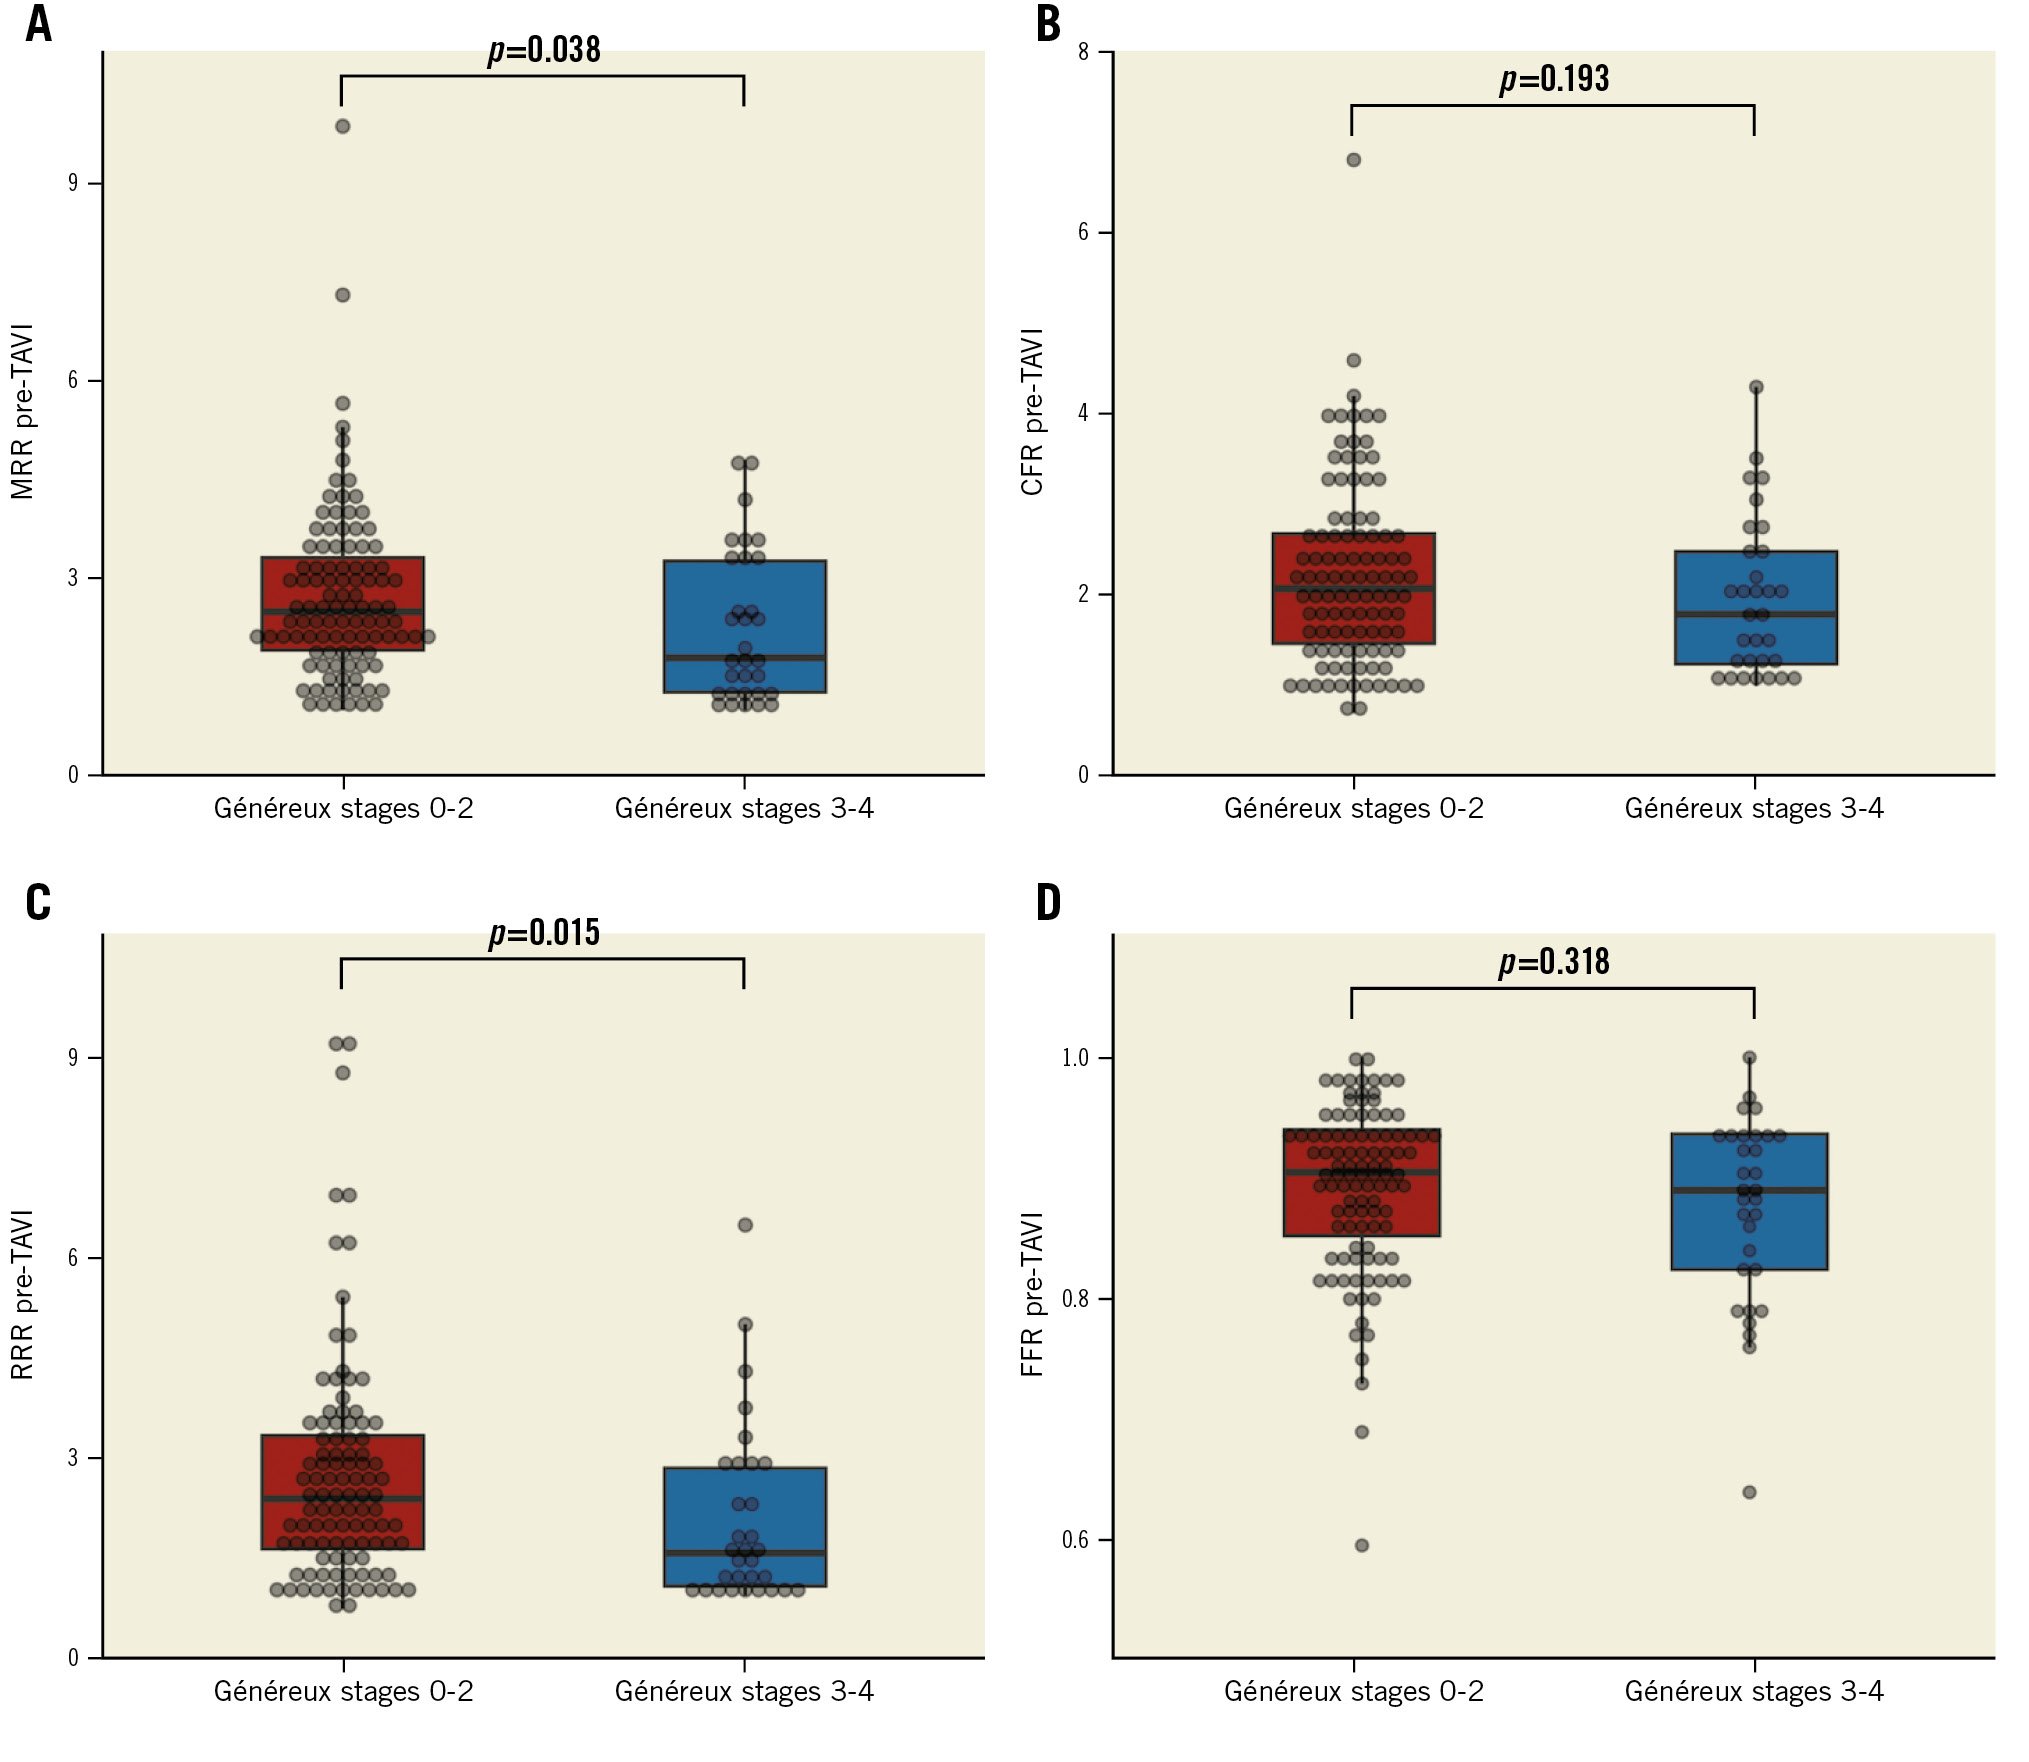
Thirty-one patients (23.1%) were classified as LF LG-AS. The clinical, echocardiographic, procedural, and physiological data of patients stratified according to the AS phenotype are presented in Table 3. MRR (median 1.85 [1.20-3.04] vs 2.50 [1.87-3.40]; p=0.008), RRR (median 1.80 [1.17-2.86] vs 2.45 [1.64-3.42]; p=0.024) and CFR (median 1.69 [1.06-2.30] vs 2.10 [1.50-2.68]; p=0.029) were significantly lower and FFR was significantly higher (median 0.93 [0.89-0.96] vs 0.89 [0.83-0.93]; p=0.006) in patients with LF LG-AS compared with patients with normal-flow high-gradient AS (Figure 2).
Patients with low MRR were more frequently classified as LF LG-AS (17 [37.8%] vs 6 [13.6%] vs 8 [17.8%]; p=0.022), and they showed lower values of SVi (median 34 [29-38] vs 40 [35-45] vs 41 (33-48) ml/m²; p=0.002) (Table 1).
Table 3. Clinical, echocardiographic, procedural and physiological data according to AS phenotype.
| Overall | NF HG-AS | LF LG-AS | p-value | |
|---|---|---|---|---|
| Clinical data | ||||
| No. of patients | 134 (100) | 103 (76.9) | 31 (23.1) | |
| Female | 83 (61.9) | 70 (68.0) | 13 (41.9) | 0.012 |
| Age, years | 83.5 (80.0-86.0) | 84.0 (80.0-86.0) | 82.0 (80.0-87.0) | 0.953 |
| BMI, kg/m² | 24.4 (23.2-27.8) | 24.3 (23-27.8) | 24.8 (23.3-29.4) | 0.754 |
| Hypertension | 11 (82.8) | 85 (82.5) | 26 (83.9) | 1.000 |
| Dyslipidaemia | 97 (72.4) | 78 (75.7) | 19 (61.3) | 0.168 |
| Diabetes | 45 (33.6) | 32 (31.1) | 13 (41.9) | 0.283 |
| Smoker (current or former) | 25 (18.7) | 22 (21.4) | 3 (9.7) | 0.191 |
| eGFR CG, ml/min/1.73 m2 | 65.0 (47.0-84.1) | 69.0 (53.0-85.0) | 53.0 (43.0-72.0) | 0.047 |
| Paroxysmal AF | 18 (13.4) | 12 (11.7) | 6 (19.4) | 0.366 |
| Chronic AF | 18 (13.4) | 8 (7.8) | 10 (32.3) | 0.001 |
| AF (chronic or paroxysmal) | 36 (26.9) | 20 (19.4) | 16 (51.6) | 0.001 |
| Peripheral vascular disease | 24 (17.9) | 13 (12.6) | 11 (35.5) | 0.007 |
| Previous PCI | 12 (9.0) | 11 (10.7) | 1 (3.2) | 0.294 |
| Echocardiographic data pre-TAVI | ||||
| Mean gradient, mmHg | 44.0 (36.5-55.0) | 47.0 (41.0-58.0) | 30.0 (20.7-34.5) | <0.0001 |
| AVA, cm2 | 0.7 (0.5-0.8) | 0.7 (0.5-0.8) | 0.8 (0.6-0.9) | 0.001 |
| LVEF, % | 60 (53-64) | 60 (57-65) | 49 (33-64) | <0.0001 |
| LVEDV index, ml/m2 | 51.0 (43.2-64.7) | 50.0 (43.0-60.0) | 67.0 (46.0-92.0) | 0.001 |
| LV SVi, ml/m2 | 38 (33-45) | 40 (35-47) | 30 (28-34) | <0.0001 |
| LV GLS, −% * | 15 (11-17) | 16 (14-18) | 9 (7-12) | <0.0001 |
| LV mass index, g/m2 | 114 (99-129) | 113 (99-128) | 118 (100-144) | 0.394 |
| RWT | 0.51 (0.45-0.60) | 0.51 (0.45-0.58) | 0.50 (0.45-0.67) | 0.425 |
| LV E/e' | 14 (11-19) | 14 (11-19) | 12 (8-18) | 0.181 |
| LAV index, ml/m2 | 41 (32-49) | 39 (32-47) | 45 (39-57) | 0.008 |
| PALS, % ** | 18 (13-26) | 21 (15-27) | 11 (6-15) | <0.0001 |
| MR more than mild | 41 (30.8) | 32 (31.1) | 9 (30) | 1.000 |
| sPAP, mmHg | 35 (30-44) | 35 (30-44) | 36 (28-44) | 0.561 |
| TR more than mild | 23 (17.3) | 16 (15.5) | 7 (23.3) | 0.410 |
| TAPSE, mm | 22 (19-24) | 22 (20-25) | 19 (16-24) | 0.001 |
| EVCD | ||||
| Généreux stages 3/4 | 31 (23.1) | 21 (20.4) | 10 (32.3) | 0.224 |
| Généreux stage 4 | 10 (7.5) | 3 (2.9) | 7 (22.6) | 0.001 |
| Généreux stage 3 | 21 (15.7) | 18 (17.5) | 3 (9.7) | 0.403 |
| Généreux stage 2 | 86 (64.2) | 66 (64.1) | 20 (64.5) | 1.000 |
| Généreux stage 1 | 13 (9.7) | 12 (11.7) | 1 (3.2) | 0.298 |
| Généreux stage 0 | 4 (3.0) | 4 (3.9) | 0 (0) | 0.573 |
| Procedural data | ||||
| Balloon-expandable valve | 32 (23.9) | 17 (16.5) | 15 (48.4) | 0.001 |
| Physiology data | ||||
| MRR pre-TAVI | 2.40 (1.70-3.32) | 2.50 (1.87-3.40) | 1.85 (1.20-3.05) | 0.008 |
| MRR post-TAVI | 2.66 (1.82-3.42) | 2.75 (2.04-3.64) | 2.25 (1.51-3.28) | 0.057 |
| CFR pre-TAVI | 2.0 (1.43-2.67) | 2.10 (1.50-2.68) | 1.69 (1.06-2.30) | 0.029 |
| CFR post-TAVI | 2.12 (1.45-2.80) | 2.16 (1.59-2.80) | 1.79 (1.31-2.84) | 0.344 |
| RRR pre-TAVI | 2.23 (1.38-3.36) | 2.45 (1.64-3.42) | 1.80 (1.17-2.86) | 0.024 |
| RRR post-TAVI | 2.42 (1.70-3.26) | 2.53 (1.83-3.25) | 2.18 (1.42-3.28) | 0.191 |
| FFR pre-TAVI | 0.90 (0.84-0.94) | 0.89 (0.83-0.93) | 0.93 (0.89-0.96) | 0.006 |
| FFR post-TAVI | 0.88 (0.83-0.94) | 0.87 (0.81-0.91) | 0.95 (0.89-0.96) | <0.0001 |
| Data are presented as number (%) or median (interquartile range). *missing values for 46 patients (43.3%); **missing values for 49 patients (36.6%). AF: atrial fibrillation; AS: aortic stenosis; AVA: aortic valve area; BMI: body mass index; CFR: coronary flow reserve; eGFR CG: estimated glomerular filtration rate (Cockcroft-Gault method); EVCD: extravalvular cardiac damage; FFR: fractional flow reserve; GLS: global longitudinal strain; LAV: left atrial volume; LF LG-AS: low-flow low-gradient aortic stenosis; LV: left ventricular; LVEDV: LV end-diastolic volume; LVEF: left ventricular ejection fraction; MR: mitral regurgitation; MRR: microvascular resistance reserve; NF HG-AS: normal-flow high-gradient aortic stenosis; No.: number; PALS: peak atrial longitudinal strain; PCI: percutaneous coronary intervention; RRR: resistive reserve ratio; RWT: relative wall thickness; sPAP: systolic pulmonary arterial pressure; SVi: stroke volume index; TAPSE: tricuspid annular plane systolic excursion; TAVI: transcatheter aortic valve implantation; TR: tricuspid regurgitation | ||||
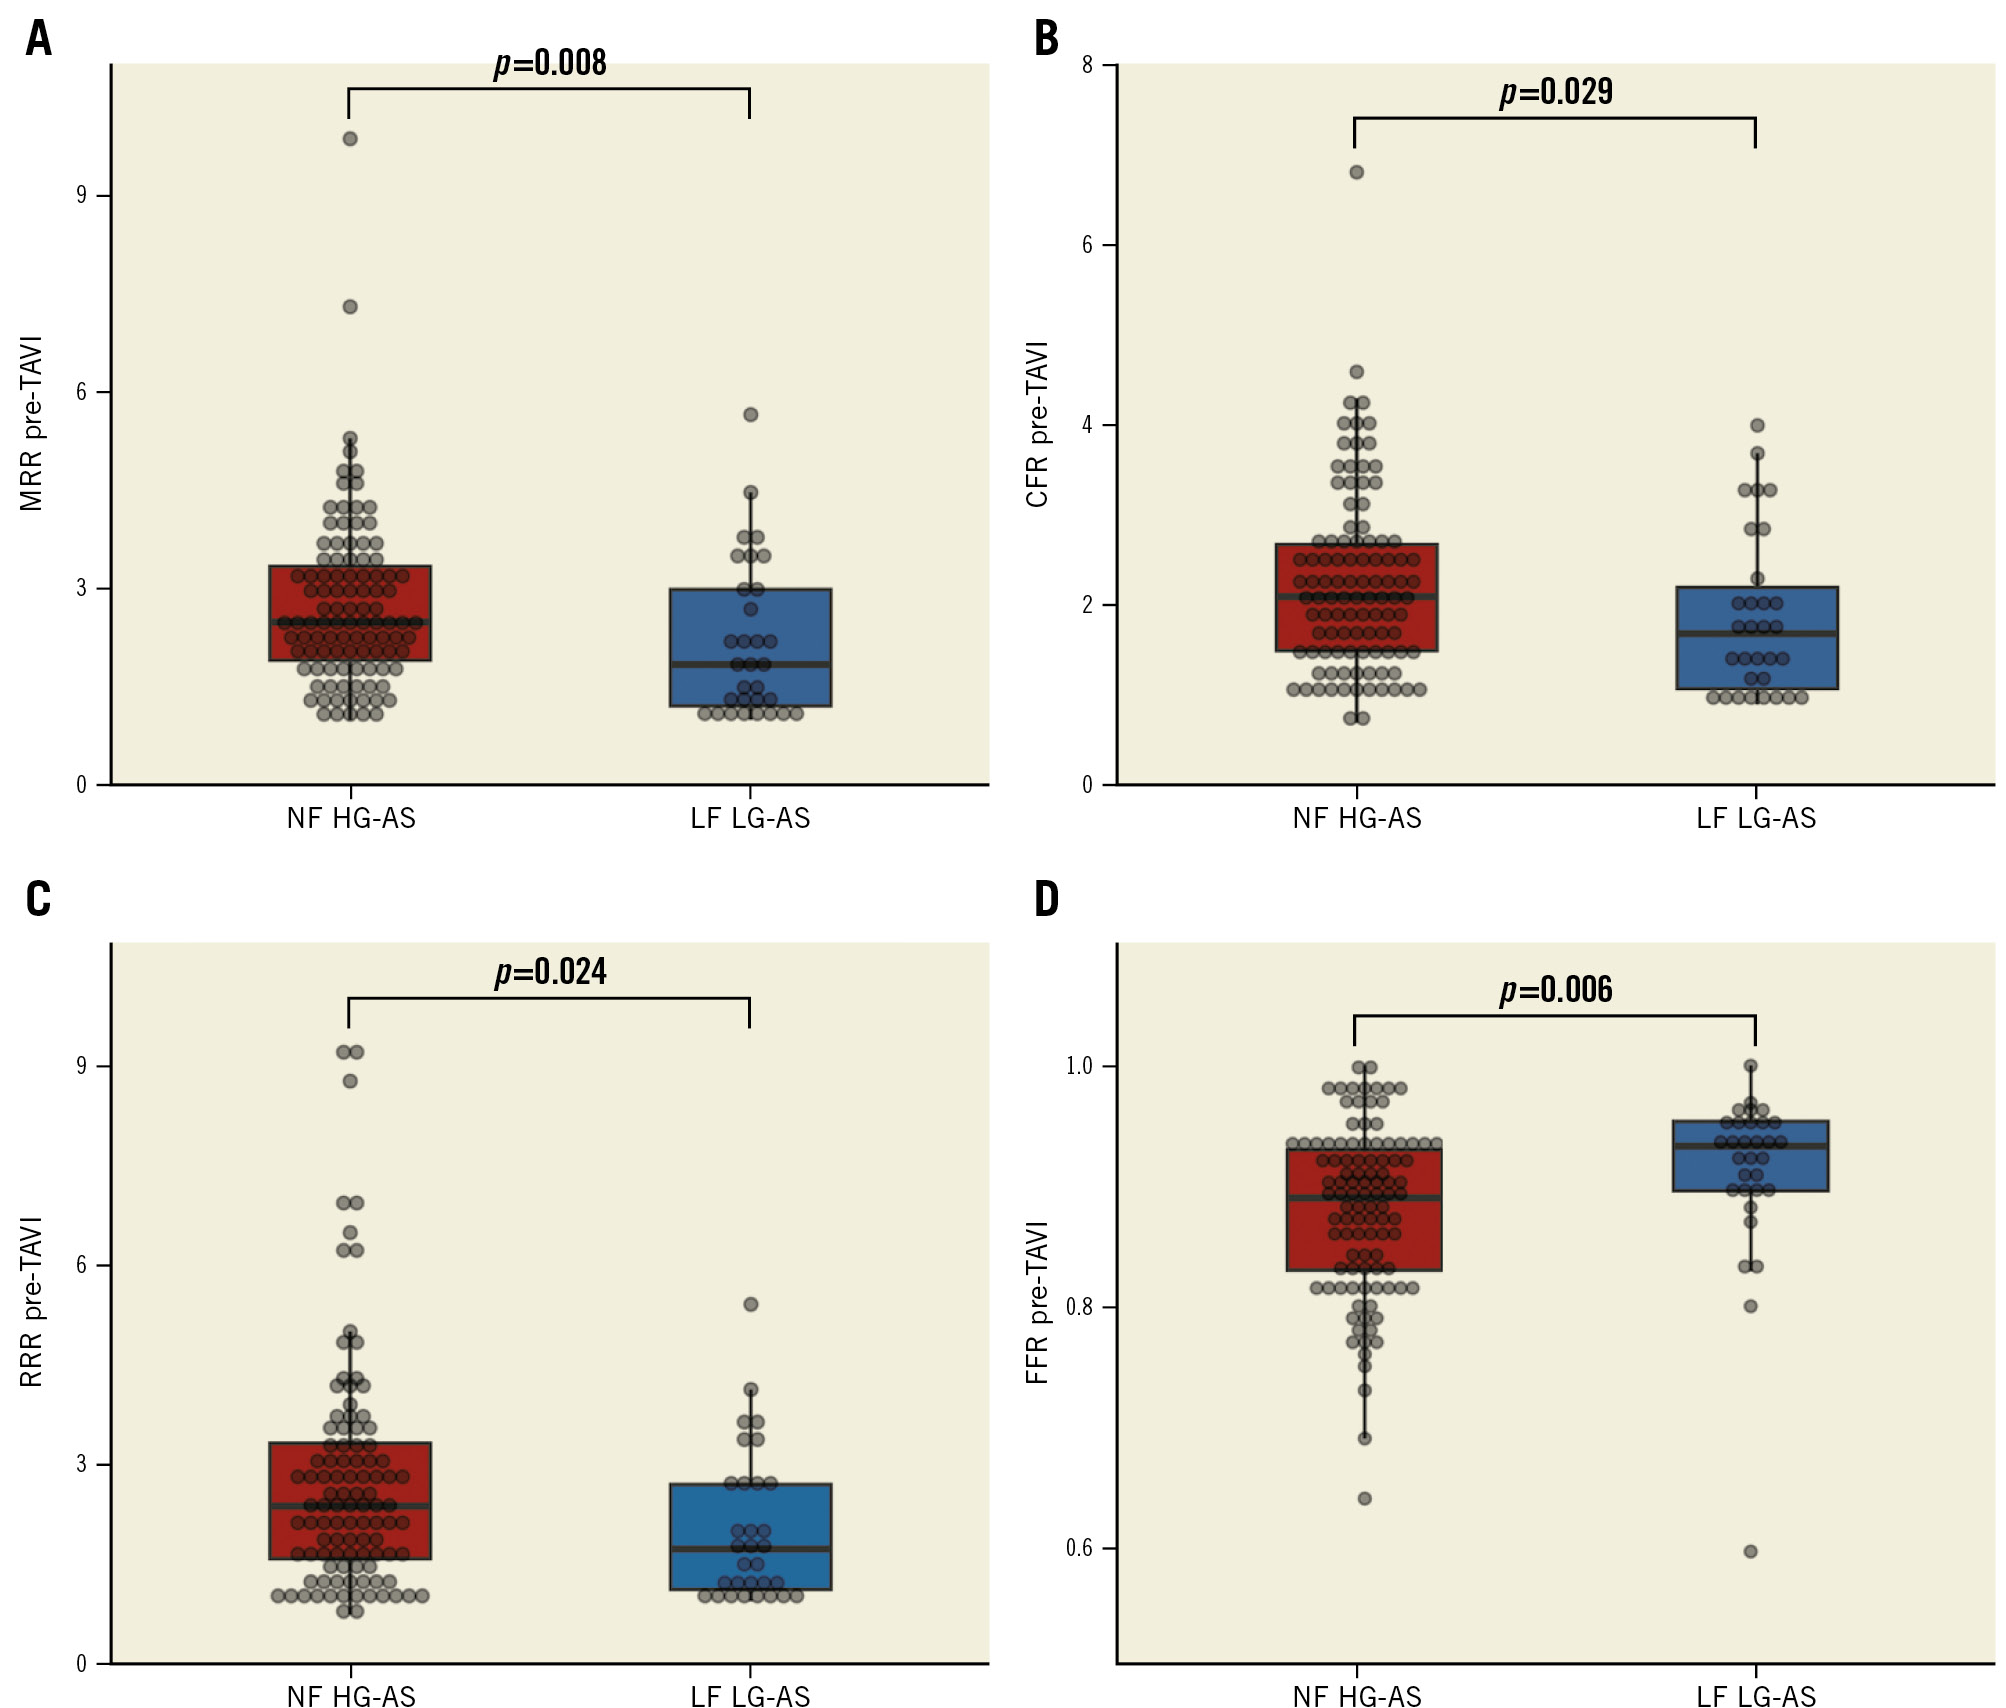
Figure 2. Coronary physiology data in patients with LF LG-AS versus NF HG-AS. Coronary microvascular function expressed by MRR (A), CFR (B) and RRR (C) was significantly impaired in patients with LF LG-AS compared with those with NF HG-AS. FFR was significantly lower in patients with NF HG-AS (D). CFR: coronary flow reserve; FFR: fractional flow reserve; LF LG-AS: low-flow low-gradient aortic stenosis; MRR: microvascular resistance reserve; NF HG-AS: normal-flow high-gradient aortic stenosis; RRR: resistive reserve ratio; TAVI: transcatheter aortic valve implantation
MRR, THE LEFT ATRIUM AND THE LEFT VENTRICLE
Patients with low MRR showed a trend toward larger left atria (median 40 [32-53] vs 44 [37-51] vs 38 [28-46] ml/m²; p=0.083). No differences were observed across patients stratified by MRR tertiles in terms of LV mass index (median 113 [101-128] vs 115 [99-131] vs 113 [97-127] g/m²; p=0.836), relative wall thickness (RWT; median 0.53 [0.46-0.61] vs 0.50 [0.45-0.58] vs 0.51 [0.44-0.60]; p=0.548), LV end-diastolic volume index (median 53.0 [45.5-66.0] vs 49.0 [42.0-64.0] vs 51.0 [41.0-68.0] ml/m²; p=0.552) or LVEF (median 60.0 [53.5-64.0] vs 60.0 [58.0-65.0] vs 58.5 [51.2-63.8]; p=0.480) (Table 1).
The median LV GLS was numerically lower (14.2 [10.5-16.3] vs 16.1 [13.0-18.0] vs 14.5 [10.0-17.3]; p=0.089) and left atrial function expressed by PALS was significantly reduced (15 [10-21] vs 20 [16-26] vs 20 [11-28]; p=0.026) in patients with low MRR. MRR was linearly correlated with PALS (Rho 0.267; p=0.013) and SVi (Rho 0.242; p=0.006) (Supplementary Figure 3).
PREDICTORS OF LOW MRR
Predictors of low MRR at univariable logistic regression analysis are shown in Supplementary Table 2. The multivariable model including female gender, eGFR (Cockroft-Gault [CG] method) <60 ml/min, advanced EVCD (Généreux stages 3-4) and a low-flow phenotype (SVi <30 ml/min) demonstrated an overall good performance in predicting low MRR (AUC 0.78 [0.68-0.86]; p<0.001) (Figure 3).
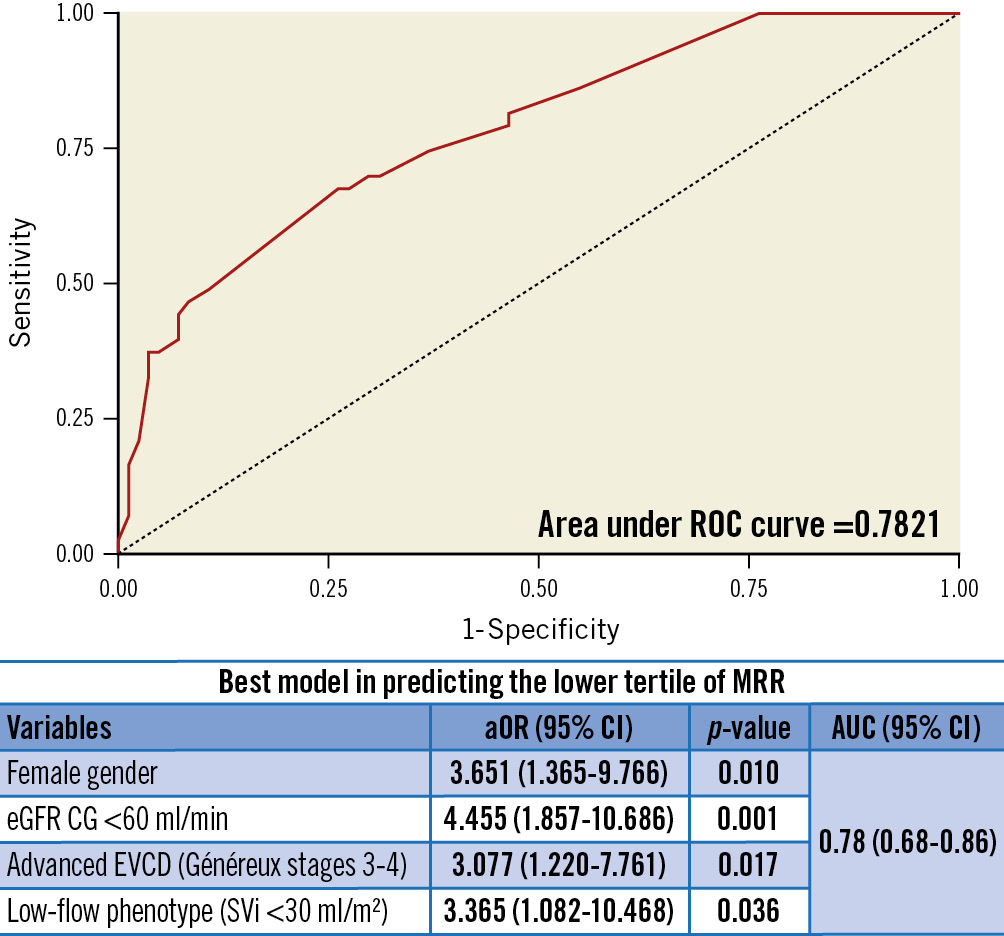
Figure 3. Predictors of low pre-TAVI microvascular resistance reserve. The multivariable logistic regression model including female gender, eGFR CG <60 ml/min, advanced EVCD (Généreux stages 3-4) and low-flow phenotype (SVi <30 ml/min) demonstrated good accuracy in predicting a low MRR. aOR: adjusted odds ratio; AUC: area under curve; CI: confidence interval; eGFR CG: estimated glomerular filtration rate (Cockcroft-Gault method); EVCD: extravalvular cardiac damage; MRR: microvascular resistance reserve; ROC: receiver operating characteristic; SVi: stroke volume index; TAVI: transcatheter aortic valve implantation
ACUTE VARIATIONS OF CORONARY MICROCIRCULATORY FUNCTION IMMEDIATELY AFTER TAVI
The TAVI procedure was successful in 134 (100%) patients. Overall, MRR tended to improve (2.40 [1.70-3.32] vs 2.66 [1.82-3.42]; p=0.094) and FFR decreased significantly after TAVI (0.90 [0.84-0.94] vs 0.88 [0.83-0.94]; p=0.014). MRR was severely reduced (≤2.0) after TAVI in 38 (28.4%) patients. Conversely, neither CFR (2.0 [1.43-2.67] vs 2.12 [1.45-2.80]; p=0.805) nor RRR (2.23 [1.38-3.36] vs 2.42 [1.70-3.26]; p=0.671) showed significant variations after TAVI (Supplementary Figure 4).
Considering only patients in the lowest tertile of MRR at baseline, we observed a significant improvement of coronary microvascular function after TAVI expressed by MRR (1.40 [1.19-1.72] vs 1.88 [1.42-2.76]; p<0.0001), RRR (1.2 [1.00-1.64] vs 1.68 [1.11-2.69]; p<0.0001) and CFR (1.2 [1.0-1.47] vs 1.42 [1.02-2.28]; p=0.005) (Supplementary Figure 5).
Similarly, in patients with advanced EVCD, MRR improved significantly after TAVI (1.80 [1.26-3.30] vs 2.69 [1.82-3.40]; p=0.014) and RRR showed a trend towards improvement (1.64 [1.13-2.96] vs 2.36 [1.74-3.22]; p=0.091). Conversely, CFR (1.79 [1.20-2.55] vs 2.24 [1.52-2.71], p=0.210) did not change significantly after TAVI (Supplementary Figure 6).
Predictors of early MRR improvement after TAVI are reported in Supplementary Table 3.
Discussion
We demonstrated that invasively assessed CMD is associated with unfavourable features at non-invasive imaging in a multicentre, international, prospective cohort of patients undergoing TAVI (Central illustration). MRR, a novel and recently validated index of microvascular function, is associated with a low-flow phenotype in patients with severe AS. In particular, patients with low MRR exhibited significantly lower SVi compared with the rest of the study cohort. Moreover, CMD is associated with advanced EVCD. In particular, patients with severely impaired MRR tend to show impaired left atrial function, right ventricular dysfunction and pulmonary hypertension. In most of the patients, coronary microvascular function tended to improve. This is likely due to the effect of LV unloading induced by TAVI.
Coronary microvascular function improved significantly after TAVI in the subgroup of patients in the lowest tertile of MRR. However, in a subgroup of patients, MRR remained severely impaired immediately after TAVI. This may be related to the development of structural coronary microvascular dysfunction caused by chronic vascular remodelling with abnormally upraised fixed microcirculatory resistance. Nevertheless, it must be acknowledged that data on long-term variations of MRR after TAVI were not available in this study. Therefore, it is possible that with the regression of LV hypertrophy, microvascular function and, subsequently, MRR may improve over time. Indeed, Rajappan et al demonstrated that CFR does not improve immediately after surgical aortic valve replacement. However, significant variations of CFR were observed up to 12 months after surgery20. Other investigators observed that hyperaemic coronary flow increases significantly, whereas no significant variations in resting coronary flow were observed immediately after TAVI21. Whether MRR may further improve in the long term after TAVI remains to be defined.
MRR, EXTRAVALVULAR CARDIAC DAMAGE AND A LOW-FLOW PHENOTYPE
The left ventricular response to AS is initially adaptive, but it becomes soon maladaptive with excessive LV hypertrophy and concentric remodelling822. Increased LV filling pressures translate into left atrial dysfunction and high pulmonary pressures and, ultimately, into right ventricular dysfunction and low cardiac output822. EVCD is associated with adverse long-term clinical outcomes in AS patients treated with TAVI56. In this study, low MRR was associated with right ventricular dysfunction, high pulmonary pressures and a low stroke volume index. Therefore, impaired MRR could emerge as a possible marker of EVCD and a low-flow AS phenotype.
CMD was previously associated with myocardial fibrosis in patients with LF LG-AS, and fibrosis is likely to contribute to LV adverse remodelling exacerbating subendocardial ischaemia12324.
We previously demonstrated that coronary microcirculatory resistances are abnormally elevated in specific subgroups of patients with AS. In fact, LF LG-AS were associated with a high index of microcirculatory resistance and low CFR in a previous prospective investigation7. In this study we confirmed and further expanded our observations in a larger and multicentric cohort assessed with thermodilution-based invasive coronary physiology. Notably, MRR, CFR and RRR were significantly lower in patients with LF LG-AS, confirming the severity of coronary microcirculatory function impairment in this subset. Whether CMD plays a key role in the pathophysiology of patients with LF LG-AS or can be seen as a marker of end-stage low-flow state remains to be determined.
CLINICAL IMPLICATIONS OF CORONARY MICROVASCULAR ASSESSMENT IN TAVI CANDIDATES
This study provided insights on the complex interplay between coronary microvascular function, LV remodelling and EVCD in patients with AS. Notably, the MRR threshold used in this study to define CMD was very similar to the best cutoff observed by other investigators in a different clinical setting19. Patients with CMD (MRR ≤2.0) showed unfavourable echocardiographic features with signs of advanced and potentially irreversible cardiac damage. On one hand, subclinical abnormalities in coronary microvascular function might reveal initial signs of adverse cardiac remodelling. On the other hand, overt impairment of coronary microvascular function, detected at the end stage in the natural history of AS and depicted in this study as low MRR, may act as a marker of disease severity and poor prognosis. This hypothesis requires future additional dedicated investigations.
Limitations
The results of this study must be analysed in light of some limitations, and they should be considered hypothesis-generating, requiring further investigation to confirm our initial observations. First, the sample size was relatively small. However, to the best of our knowledge, this is the largest reported cohort of patients with severe AS who underwent invasive thermodilution-derived assessment of coronary microcirculation. Second, some variability in the eligibility criteria and in the modality of the microvascular assessment in the 3 subcohorts of this study may have introduced biases. In particular, differences in the exclusion criteria at the 3 enrolling centres, as reported in the supplementary material, must be acknowledged. Moreover, coronary microvascular assessment was performed using continuous intracoronary infusion of saline for absolute flow derivation in a subgroup of patients and using bolus thermodilution in the rest of the study population. Indeed, unlike bolus thermodilution assessment, absolute flow assessment based on continuous intracoronary infusion of saline is considered operator-independent. Moreover, saline infusion at 20 ml/min induces particularly stable hyperaemic conditions without significant haemodynamic influence. However, the formula used for MRR derivation in this study allows the possible impact of pharmacologically induced hyperaemia on coronary haemodynamics to be taken into account in patients who underwent microvascular assessment based on bolus thermodilution, as described in the MRR original validation study3.
Third, long-term data on coronary microvascular assessment and non-invasive cardiac imaging after TAVI were not available. Fourth, this study was not designed to assess differences in prognosis, and long-term clinical outcomes were not available. Larger prospective studies with long-term follow-up are warranted to define the prognostic role of CMD in patients undergoing TAVI and to identify the best cutoff value of MRR for risk stratification in this specific clinical setting.
Conclusions
In this observational, hypothesis-generating study, coronary microvascular dysfunction, defined by thermodilution-derived MRR, was associated with extravalvular cardiac damage and a low-flow phenotype in patients with severe AS undergoing TAVI. Further investigations are needed to assess whether MRR is a valuable prognostic marker in patients undergoing TAVI.
Impact on daily practice
Being associated with advanced extravalvular cardiac damage and a low-flow aortic stenosis phenotype, severely impaired microvascular resistance reserve (MRR) can be considered a marker of disease severity in patients with aortic stenosis undergoing transcatheter aortic valve implantation (TAVI).
Further investigations are awaited to assess the prognostic impact of coronary microvacular dysfunction in patients with aortic stenosis. Whether patients with moderately impaired coronary microvascular function are associated with early signs of adverse cardiac remodelling and if they can be considered for early treatment remains to be defined.
Funding
This study was partially funded by a research grant from Abbott (n.1333-12/2020).
Conflict of interest statement
R. Scarsini reports research grant from Abbott and Philips; and speaker fees from Abbott. F. Ribichini reports research grant from Abbott and Philips. P. Paolisso, M. Belmonte, and D.T. Bertolone are supported by a research grant from the CardioPaTh PhD Program. E. Barbato declares speaker fees from Abbott, Boston Scientific, and GE HealthCare. B. De Bruyne has received consultancy fees from Boston Scientific and Abbott; research grants from Coroventis Research, Pie Medical Imaging, CathWorks, Boston Scientific, Siemens, HeartFlow, and Abbott; and owns equity in Siemens, GE HealthCare, Philips, HeartFlow, Edwards Lifesciences, Bayer, Sanofi, and Celiad. M.B. Ancona received consultant fees from Abbott and Abiomed. M. Montorfano is a proctor for Abbott, Kardia, and Boston Scientific. The other authors have no conflicts of interest to declare.
Supplementary data
To read the full content of this article, please download the PDF.