Abstract
Low-flow, low-gradient severe aortic stenosis (AS) is characterised by a small aortic valve area (AVA) and low mean gradient (MG) secondary to a low cardiac output and may occur in patients with either a preserved or reduced left ventricular ejection fraction (LVEF). Symptomatic patients presenting with low-flow, low-gradient severe AS have a dismal prognosis independent of baseline LVEF if managed conservatively and should therefore undergo aortic valve replacement if feasible. Transthoracic echocardiography (TTE) is the first-line investigation for the assessment of AS haemodynamic severity. However, when confronted with guideline-discordant AVA (small) and MG (low) values, there are several reasons other than severe AS combined with a low cardiac output which may lead to such a situation, including erroneous measurements, small body size, inherent inconsistencies in the guidelines’ criteria, prolonged ejection time and aortic pseudostenosis. The distinction between these various entities poses a diagnostic challenge. However, it is important to make a distinction because each has very different implications in terms of risk stratification and therapeutic management. In such instances, cardiac catheterisation forms an integral part of the work-up of these patients in order to confirm or refute the echocardiographic findings to guide management decisions appropriately.
Introduction
Severe aortic stenosis (AS) is associated with a dismal outcome once symptoms ensue unless the obstruction is mechanically removed1,2. Transvalvular pressure gradient and aortic valve area (AVA) are the most important parameters to determine AS haemodynamic severity, and their accurate measurement is essential to guide patient management3,4. The European Society of Cardiology guidelines define severe AS as an AVA <1.0 cm2 and a mean gradient (MG) >40 mmHg in the presence of a normal cardiac output3. Transthoracic echocardiography (TTE) is the first-line investigation for the assessment of AS severity3,4. Invasive evaluation using cardiac catheterisation is recommended by the guidelines when non-invasive data are non-diagnostic or if there is a discrepancy between clinical and echocardiographic evaluation4. When MG and AVA are guideline concordant (e.g., AVA <1 cm2 and MG >40 mmHg), no further investigations of haemodynamic AS severity are usually required and management decisions are typically straightforward3,4. Diagnostic dilemmas arise when guideline discordant values such as an AVA in the severe range (i.e., AVA <1 cm2) and an MG in the moderate range (i.e., <40 mmHg) are found5-9. In the presence of true severe AS such discordance is related to low transvalvular flow, since the pressure gradient is directly proportional to the squared function of flow such that even a small reduction in flow rate can result in significant reductions in pressure gradient (Table 1)10. While this condition, known as low-flow, low-gradient severe AS, has classically been associated with left ventricular systolic dysfunction (LEF-LG)11, recently it has been shown to occur even among patients with preserved LV systolic function but reduced transvalvular flow, a condition referred to as “paradoxical” low-flow, low-gradient (PLF-LG) severe AS (Figure 1)9. The prevalence of “classic” LEF-LG severe AS is 5-10%12, whereas that of PLF-LG is typically higher (5-25%)10. Patients presenting with symptomatic low-flow, low-gradient severe AS and either reduced or preserved LV systolic function have a poor prognosis if managed conservatively and should undergo aortic valve replacement if feasible3,4,9,13-15. Transcatheter aortic valve implantation (TAVI) is also a feasible therapeutic option for these patients16-19. However, low-flow, low-gradient severe AS poses a diagnostic challenge as severe AS combined with a low cardiac output is not the only cause of guideline discordant AVA (small) and MG (low) values. Other reasons for this presentation include measurement errors, small body size, inherent discrepancies in the guidelines’ criteria, prolonged left ventricular ejection time and pseudosevere AS10,20. The accurate distinction between these various entities is critical, given that they may have very different implications in terms of risk stratification and therapeutic management. The most reliable and efficient way to do this in a symptomatic patient is to perform an invasive evaluation of AS severity by directly recording the transvalvular pressure gradient and calculating the AVA using the Gorlin equation. Furthermore, a dobutamine stress test assessing the presence of contractile reserve and excluding pseudostenosis can be safely performed in the catheterisation laboratory4,21. These ancillary investigations can be done easily at the time of coronary angiography, which is recommended by the 2014 American Heart Association/American College of Cardiology guidelines before valve intervention in all patients with decreased LV systolic function, history of coronary artery disease, or coronary risk factors (including men aged >40 and post-menopausal women)4. This recommendation encompasses all patients with “classic” LEF-LG and most patients with PLF-LG, who typically tend to be older females.
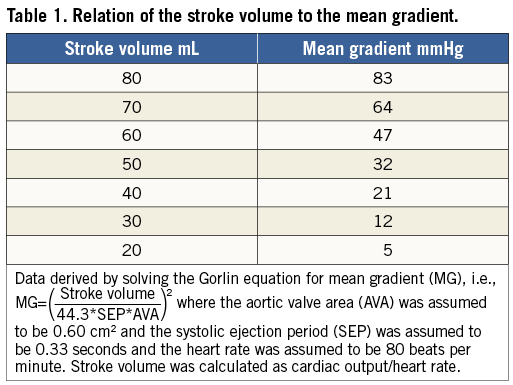
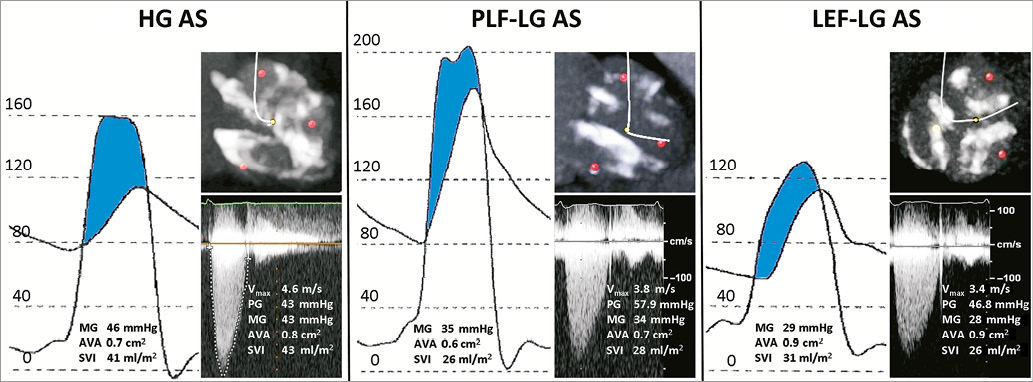
Figure 1. Cardiac catheterisation (simultaneous pressure recording) and echocardiographic findings in patients with high-gradient (HG), paradoxical low-flow, low-gradient (PLF-LG), and low ejection fraction, low-flow, low-gradient (LEF-LG) severe aortic stenosis. Multidetector computed tomography (MDCT) demonstrated comparable levels of aortic valve calcification in all patients. Doppler echocardiography versus cardiac catheterisation
Current guidelines do not distinguish between catheterisation and Doppler measurements, as though values for gradient and AVA derived from either method were synonymous3,4. Furthermore, cut-off values used for defining the haemodynamic severity of AS are based on data derived from catheterisation studies, whereas Doppler measurements are used in routine clinical practice22. The guideline assumptions are problematic for two reasons. First, pressure recovery can cause significant discrepancies between Doppler echo and cardiac catheterisation-derived pressure gradients owing to the fact that kinetic energy of blood is converted back to potential energy downstream in the ascending aorta23. Therefore, catheterisation-derived gradients are lower than those derived from Doppler echocardiography. This phenomenon is particularly accentuated in patients with small aortic diameters (<30 mm) or aortic valve orifices in the moderate to severe range (AVA 0.8 cm2–1.2 cm2)22. However, it is the net gradient recorded at catheterisation which reflects the true haemodynamic significance of a stenosis22. Second, Doppler echocardiography measures the effective orifice area, whereas cardiac catheterisation attempts to measure the anatomic valve area22,24. Because flow streamlines continue to contract for a variable distance after the anatomical orifice, the echo-derived effective orifice area is smaller than the anatomic AVA24. The net effect is that echo tends to yield larger pressure gradients and smaller valve areas as compared with catheterisation measurements (assuming no measurement errors), and therefore systematically overestimates AS severity.
Limitations with echocardiographic MG and AVA calculation
All TTE measurements are operator-dependent and require sufficient image quality to obtain accurate recordings. For example, a non-parallel intercept angle between the ultrasound beam and the left ventricular outflow tract (LVOT) and aortic Doppler signals may lead to underestimation of the transvalvular aortic gradient (Figure 2). Measurements of the LVOT diameter are particularly prone to error due to considerable inter- and intra-observer variability. For example, in patients presenting with a densely calcified aortic valve or irregular calcium mass at the level of the aortic annulus, accurate assessment of the LVOT dimensions may be particularly challenging. This can potentially result in overestimation or underestimation of the AVA as the LVOT diameter is squared in the continuity equation. Furthermore, the continuity equation assumes a circular LVOT cross-section, whereas anatomic studies and three-dimensional imaging observed an elliptical shape in most patients25. As a consequence, LVOT area and EOA are systematically underestimated using two-dimensional imaging. Another potential source of error is the exclusion of the subvalvular velocity from the calculation of the transvalvular gradient, which is always considered negligible (<1 m/s) using the simplified Bernoulli equation. However, this assumption is not applicable in the presence of significant subvalvular stenosis. As a consequence, Doppler echocardiography may overestimate the transvalvular gradient when serial stenoses are present26.
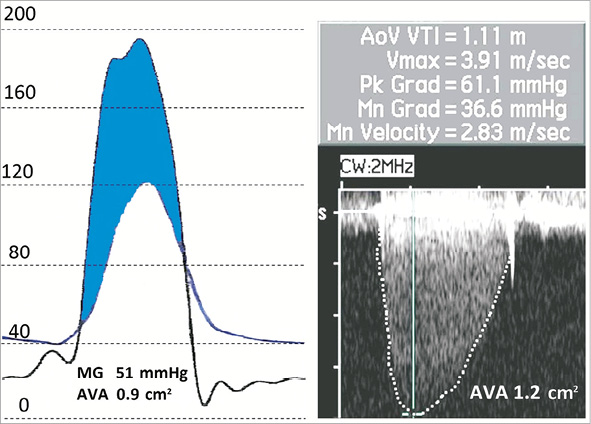
Figure 2. Underestimation of the mean gradient with the use of echocardiography due to measurement error. This patient was confirmed as having high-gradient severe aortic stenosis during cardiac catheterisation and subsequently underwent transcatheter aortic valve implantation with marked symptomatic improvement. Limitations with invasive AVA calculation
AVA is calculated in both the non-invasive and invasive laboratories using the same basic hydraulic formula, i.e., flow=area*velocity,
therefore area=![]() .
.
During cardiac catheterisation the denominator in the equation (i.e., velocity) is not directly measured but can be imputed with the Torricelli law from the catheter-derived pressure gradient using the following formula: velocity=![]() , where g is the velocity of acceleration resulting from gravity (i.e., 980.67 cm.s–2) and ΔP is the pressure gradient24. The numerator, cardiac output, can be determined using either the Fick method (i.e.,
, where g is the velocity of acceleration resulting from gravity (i.e., 980.67 cm.s–2) and ΔP is the pressure gradient24. The numerator, cardiac output, can be determined using either the Fick method (i.e., ![]() ) or thermodilution method24. Oxygen content is directly assessed in catheterisation laboratories employing the Fick method by calculating the arteriovenous oxygen difference. Conversely, oxygen consumption (VO2) is frequently estimated using various normograms and formulas usually based on age, weight, body surface area (BSA) or a combination thereof (e.g., LaFarge formula), because direct measurement of VO2 is time-consuming, cumbersome and uncomfortable for the patient24. However, Gertz et al showed that, as compared with direct VO2, estimates of VO2 based on body size significantly overestimate the cardiac output, while use of the LaFarge formula significantly underestimated it and ipso facto resulted in misclassification of AS severity27. In fact, the same investigators found that the best equations for estimating VO2 in both an elderly population and patients with low cardiac output and severe AS were 2.5*weight (kg) and 100**BSA28. Many laboratories now use thermodilution based on an indicator dilution methodology to measure cardiac output. This method is usually accurate in patients with a normal or high output who are in normal sinus rhythm. However, it becomes inaccurate in patients with low-cardiac-output states, significant tricuspid regurgitation, irregular rhythms and intracardiac shunts24. The original Gorlin formula for calculating AVA stated that Aanat=F/(Cc*Cv*
) or thermodilution method24. Oxygen content is directly assessed in catheterisation laboratories employing the Fick method by calculating the arteriovenous oxygen difference. Conversely, oxygen consumption (VO2) is frequently estimated using various normograms and formulas usually based on age, weight, body surface area (BSA) or a combination thereof (e.g., LaFarge formula), because direct measurement of VO2 is time-consuming, cumbersome and uncomfortable for the patient24. However, Gertz et al showed that, as compared with direct VO2, estimates of VO2 based on body size significantly overestimate the cardiac output, while use of the LaFarge formula significantly underestimated it and ipso facto resulted in misclassification of AS severity27. In fact, the same investigators found that the best equations for estimating VO2 in both an elderly population and patients with low cardiac output and severe AS were 2.5*weight (kg) and 100**BSA28. Many laboratories now use thermodilution based on an indicator dilution methodology to measure cardiac output. This method is usually accurate in patients with a normal or high output who are in normal sinus rhythm. However, it becomes inaccurate in patients with low-cardiac-output states, significant tricuspid regurgitation, irregular rhythms and intracardiac shunts24. The original Gorlin formula for calculating AVA stated that Aanat=F/(Cc*Cv*![]() ), where Aanat is anatomical AVA, F is flow or stroke volume, Cc and Cv are the coefficients of contraction and velocity loss, respectively29. Cc attempts to correct the flow area to the anatomic area, whereas Cv allows for the fact that not all of the pressure gradient is converted to flow because some of the velocity is lost to friction within the valve. Because blood viscosity, turbulence, pulsatile flow, and the inconstant shape of deformed valves made it almost impossible to predict the discharge coefficient analytically, the Gorlins used an empirical constant to make their calculated mitral valve areas align better with actual valve areas obtained at autopsy or surgery29. However, an empirical constant was not developed for the aortic valve and is in fact assumed to be 1, which is theoretically impossible. Therefore, the final Gorlin formula is Aanat=
), where Aanat is anatomical AVA, F is flow or stroke volume, Cc and Cv are the coefficients of contraction and velocity loss, respectively29. Cc attempts to correct the flow area to the anatomic area, whereas Cv allows for the fact that not all of the pressure gradient is converted to flow because some of the velocity is lost to friction within the valve. Because blood viscosity, turbulence, pulsatile flow, and the inconstant shape of deformed valves made it almost impossible to predict the discharge coefficient analytically, the Gorlins used an empirical constant to make their calculated mitral valve areas align better with actual valve areas obtained at autopsy or surgery29. However, an empirical constant was not developed for the aortic valve and is in fact assumed to be 1, which is theoretically impossible. Therefore, the final Gorlin formula is Aanat=![]() where 44.3=
where 44.3=![]() , although the equation ignores the conversion of cmH2O to mmHg and the mass density of blood22. These factors are important in understanding that invasively calculated valve areas also have limitations in the assessment of AS haemodynamic severity.
, although the equation ignores the conversion of cmH2O to mmHg and the mass density of blood22. These factors are important in understanding that invasively calculated valve areas also have limitations in the assessment of AS haemodynamic severity.
Invasive work-up of “classic” low-flow, low-gradient severe AS: differentiating “true-severe” from “pseudo-severe” aortic stenosis
True severe AS is considered present when the MG increases to greater than 30-40 mmHg but the AVA remains fixed at <1.0-1.2 cm2 at peak dobutamine infusion12. Conversely, pseudosevere AS is present when the MG remains unchanged but the AVA increases in size with increasing dobutamine doses12. Nishimura et al previously demonstrated the safety and diagnostic efficacy of performing a dobutamine challenge in the catheterisation laboratory21. This can easily be performed at the time of coronary angiography and is arguably safer than in the echocardiography laboratory since the patient can be intensely monitored and promptly treated for any occurrences of dobutamine-induced arrhythmias. This is reflected in the 2014 AHA/ACC guidelines which state that low-dose dobutamine stress testing can be performed using either echocardiographic or invasive haemodynamic measurements4. The MG threshold at which a low-dose dobutamine challenge should be performed has been debated. The AHA/ACC guidelines recommend stress testing among LEF-LG patients with an MG<40 mmHg4. However, a previous study argued that only patients with an MG ≤30 mmHg require stress testing since all LEF-LG patients with an MG >30 mmHg in conjunction with a small AVA were observed to have severe AS at the time of operation in this particular study21.
Contractile reserve is absent in about one third of patients with classic LEF-LG severe AS. This poses a diagnostic challenge because the degree of stenosis severity often remains indeterminate after DSE10. In such situations the mean transvalvular flow rate (Q) can be derived by dividing stroke volume by LV ejection time (echo) or systolic ejection period (catheterisation) to derive the simplified projected AVA to determine the projected valve area at normal flow rate:
![]()
where AVArest and Qrest are AVA and Q at rest, and AVApeak and Qpeak are AVA and Q measured at peak dobutamine infusion30. However, in ≈10-20% of cases the increase in Q is insufficient to determine the AVAproj, and in such cases multidetector computed tomography (MDCT) may be useful for determination of the aortic valve calcium load and density, with patients having higher values being more likely to have severe AS10.
It is important to note that retrograde catheterisation of the aortic valve in valvular stenosis is associated with an increased risk of cerebral embolism31.
Invasive work-up of “paradoxical” low-flow, low-gradient severe AS
Guideline discordant AVA (small) and MG (low) values are present in up to a third of patients with aortic stenosis and preserved LV systolic function (LVEF ≥50%) and may be due to measurement errors, small body size, inherent inconsistencies in the guidelines’ criteria, a prolonged ejection time or PLF-LG severe AS5,6,10. Because symptomatic patients with the latter condition have a dismal outcome if managed conservatively9,15, it is important to exclude other causes of guideline discordant presentations which do not require aortic valve replacement. An invasive evaluation can play a critical role in helping to accomplish this, as demonstrated in Figure 3.
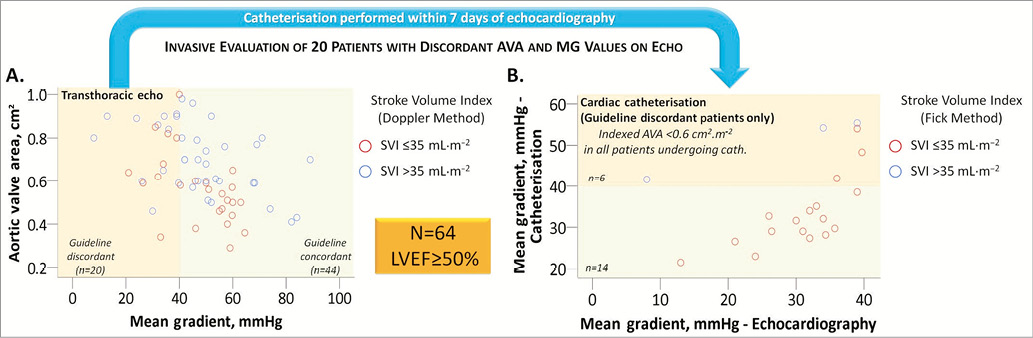
Figure 3. Invasive evaluation of symptomatic patients with guideline discordant aortic valve area (AVA) and mean gradient (MG) values on transthoracic echocardiography (TTE). A) Scatter plot of 64 patients with preserved left ventricular ejection fraction (≥50%) undergoing TTE prior to transcatheter aortic valve implantation (TAVI) at our institution*. 44/64 (69%) patients had guideline concordant MG and AVA values, whereas 20/64 (31%) had guideline discordant values. B) Scatter plot of the 20 patients with guideline discordant AVA and MG values on TTE who subsequently underwent cardiac catheterisation within seven days of TTE. Six patients were found to have a high gradient on catheterisation, whereas 14 patients were confirmed to have a low gradient. All 14 patients with a low MG on catheterisation had a low stroke volume index (≤35 mL·m–2) calculated using the Fick method, thereby confirming the diagnosis of “paradoxical” low-flow, low-gradient severe aortic stenosis. All 20 patients were therefore subsequently referred for TAVI. Had the invasive evaluation not been performed, the TTE-diagnosed normal-flow, low-gradient patients (blue circles) in panel A might have been deemed to have guideline discordant values secondary to the inherent discrepancies in the guidelines’ criteria and might have been inappropriately treated medically. *Bern University Hospital, Switzerland. Measurement errors
Measurement errors can occur with the use of TTE for the various reasons discussed above. However, several methods may be used to corroborate AVA and stroke volume measurements non-invasively. For example, in the absence of significant mitral regurgitation, measurement errors in stroke volume calculation occurring with the use of TTE can be reduced by corroborating Doppler stroke volumes with volumetric stroke volume obtained by multiplying the LVEF by the LV end-diastolic volume derived by the Teichholz formula and by measuring the peak aortic jet velocity in all available transducer windows using a non-imaging continuous wave Doppler transducer7. Nevertheless, measurement error may persist despite these methods, particularly in patients with poor acoustic windows, and in such cases an invasive evaluation is essential to determine the invasive MG and AVA calculated using the Gorlin equation.
Small body size
Patients with small body size tend to have smaller LV cavities and therefore produce lower stroke volumes and ultimately have lower mean gradients. Therefore, small body size may result in discordant AVA and MG values. However, this situation can easily be resolved by indexing the AVA to body surface area with patients having an indexed AVA ≤0.6 cm2·m–2 having severe AS12.
Inherent inconsistencies in the guidelines’ criteria
Carabello previously demonstrated that an AVA of 0.9 cm2 in fact corresponds to a mean gradient of 32 mmHg in the presence of a normal cardiac output (six litres per minute) meaning that the guidelines themselves are inherently inconsistent1. Therefore, patients with discordant AVA (small) and MG (low) values with normal flow (SVI >35 mL·m–2) are most likely to have severe AS secondary to the inherent inconsistencies in the guidelines’ criteria.
Prolonged LV ejection time
Because LV ejection time is in the denominator of the equation for calculating the transvalvular flow rate (i.e., transvalvular flow rate=![]() ), a prolonged ejection period results in a lower gradient for a given AVA and stroke volume10.
), a prolonged ejection period results in a lower gradient for a given AVA and stroke volume10.
Paradoxical low-flow, low-gradient severe AS
Once the reasons above have been ruled out, patients presenting with a low-gradient, small AVA and preserved LV systolic function probably have PLF-LG severe AS if the stroke volume index is reduced (≤35 mL·m–2)9,15. However, pseudostenosis may also occur in this patient population, and dobutamine stress echocardiography may be required to diagnose true severe AS as proposed by Cavel et al32. No studies to date have validated the use of invasive dobutamine stress testing among patients with PLF-LG severe AS, and therefore further studies are required in this area. Previous studies have shown that patients with PLF-LG have clinical outcomes similar to patients with high-gradient severe AS; yet, symptomatic patients are less likely to be referred for aortic valve replacement because treating physicians often misinterpret the low gradient to imply only moderate AS9,12,15. It is also important to note that systemic hypertension can influence the assessment of AS severity (generally causing overestimation of severity)33. Eleid et al demonstrated in an invasive haemodynamic study that the administration of a vasodilator reduced the arterial afterload in patients with PLF-LG severe AS, which resulted in an increased stroke volume and higher gradients33. This elegant study demonstrated that the left ventricles of patients with PLF-LG severe AS in fact face a double load, i.e., a valvular load from the severe AS and an arterial load from the systemic hypertension. Therefore, patients with PLF-LG severe AS and co-existent hypertension should first have their blood pressure controlled prior to reassessing AS severity and symptomatic status. This has been recommended by the recent AHA/ACC valvular heart disease guidelines4.
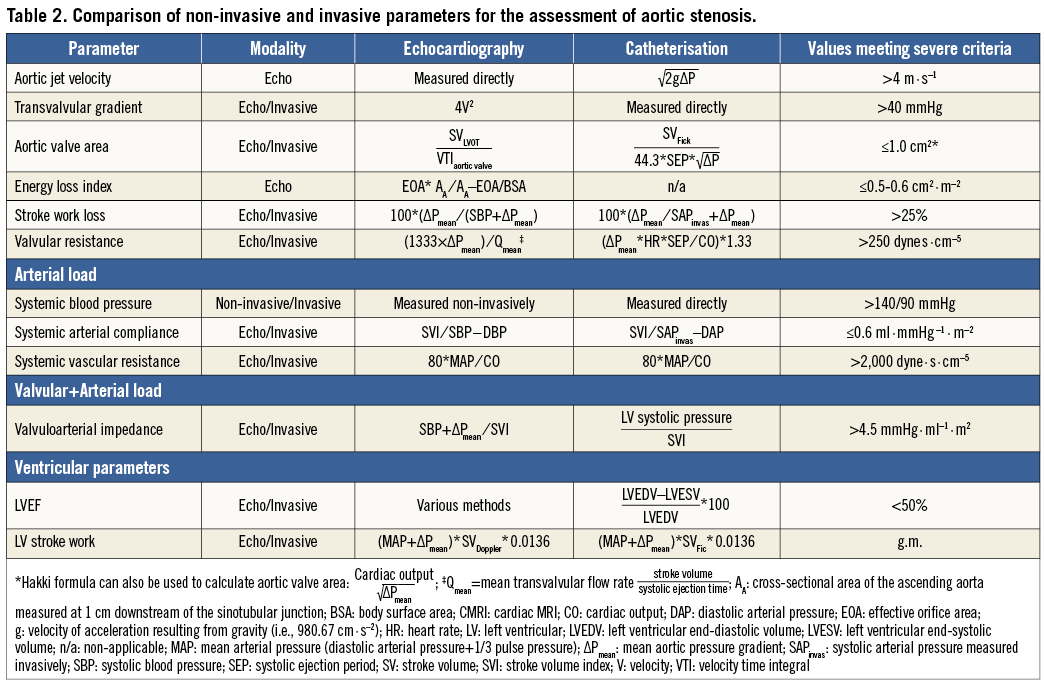
Parameters to assess aortic stenosis haemodynamic severity other than mean gradient and AVA
In addition to AVA and MG, there are in fact several other parameters which may be considered in the global evaluation of AS haemodynamic severity (Table 2)34. The valvuloarterial impedance (Zva) is a haemodynamic measure of the global load (i.e., valvular+arterial load) faced by the left ventricle35. The Zva can be assessed indirectly using echocardiography or directly using catheterisation (Table 2)20. Whether invasively derived Zva is associated with worse outcomes after TAVI has yet to be determined.
Conclusion
Patients presenting with symptomatic low-flow, low-gradient severe aortic stenosis and either reduced or preserved LV systolic function have a dismal prognosis if managed conservatively and should therefore undergo aortic valve replacement if feasible. However, other causes for small AVA and low MG measurements must first be excluded. Because erroneous measurements are not infrequent with echocardiography and non-invasive corroborative methods may remain inconclusive, an invasive evaluation should be considered a sine qua non in the evaluation of low-flow, low-gradient AS haemodynamic severity.
Funding
This study was supported in part by an unrestricted research grant from Medtronic to the University of Bern, Switzerland.
Conflict of interest statement
S. Windecker has received research contracts to the institution from Biotronic and St. Jude. P. Wenaweser has received proctoring and lecture fees from Medtronic and Edwards Lifesciences. The other authors have no conflicts of interest to declare.