Abstract
Aims: Quantitative flow ratio (QFR) based on three-dimensional quantitative coronary angiography (3D-QCA) is a novel method to assess physiological functionality after treatment with stents. The current study aimed to evaluate the difference in physiological functionality nine months after implantation of a bioresorbable polymer-based sirolimus-eluting stent with an electrografting base layer (BuMA Supreme: B-SES) versus a durable polymer-based zotarolimus-eluting stent (Resolute: R-ZES).
Methods and results: The current post hoc analysis was performed in the PIONEER randomised trial (1:1 randomisation to B-SES [83 patients/95 lesions] and R-ZES [87 patients/101 lesions]). QFR was measured in stented vessels in both arms at preprocedural, post-procedural and nine-month angiography without pharmacologically induced hyperaemia (contrast QFR). At nine months, both the values of QFR distal to the stent (B-SES: 0.89±0.10 vs. R-ZES: 0.89±0.11, p=0.97) and the number of vessels with QFR ≤0.8 were not significantly different between the two groups (11.0% vs. 12.8%, p=0.72), while the in-stent binary restenosis rate was also comparable (3.7% vs. 3.5%, p=1.00). QFR gradient across the device (∆QFR) at nine months was also similar between the groups (B-SES: 0.03±0.04 vs. R-ZES: 0.03±0.07, p=0.95).
Conclusions: Quantitative flow assessment nine months after stenting did not differ between B-SES and R-ZES, despite a significant difference in in-stent late lumen loss.
Abbreviations
∆QFR: QFR gradient across the device
AUC: area under the receiver operating characteristic curve
DES: drug-eluting stent
FFR: fractional flow reserve
LLL: late lumen loss
QCA: quantitative coronary angiography
QFR: quantitative flow ratio
SES: sirolimus-eluting stent
TLR: target lesion revascularisation
ZES: zotarolimus-eluting stent
Introduction
Angiographic late lumen loss (LLL) is considered a reliable discriminator to differentiate the performances of various coronary devices such as balloons, stents and bioresorbable scaffolds1-3. However, in the current drug-eluting stent (DES) era, new devices within a very low LLL range have been compared which might have low probabilities of restenotic events, even if there is a statistically significant difference in LLL between the two devices4,5. The clinical significance of comparing devices with very low LLL is debatable.
Fractional flow reserve (FFR) has been considered an accurate diagnostic tool due to its capacity to overcome the limitations of angiography in assessing the functional severity of coronary stenosis6. An increasing body of evidence supports the safety and efficacy of therapeutic decisions based on FFR in multiple clinical and anatomical settings7-9. Quantitative flow ratio (QFR) is a novel approach enabling rapid computation of FFR pullbacks from three-dimensional quantitative coronary angiography (3D-QCA) without using a pressure wire10-13. A QFR ≤0.80 with and without hyperaemic computed flow (adenosine-flow QFR and contrast-flow QFR) was reported to have favourable diagnostic accuracy in identifying a wire-derived FFR of ≤0.8010.
The PIONEER trial was a randomised trial which compared the biodegradable polymer-based cobalt-chromium (CoCr) platform sirolimus-eluting BuMA™ Supreme (SINOMED, Tianjin, China) stent with an electrografting base layer (B-SES) with the durable polymer-coated zotarolimus-eluting Resolute™ stent (R-ZES) (Medtronic, Minneapolis, MN, USA) and aimed to demonstrate the non-inferiority of the B-SES to the R-ZES in terms of nine-month angiographic in-stent LLL. In the current trial, the B-SES did not meet the primary endpoint of non-inferiority14. Although the B-SES was significantly inferior to the R-ZES in terms of in-stent LLL (0.29±0.34 mm vs. 0.14±0.37 mm, pinferiority=0.004), the incidence of device-oriented cardiovascular events (DoCE) at 12 months was not different between the groups (4.9% vs. 5.7% p=1.00). The in-stent binary restenosis rate of the B-SES at nine months was also comparable to the R-ZES (3.3% vs. 4.4%, p=1.00). It was questionable whether statistically different LLL values within a low range impact on the functionality of the restenotic stents. The functional significance of different LLL between the B-SES and R-ZES remained to be investigated.
In the current study, we evaluated the physiological functionality of the LLL in both stents with QFR analysis.
Methods
STUDY DESIGN AND POPULATION
The current study was a post hoc substudy of the PIONEER trial comparing the B-SES with the R-ZES in patients with coronary artery disease to demonstrate non-inferiority of the B-SES to the R-ZES in terms of nine-month angiographic in-stent LLL. The details of the protocol and the main results of the trial have already been reported elsewhere14. The inclusion and exclusion criteria are described in the Supplementary Appendix.
CORONARY ANGIOGRAPHY
In the PIONEER trial, coronary angiography was repeated at nine-month follow-up. All angiography was preceded by an intracoronary injection of isosorbide dinitrate or nitroglycerine. According to the protocol, target lesions were recorded with at least two projections separated by more than 30° to obtain proper LLL in matched angiographic views, from which the 3D lumen reconstruction was derived in the current substudy. In the case of target lesion revascularisation (TLR), pre-TLR angiographic data were analysed as follow-up angiography.
2D QUANTITATIVE CORONARY ANGIOGRAPHY ANALYSIS
Off-line 2D-QCA was performed in an independent core laboratory (Cardialysis, Rotterdam, the Netherlands) with the CAAS system, version 5.11 (Pie Medical Imaging, Maastricht, the Netherlands) according to standard protocol. The following QCA parameters were calculated: minimal lumen diameter, reference vessel diameter (interpolated diameter of normal vessel), percent diameter stenosis ([1–minimum lumen diameter/reference vessel diameter]×100) and late lumen loss (difference between the post-procedure and follow-up minimal lumen diameter). Binary restenosis was defined as stenosis of 50 percent or greater in the target lesion or segment at angiographic follow-up. Measurements within the stented segment were defined as the in-stent analysis. The in-segment analysis included both the in-stent segment and the edge segments which were 5 mm segments proximal or distal to the implantation site.
QUANTITATIVE FLOW RATIO CALCULATION
Details regarding the QFR calculation method have been reported elsewhere10,15. Briefly, the QFR calculation was based on the 3D-QCA reconstructed from two angiographic projections with angles ≥25° apart and volumetric flow rate calculated by using contrast bolus frame count. The 3D-QCA reconstruction and measurements were performed as described previously16. The rate of volumetric flow was assessed with a frame count based on the TIMI frame counting method17.
The QFRs at pre-procedure, post-procedure and nine-month follow-up were assessed using validated software (QAngio XA 3D research edition 1.0; Medis medical imaging systems bv, Leiden, the Netherlands), which received Conformité Européenne (CE) marking certification for clinical usage in April 2017, by two experienced observers (T. Asano and Y. Katagiri). In the current study, the QFR value was computed by using projections without pharmacologically induced hyperaemia (contrast-flow QFR) for the analysis10.
The QFR analysis was performed at the distal point of the target vessel (vessel QFR). The distal point was situated at least distally of the last lesion as long as the lumen diameter was more than 2 mm. In the post-procedural and follow-up angiography, QFR gradient across the device (∆QFRPOST and ∆QFRFU) was also analysed (Figure 1)18. For the assessment of the progression of flow limitation within the device at nine months, the difference in QFR gradient across the device (∆QFRFU-∆QFRPOST) was calculated.
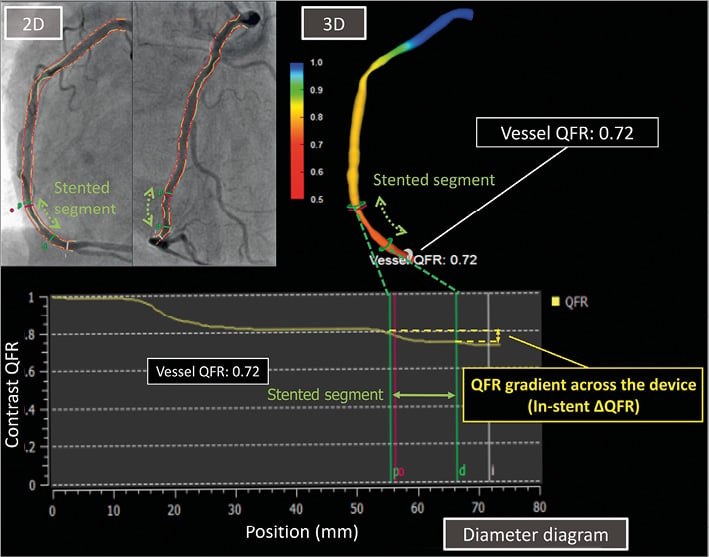
Figure 1. The quantitative flow ratio (QFR) with QAngio XA 3D. QFR calculation was based on the 3D-QCA reconstructed from two angiographic projections with angles ≥25˚ apart and volumetric flow rate calculated by using contrast bolus frame count. QFR analysis was performed at the distal point of the target vessel (vessel QFR). QFR gradient across the device (in-stent ∆QFRPOST and in-stent ∆QFRFU) was analysed in the post-procedural and follow-up angiography.
STATISTICAL ANALYSIS
Data are expressed as mean±SD or median and interquartile range with differences (95% confidence interval). Group means for continuous variables with normal distributions were compared using the Student’s t-test. Categorical variables were compared using the Pearson’s chi-square test or Fisher’s exact test, as appropriate. A cubic polynomial regression analysis was performed to correlate LLL and difference in QFR gradient across the device. Statistical significance was assumed at a probability (p) value of <0.05. Statistical analyses were performed with SPSS, Version 24.0.0 (IBM Corp., Armonk, NY, USA).
Results
STUDY SUBJECTS
In the PIONEER trial, a total of 170 patients were included and randomly assigned to undergo treatment with B-SES (83 patients and 95 lesions) or R-ZES (87 patients and 101 lesions). For the QFR analysis, the lesions without two appropriate angiographic projections with angles ≥25˚ apart or the lesions without data for autocalibration were excluded (Figure 2). All the lesions available for QFR analysis were also analysable by 2D-QCA analysis at each time point. Baseline demographics and procedural characteristics are separately reported in Supplementary Table 1 14.
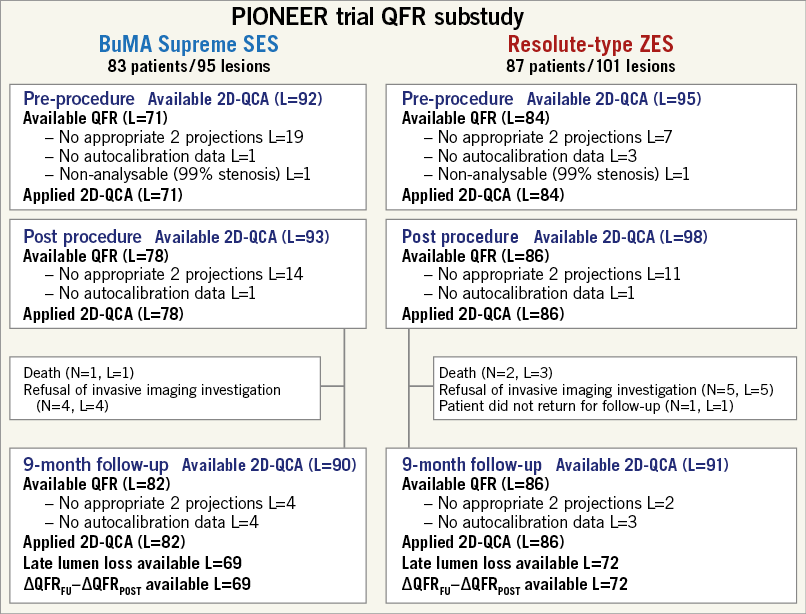
Figure 2. Flow chart of the current study. L: number of lesions; N: number of patients; QCA: quantitative coronary angiography; QFR: quantitative flow ratio; SES: sirolimus-eluting stent; ZES: zotarolimus-eluting stent
2D-QCA ANALYSIS
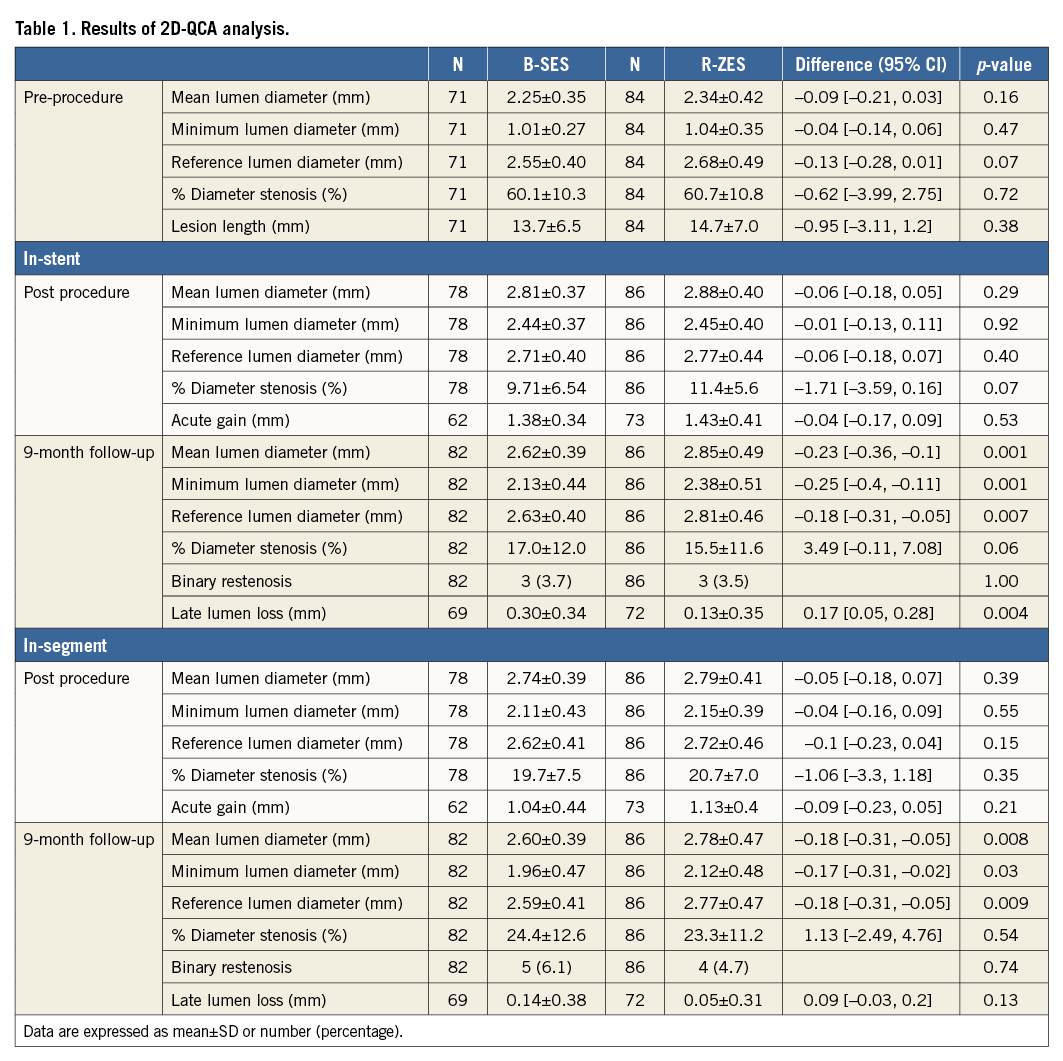
Table 1 summarises the results of 2D-QCA analysis of the population with available QFR. In-stent LLL at nine months was 0.30±0.34 mm in the B-SES group versus 0.13±0.35 mm in the R-ZES group (p=0.004). In-stent %DS at nine months was 17.0±12.0% in the B-SES group and 15.5±11.6% in the R-ZES group (p=0.06).
QFR ANALYSIS
The QFR analysis results are summarised in Table 2. The vessel QFRs at nine months were not significantly different between the two groups (B-SES: 0.89±0.10 vs. R-ZES: 0.89±0.11, p=0.97). The number of lesions with QFR ≤0.8 was nine (11.0% [9/82]) in the B-SES group and 11 (12.8% [11/86]) in the R-ZES group (p=0.72) (Figure 3, Figure 4). The QFR gradient across the device at nine months (∆QFRFU) and the difference in QFR gradient across the device (∆QFRFU-∆QFRPOST) were also similar between the two groups (∆QFRFU: 0.03±0.04 vs. 0.03±0.07, p=0.95, ∆QFRFU-∆QFRPOST: 0.01±0.05 vs. 0.02±0.07, p=0.75). Figure 5 shows the cumulative frequency distribution curves of QFR gradient across the device at nine months (∆QFRFU) plotted with binary restenosis.

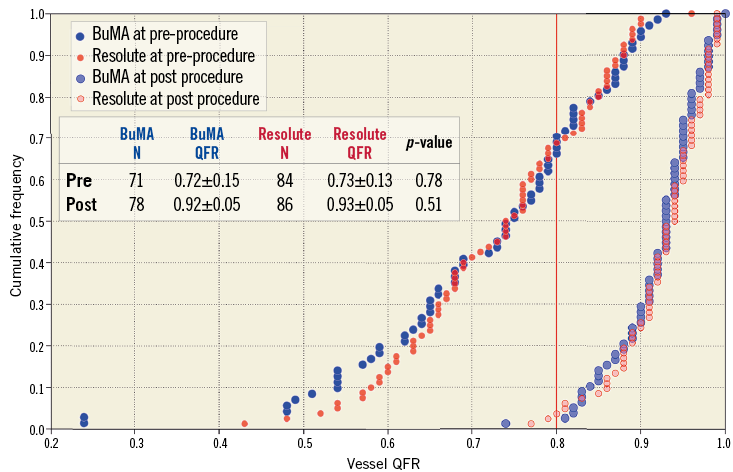
Figure 3. Cumulative frequency distribution curves of vessel QFR pre-procedure and post procedure. Vessel QFR pre-procedure (blue for the BuMA Supreme SES group and red for the Resolute ZES group) and post procedure (light blue for the BuMA Supreme SES group and pink for the Resolute ZES group). N: number of lesions
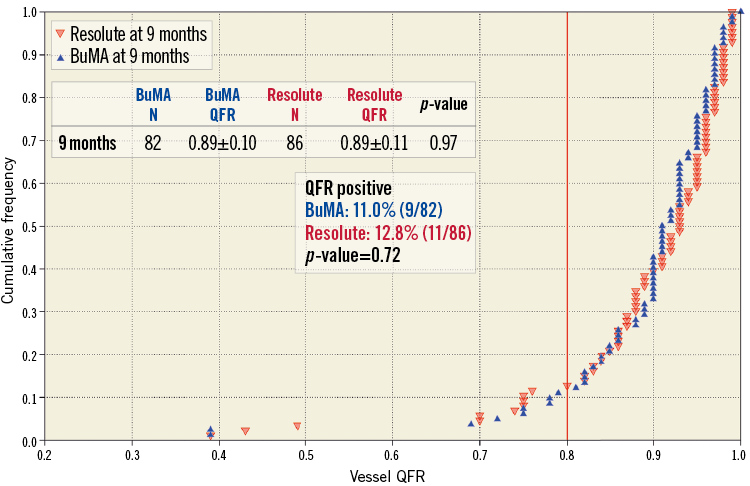
Figure 4. Cumulative frequency distribution curves of vessel QFR at nine months. Vessel QFR at nine-month follow-up (blue for the BuMA Supreme SES group and red for the Resolute ZES group). N: number of lesions
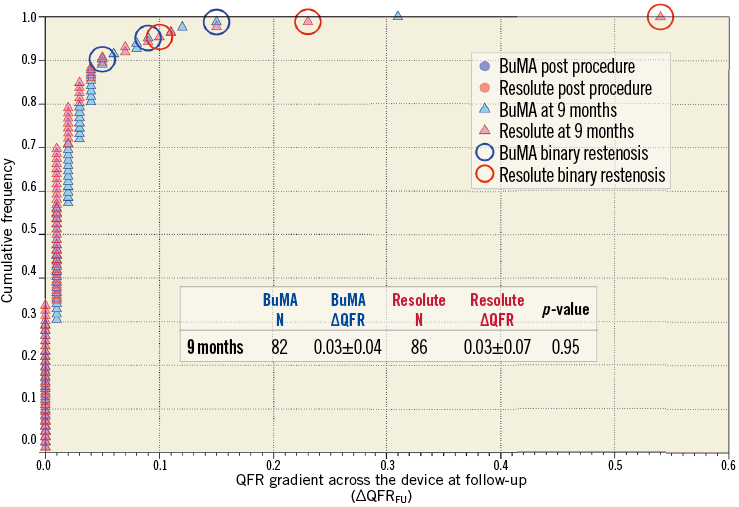
Figure 5. Cumulative frequency distribution curves of in-stent ∆QFR at nine months. In-stent ∆QFR at nine-month follow-up (light blue for the BuMA Supreme SES group and pink for the Resolute ZES group). Lesions with binary restenosis are indicated with a circle. N: number of lesions
Figure 6 shows a correlation between in-stent LLL at nine months and difference in QFR gradient across the device between post procedure and follow-up (∆QFRFU-∆QFRPOST) with scatter plots, in which a regression curve is drawn. The regression curve shows an unapparent increase of difference in QFR gradient across the device (∆QFRFU-∆QFRPOST) within the range of low value of LLL (<0.50 mm), where the LLLs of both device groups are distributed. In contrast, a sharp increase of difference in QFR gradient across the device is observed once LLL reaches more than 0.70 mm.
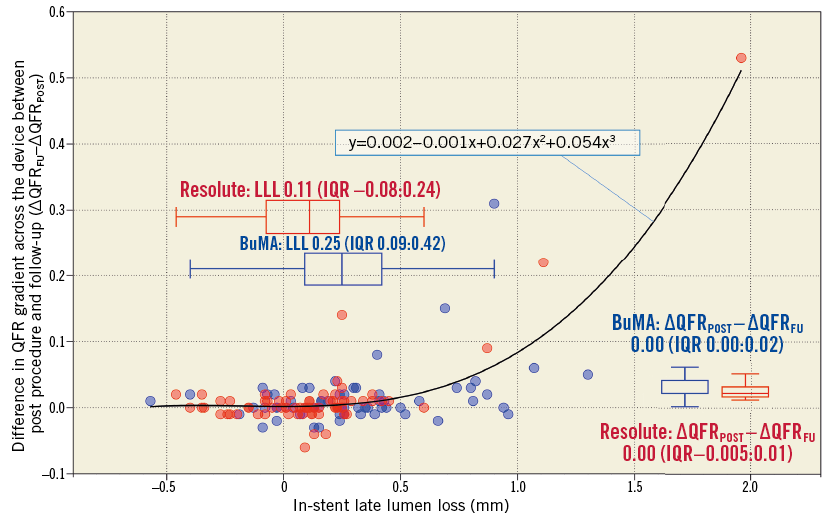
Figure 6. Correlation between difference in QFR gradient across the device and in-stent late lumen loss at nine months. A regression curve is drawn (y=0.002–0.001x+0.027x2+0.054x3, y=∆QFRFU–∆QFRPOST, x=in-stent LLL at nine months). The curve shows an apparent increase in difference in QFR gradient across the device (∆QFRFU–∆QFRPOST) within the range of low value LLL (<0.50 mm), where the LLLs of both device groups are distributed. In contrast, a sharp increase in the difference in QFR gradient across the device is observed once LLL reaches more than 0.70 mm. IQR: interquartile range
Discussion
The major findings of the current substudy can be summarised as follows: 1) despite the in-stent LLL of the B-SES being significantly larger compared to the R-ZES, vessel QFR and QFR gradient across the device at nine-month follow-up (∆QFRFU) in the B-SES arm were comparable to the R-ZES arm; 2) the in-stent LLLs of both groups were still within the range where difference in QFR gradient across the device between post procedure and follow-up (∆QFRFU-∆QFRPOST) has no functional repercussions.
3D-QCA-BASED FFR AND ANGIOGRAPHIC MEASUREMENT
The physiological assessment based on 3D-QCA (FFRQCA) has already been validated with sufficient accuracy and reproducibility in several studies comparing it to wire-derived FFR10,11,15,19,20. The diagnostic accuracy of the contrast-flow QFR for identifying an FFR of ≤0.80 was reported to be 86% (95% CI: 78% to 93%). This was comparable to the QFR value computed with hyperaemia (adenosine-flow QFR), which had a diagnostic accuracy of 87% (95% CI: 80% to 94%)10. In the FAVOR Pilot study and the WIFI II study, the diagnostic performance of QFR was compared to 2D angiographic measurement10,11. The area under the receiver operating characteristic curve (AUC) of contrast-flow QFR to identify a wire-derived FFR of ≤0.80 was larger than % diameter stenosis (AUC: 0.92 [95% CI: 0.84-0.97] vs. 0.72 [95% CI: 0.60-0.82] in the FAVOR Pilot study, 0.86 [95% CI: 0.81-0.91] vs. 0.69 [95% CI: 0.62-0.76] in the WIFI II study)10,11. Tu et al showed the superiority of FFRQCA compared to % area stenosis derived from 3D angiography in terms of the predictive ability for a wire-derived FFR value of ≤0.8 (AUC: 0.93 vs. 0.73)15.
In addition to the difference in the concept between QFR and conventional angiographic parameters, the less favourable predictive ability of conventional angiographic parameters for an FFR value of ≤0.8 is also ascribed to the difference of the region of interest (lesion versus vessel). In the current study, the number of lesions with QFR ≤0.8 was higher than that of angiographic binary restenosis (number of QFR ≤0.8: 9 [11.0%] in the B-SES group and 11 [11.0%] in the R-ZES group, number of binary restenosis: 3 [3.7%] in the B-SES group versus 3 [3.5%] in the R-ZES group) (Figure 4). Nevertheless, QFR gradient across the device (∆QFR) is more comparable to the conventional angiographic parameter measured in the in-stent region of interest. However, as Figure 5 shows, the discrepancy was still observed between ∆QFR and binary restenosis, probably due to the fundamental difference between functional and anatomical assessments.
CLINICAL IMPLICATIONS AND REGULATORY PERSPECTIVE
Figure 6 shows a discrepancy between in-stent LLL (difference in angiographic minimum lumen diameter between post procedure and follow-up) and ∆QFRFU-∆QFRPOST (difference in QFR gradient across the device between post procedure and follow-up). As Figure 6 shows, the difference of LLL within the low value range (<0.50 mm) was less significant from the physiological point of view. In this range of LLL, even if there is significant difference in LLL between two devices, the functionality of these devices does not differ. This suggests that LLL, a surrogate for in-stent neointimal growth, may not be directly correlated with the ischaemia-driven revascularisation, especially with low values of LLL.
In a pooled data analysis of 11 stent trials, Pocock et al demonstrated that LLL and the probability of TLR were not correlated linearly but exponentially3. LLL with a high value range (>0.5-0.7 mm) was associated with an increased probability of TLR, whereas LLL in a low value range was not.
For a quarter of century, LLL has been used as a gold standard to assess the efficacy of coronary devices, not only in clinical studies but also for regulatory purposes21. However, this parameter may no longer reflect device efficacy in the current DES era, since the low values of LLL seem to have neither functional significance nor clinical implication3. In contrast, low LLL is potentially associated with safety issues such as delayed neointimal healing, evagination and malapposition, which in turn are strongly related with device thrombosis22,23. In addition, the efficacy assessment based on the LLL derived from six- to nine-month angiography does not take into account the late “catch-up” phenomenon, which is potentially different among stent designs24. In contrast to durable polymer, bioresorbable polymer has the potential to reduce the risk of progressive neointimal hyperplasia in the late phase25,26.
The optimal parameter validating stent performance should be related to physiological significance and clinical adverse events. Functional assessment based on 3D-QCA has the potential to validate stent performance more fundamentally with less invasiveness and a lower cost compared to wire-derived, although, to date, studies directly evaluating the impact of QFR on clinical outcomes have not been reported. The current post hoc analysis should be considered as hypothesis-generating only and should be prospectively and formally demonstrated.
Study limitations
The study was mainly designed for evaluating angiographic LLL. The physiological assessment based on QFR is a retrospective and non-pre-specified analysis. The number of data points was limited for drawing the regression curve that estimates the correlation between difference in QFR gradient across the device between post procedure and follow-up and in-stent LLL. The current QFR algorithm is based on the classic equation (∆P=FV+SV2) introduced by Young et al and simplified by Gould et al where F is the coefficient of pressure loss due to viscous friction in the stenotic segment (Poiseuille’s law) and S is the coefficient of pressure loss due to flow separation at the diverging end of the stenosis (Bernoulli’s law)10,27-29. Using this equation, QFR is calculated based on lesion length, minimum lumen area and reference area derived from two angiographic views and volumetric flow of a single vessel calculated by using frame count10. This algorithm is simplified compared to the computational flow dynamics (CFD) using the Navier-Stokes equation.
Conclusions
In the PIONEER trial, the functional parameter (QFR) did not differ between B-SES and R-ZES at nine-month follow-up, despite a significant difference in in-stent LLL. In the current DES era, QFR may have the potential to serve as a novel type of assessment of device performance.
| Impact on daily practice In the PIONEER trial, although there was significant difference in nine-month in-stent late lumen loss between B-SES and R-ZES, the functional parameters of QFR did not differ between the two groups. The difference in late lumen loss within the very low value range did not have functional significance. In the current DES era, QFR is potentially a more adequate method for the assessment of device performance. |
Guest Editor
This paper was guest edited by Michail I. Papafaklis, MD, PhD, FESC; Department of Interventional Cardiology, Barts Heart Centre, St Bartholomew’s Hospital, London, United Kingdom.
Conflict of interest statement
P. Serruys, M. Sabate and Y. Onuma are members of the Advisory Board for Abbott Vascular. J. Reiber is the CEO of Medis medical imaging systems and has a part-time appointment at Leiden University Medical Center as Professor of Medical Imaging. C. von Birgelen has been an unpaid consultant to several device-manufacturing companies; his institution, Thoraxcentrum Twente, has received institutional research funding from AstraZeneca, Biotronik, Boston Scientific, and Medtronic. C. Collet has received a research grant from HeartFlow. The other authors have no conflicts of interest to declare. The Guest Editor has no conflicts of interest to declare.
Supplementary data
Supplementary Appendix. Inclusion and exclusion criteria of the PIONEER trial.
Supplementary Table 1. Baseline characteristics in the PIONEER trial.
To read the full content of this article, please download the PDF.
