Abstract
Aims: Following percutaneous coronary interventions (PCI) for revascularisation of chronic total occlusions (CTO) patients are at increased risk for stent thrombosis (ST). Delayed drug-eluting stent (DES) coverage has previously been shown to be related to ST. Using optical coherence tomography (OCT), we tested the hypothesis that CTO-PCI is associated with delayed DES coverage compared to non-CTO lesions.
Methods and results: From 06/2010 to 11/2013, 105 patients (111 lesions) with clinically driven follow-up angiography after PCI with DES received an OCT analysis. Patients with successful CTO-PCI (19 patients/20 lesions, 6.5±2.1 months post PCI) were included in the CTO group, and patients with non-CTO lesions and total stent length >24 mm (28 patients/28 lesions, 4.9±2.2 months post PCI) were used as a control group. Struts were analysed by OCT (CTO vs. control, mean±SD): covered: 68.9±21.9% vs. 89.6±10.4%, p<0.001; uncovered apposed: 20.2±16.2% vs. 7.5±8.7%, p=0.001; uncovered malapposed: 10.9±10.3% vs. 2.9±2.6%, p<0.001. Neointimal thickness was 92.0±61.2 μm vs. 109.3±39.2 μm, p=0.033. No differences concerning different CTO-PCI approaches were found.
Conclusions: A significantly delayed DES coverage after CTO-PCI was observed. Given the known increased rate of ST following CTO-PCI and the known association between delayed DES coverage and ST, OCT may aid in determining the optimal duration of dual antiplatelet therapy after CTO-PCI.
Introduction
Successful percutaneous coronary interventions (PCI) for the revascularisation of chronic total occlusions (CTO) have previously been shown to increase left ventricular function and exercise capacity, and to reduce angina symptoms as well as to increase long-term survival1-3. Recent literature reports success rates between 70 and 86% from experienced operators applying both the antegrade and retrograde techniques if necessary4. Techniques employing a subintimal passage of various lengths are frequently used in CTO revascularisation approaches and have been commonly accepted; however, they disrupt vessel integrity and may result in delayed stent healing5,6. Although interventional CTO revascularisation is performed in many centres, until now no valid in vivo information on drug-eluting stent (DES) strut coverage after CTO revascularisation has been available. The duration of dual antiplatelet therapy (DAPT) following CTO revascularisation is therefore unclear6. Since the introduction of second-generation DES, stent thrombosis (ST) has become a rare but potentially fatal complication of PCI using DES (<0.2% after one year)7. Following CTO revascularisation, this rate is reported to be distinctly higher (1.3% after one year)8,9. The most recent histopathological post-mortem and in vivo studies have demonstrated a significant relation of ST to the presence of uncovered and malapposed stent struts10-13. Optical coherence tomography (OCT) allows for accurate in vivo analysis of stent strut coverage. This technique has been used in several trials to compare strut coverage and apposition for different stent types, at different time points after implantation and for different clinical indications14-17. However, as recently suggested by Jaguszewski and Landmesser, not only stent characteristics but also stent implantation techniques and the underlying clinical scenario determine the process of stent healing18. The present ALSTER-OCT-CTO registry (AskLepios ST. GEoRg’s Hospital-Optical Coherence Tomography for follow-up of Chronic Total Occlusions) used OCT to evaluate coverage of DES implanted after CTO revascularisation in comparison with DES implanted after treatment of non-CTO lesions. We further asked whether different CTO revascularisation approaches, including antegrade wiring, antegrade approach with high penetration wires as well as retrograde dissection and re-entry techniques, result in differences regarding DES coverage and neointimal thickness.
Methods
DESIGN AND PATIENT ENROLMENT
The ALSTER-OCT-CTO registry is a single-centre registry performed at the Department of Cardiology of St. Georg’s Hospital in Hamburg, Germany (Figure 1). As part of the ongoing ALSTER-OCT registry (AskLepios ST. GEoRg’s Hospital Optical Coherence Tomography for follow-up of Drug Eluting Stents), clinically driven control angiography with OCT was performed in 105 patients (111 lesions) between June 2010 and November 2013. Patients with successful CTO revascularisation were included in the CTO group (19 patients/20 CTO lesions). A second OCT at 12.0±2.7 months was available in four patients. Overlapping stent placements and excessive stent lengths are recognised risk factors for delayed coverage and ST12. For creating a viable control group, only patients with total stent lengths >24 mm and non-CTO lesions were used as a control group (28 patients/28 non-CTO lesions). No second follow-up OCT analysis was available concerning the control group.
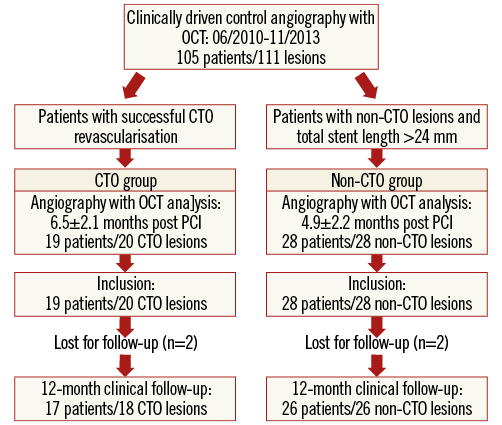
Figure 1. ALSTER-OCT-CTO registry flow chart. Between 06/2010 and 11/2013, clinically driven angiography with OCT was performed in 105 patients with 111 lesions. Patients with successful CTO revascularisation were included in the CTO group, and patients with non-CTO lesions and total stent length >24 mm were used as a control group.
CTO REVASCULARISATION TECHNIQUES
A CTO was defined as a lesion with TIMI grade 0 flow within the occluded segment and evidence of a duration ≥3 months1. The duration of the occlusion was determined by the interval from the last episode of acute coronary syndrome, the basis of clinical symptoms or proved by previous coronary angiography3. Patients with CTOs presenting with symptoms of angina pectoris and/or proven viable myocardium in the target vessel area were eligible for CTO revascularisation1. Success of revascularisation was defined as TIMI flow grade ≥2 and a residual stenosis ≤30% as measured by coronary angiography after percutaneous coronary intervention (PCI)19. In total, 30 patients with 31 CTO lesions were eligible for interventional revascularisation; 24 CTO revascularisations (77.4%) were successful. OCT was available in 20 CTO lesions (83.3%). The CTO treatment was performed with contemporary techniques such as antegrade wiring, antegrade approach with high penetration wires as well as retrograde dissection and re-entry approaches. As recently suggested, the “antegrade wiring” technique (passing the proximal CTO cap with soft wires, e.g., Fielder FC, Fielder XT or SION wire; ASAHI Intecc, Nagoya, Japan) was the initial strategy in CTOs with a reasonably definable proximal cap, a distal target vessel and a lesion length <20 mm20. If the antegrade wiring failed, high penetration wires (ULTIMATEbros wires [ASAHI Intecc]; PROGRESS 140T or 200T wires [Abbott Vascular, Santa Clara, CA, USA]) were employed accepting a subintimal path and re-entry into the true lumen at a distal point2. As recently proposed, in case of CTO lesions with poor distal targets, ambiguous proximal caps and suitable collaterals, a retrograde approach was applied20. No retrograde true lumen puncture “technique” was used in this registry. For retrograde CTO treatment reverse CART (controlled antegrade and retrograde subintimal tracking) was applied as described elsewhere21. All patients were treated with DES and prescribed lifelong aspirin; in addition, a thienopyridine was prescribed for at least six to 12 months. Clinical follow-up was provided by telephone interview at 12 months after PCI.
OCT IMAGE ACQUISITION AND ANALYSIS
Frequency domain OCT pullbacks were obtained by the C7-XR™ system combined with the C7 Dragonfly™ imaging catheter (St. Jude Medical, St. Paul, MN, USA)22-24. Acquired data were analysed at an offline workstation using the LightLab Imaging software (OCT system software B.0.1; St. Jude Medical). According to previously described methods, struts located at the ostium of coronary artery side branches were denoted as non-apposed side branch struts and therefore excluded from the analysis14,23. Stent and lumen contours were detected semi-automatically, and neointimal thickness, stent coverage and wall apposition were assessed for the entire vessel circumference. A strut was considered suitable for analysis only if it had a well-defined, bright “blooming” and a characteristic shadow perpendicular to the light source23. Quantitative strut level analysis was performed in every third frame (every 0.6 mm) along the entire stented segment. According to previously described methods and criteria, stents were analysed strut by strut and classified into three categories: struts covered by tissue and not interfering with the vessel lumen were defined as “covered struts”; partially or totally uncovered struts but abutting the vessel wall were defined as “uncovered apposed struts”; finally, stent struts not covered and not abutting the vessel wall were defined as “uncovered malapposed struts”23. If neointimal tissue was observed, its average thickness was measured as described elsewhere15. Representative images of the strut categories are shown in Figure 2 and Figure 3. To account for the clustered nature of OCT data, multilevel regression analyses on lesion level, cross-section level and strut level were realised12,25. As suggested by other authors on lesion level, the frequency of lesions with any uncovered struts, lesions with ≥30% uncovered struts and lesions with ≥5% malapposed struts was calculated25,26. On cross-section level, the proportion of cross-sections with any uncovered struts, with ≥30% uncovered struts and with ≥5% malapposed struts was assessed. According to the latest literature, the maximum lengths of segments with uncovered struts as well as the maximum lengths of segments with malapposed struts were calculated. The maximum length of segments with uncovered struts was defined as the number of consecutive cross-sections at 0.6 mm intervals with uncovered struts, while the maximum length of segments with malapposed struts was defined as the number of consecutive cross-sections at 0.6 mm intervals with malapposed struts12.
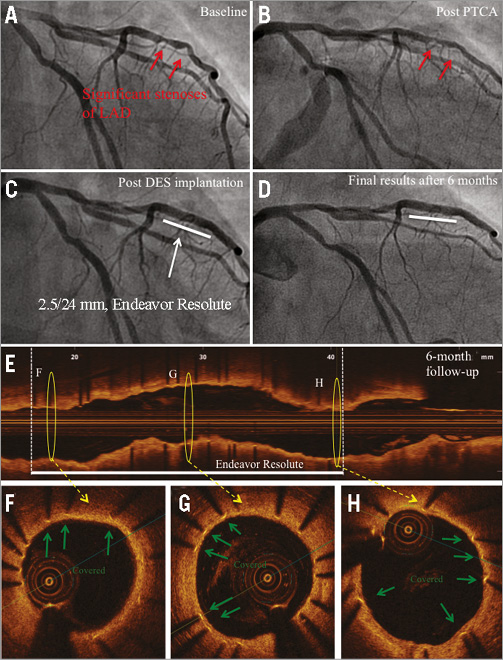
Figure 2. Angiography and OCT of DES implanted into a non-CTO lesion at six-month follow-up. A) Baseline angiography of a patient with newly established unstable angina pectoris: two subsequent significant stenoses of the LAD (red arrows). B) Angiography after PTCA. C) Implantation of a zotarolimus-eluting stent (Endeavor Resolute, 2.5/24 mm; Medtronic). D) Angiography at six-month follow-up. E) Corresponding OCT longitudinal-sectional image. F), G) & H) OCT cross-sectional images of the marked area in E. Covered stent struts (green arrows), DES (white line), presented area in F, G & H (yellow circles).
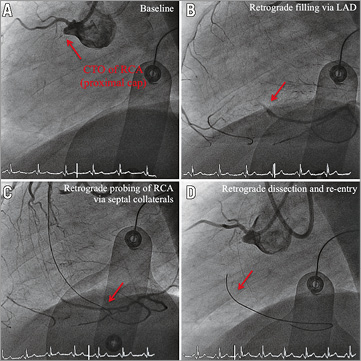
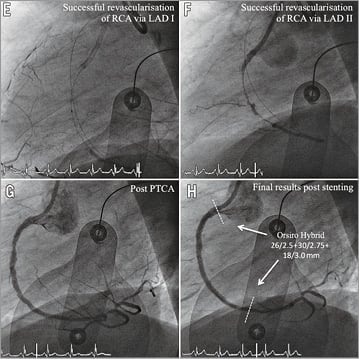
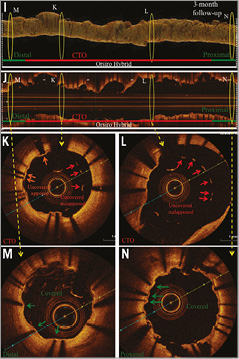
Figure 3. Angiography and OCT of DES implanted after CTO-PCI via retrograde dissection and re-entry at three-month follow-up. Representative angiographic (A-H) and OCT (I-N) images from a patient with a CTO of the RCA. A) CTO of the RCA with proximal cap (red arrow). B) Retrograde filling of distal RCA via septal collaterals (red arrow). C) Retrograde probing of RCA via septal collaterals (red arrow). D) Revascularisation via retrograde dissection and re-entry (red arrow). E) & F) Successful revascularisation via retrograde dissection and re-entry. G) Results post PTCA. H) Results after sirolimus-eluting stent implantation (3 x Orsiro Hybrid; Biotronik). White lines mark the stented area. I) OCT three-dimensional reconstruction. J) OCT longitudinal-sectional image at three-month follow-up. K)-N) OCT cross-sectional images. DES (white lines), CTO area (red lines), 6 mm proximal/distal stent area (green lines), presented area in I & J (yellow circles), covered struts (green arrows), uncovered apposed struts (orange arrows), uncovered malapposed struts (red arrows). Within the CTO area a higher number of uncovered apposed and malapposed stent struts was detected, while within the 6 mm.
Two independent expert observers realised the analysis of OCT data. To determine reproducibility, the OCT measurements of five randomly chosen patients (in total 2,266 analysed struts) were repeated and intra-observer and inter-observer reproducibility were calculated15.
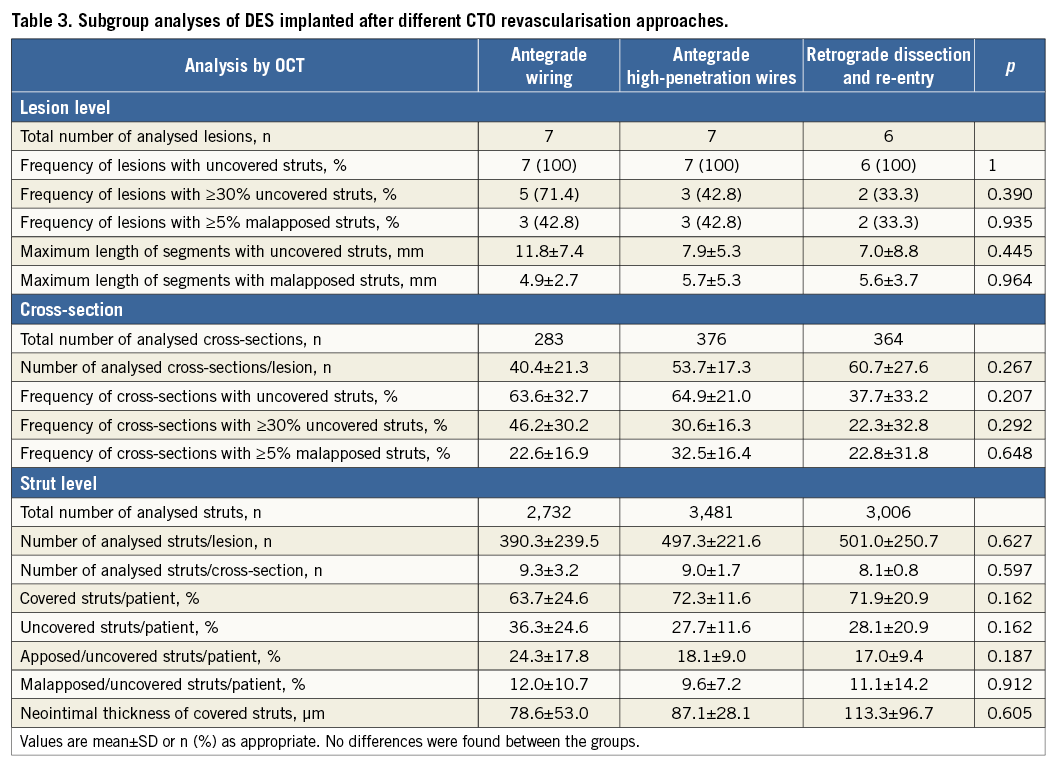
Subgroup analyses were performed concerning CTO revascularisation by antegrade wiring, antegrade high penetration wires as well as retrograde dissection and re-entry approaches.
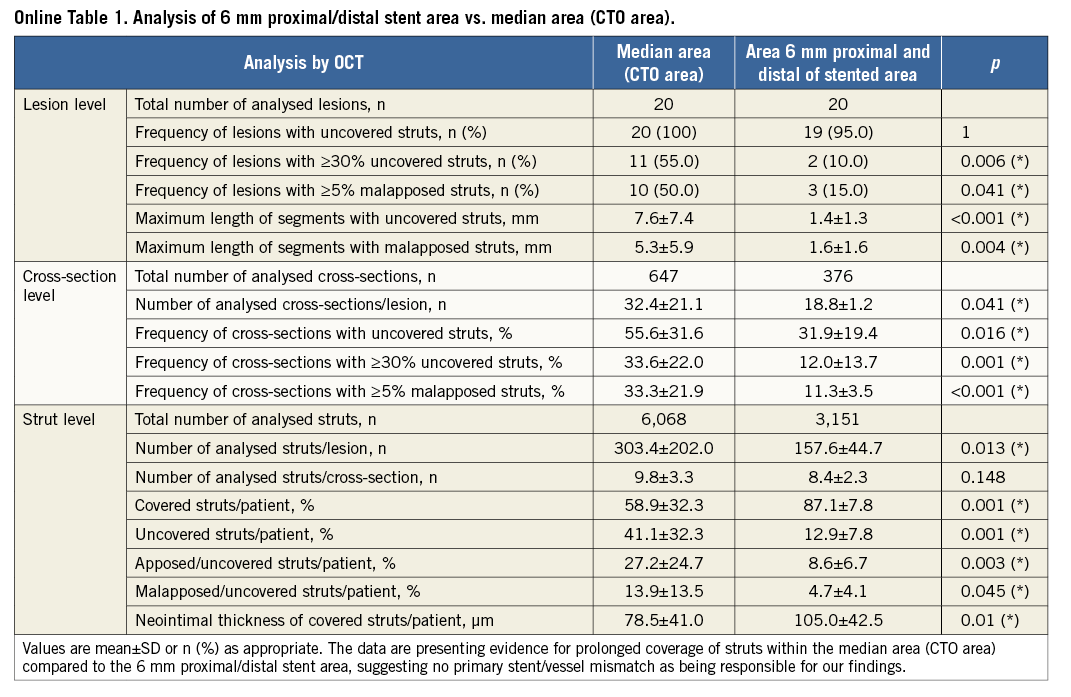
To exclude a primary stent/vessel mismatch being responsible for the findings, a further analysis of stent struts clearly distal and proximal to the former CTO lesion was carried out. We analysed a 6 mm distance (10 cross-sections with 0.6 mm intervals) from the distal and proximal stent edges compared to the area of the former CTO lesion (CTO area) in the CTO group. Taking advantage of the high resolution of OCT, stent edges and accurate distance measurements were used to identify the different areas12.
Spread-out-vessel graphics (Online Figure 1) were created to illustrate the OCT findings by correlating the distance from the distal edge of the stent to the particular strut (x-axis, % of total distance, struts were displayed at every 5%) with the angle where the struts were located in the OCT cross-sectional image (y-axis, with respect to the vessel’s centre of gravity)14.
STATISTICAL ANALYSIS
Due to the clustering nature of OCT data, lesion level, cross-section level and stent strut level analyses were performed within a multilevel analysis, as suggested by other investigators in the field12,25. Our main measure of interest was the relative number of uncovered struts per patient; thus, the percentage of uncovered struts was calculated for each individual patient prior to statistical evaluation. Individual struts were not included in the analysis due to their non-independence. Categorical variables are presented as numbers and frequencies and were compared by the Fisher’s exact test. Continuous variables with normal distribution were compared with the Student’s t-test for independent samples or with the Mann-Whitney U test in the event that normal distribution could not be assumed. For subgroup analysis concerning different CTO revascularisation approaches, an analysis of variance was performed. Intra-observer and inter-observer reproducibility were assessed using the intraclass correlation coefficient. A p-value of <0.05 was considered to be statistically significant. Statistical analysis was performed using GraphPad Prism version 5 (GraphPad Software, Inc., San Diego, CA, USA). All results are reported as values and percentages or mean value±standard deviation (SD).
Results
PATIENT BASELINE CHARACTERISTICS
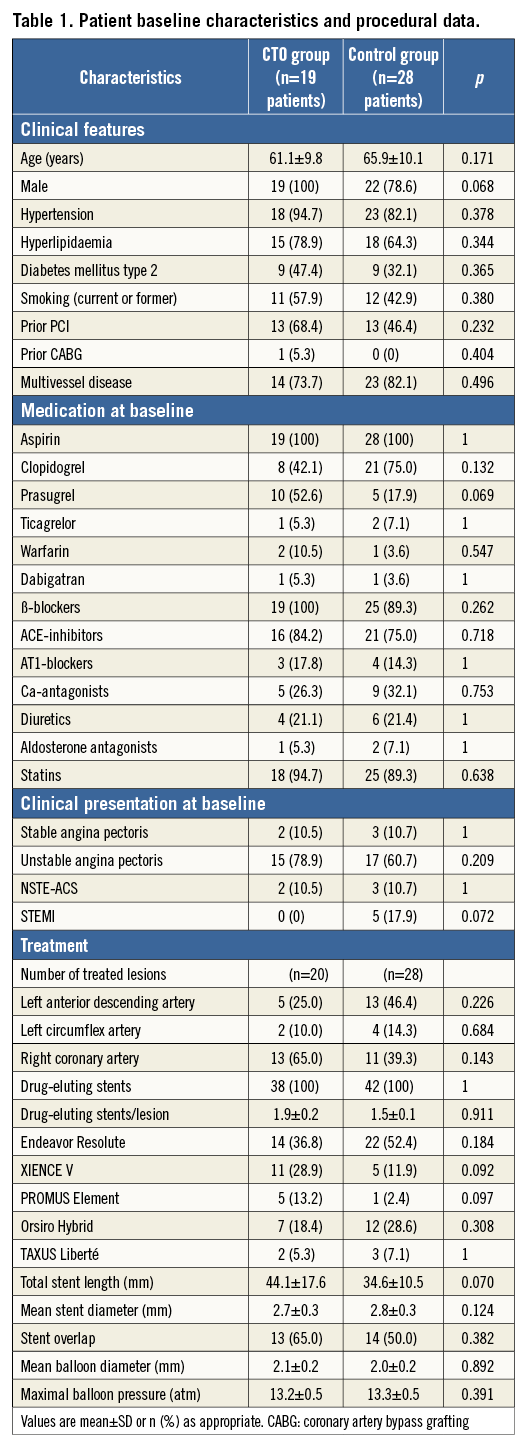
Patient baseline characteristics, lesion and stent features at the time of PCI are reported in Table 1. The two groups were well matched and similar concerning most of the characteristics. Although the CTO group presented a trend for longer total stent length, no statistical difference was found (p=0.070). Concerning the control group, five patients with ST-segment elevation myocardial infarction (STEMI) were included, while in the CTO group no patients with STEMI were examined (p=0.072). Post-PCI coronary angiography showed TIMI 3 flow in all cases.
OCT MEASUREMENTS
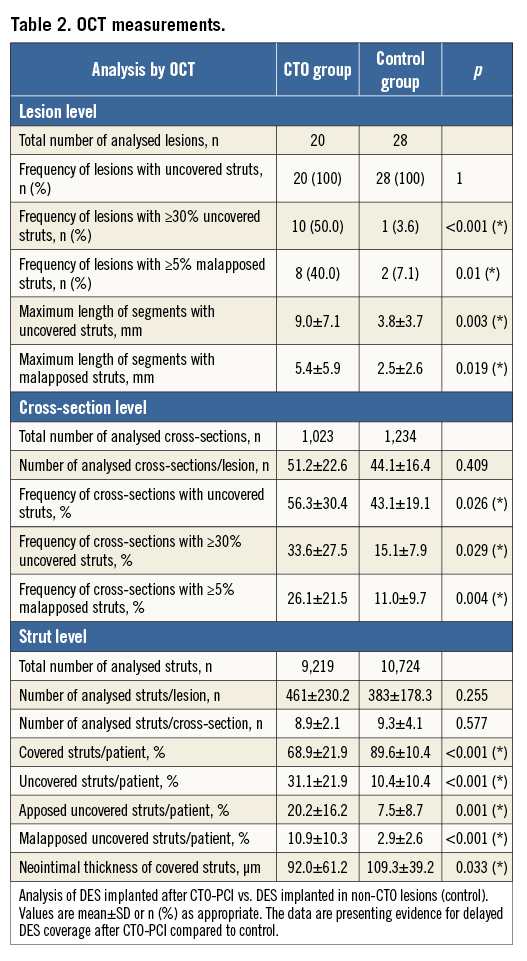
Nineteen patients with 20 CTO lesions presented for angiography including OCT 6.5±2.1 months after PCI. Twenty-eight patients with 28 non-CTO lesions and total stent length >24 mm were suitable for OCT analysis at 4.9±2.2 months (p=0.271). In total, 2,257 cross-sections with 19,943 struts (CTO: n=1,023/n=9,219, control: n=1,234/n=10,724) were analysed. Delayed DES coverage and a higher rate of malapposition were observed on each level of the multilevel analysis concerning the CTO group (Table 2).
The second OCT analysis at 12.0±2.7 months in four patients of the CTO group with 1,889 analysed struts presented evidence of 4.3±6.7% uncovered malapposed and 8.3±3.8% uncovered apposed struts (or 14.9±6.3% uncovered struts and 85.1±6.3% covered struts). Neointimal thickness was measured as 115.0±49.3 μm. A representative figure is provided in the supplements (Online Figure 2). Due to low patient count, no multilevel analysis was performed concerning the second OCT analysis.
The qualitative assessment for covered struts was highly reproducible and comparable to findings of other groups: the intra-observer and inter-observer reproducibility (R2) were 0.89 and 0.91, respectively25.
SUBGROUP ANALYSIS
In total, n=7 lesions were treated with an antegrade wiring technique, while in n=7 lesions high penetration wires were necessary. A retrograde dissection and re-entry approach was utilised in n=6 lesions. No statistical differences were observed (Table 3). Additional figures of revascularisation approaches are provided in the supplements (Online Figure 3, Online Figure 4).
The CTO group analysis of stent struts within the 6 mm proximal/distal stent area, where the stent was located in a previously “healthy”, non-CTO area, revealed strut coverage percentages very similar to the control group, excluding a primary stent/vessel mismatch to account for the observed differences in the former CTO area (Online Table 1).
Clinical follow-up
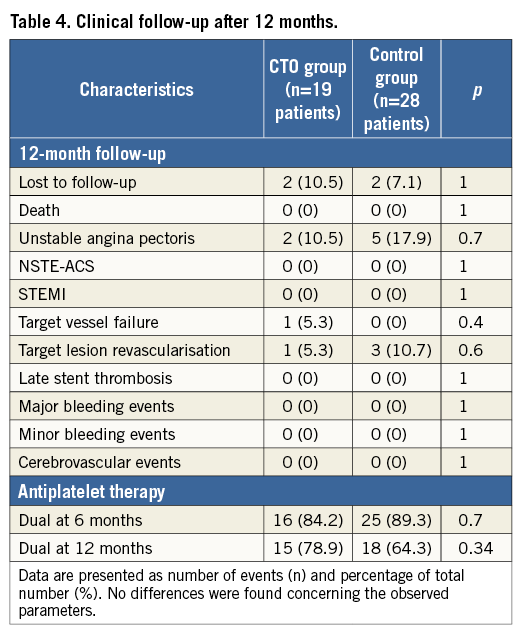
Concerning 12-month follow-up, two patients per group were lost to follow-up. Two CTO group patients were readmitted. The first patient presented with unstable angina pectoris due to target vessel failure (TVF; de novo stenosis) after 12 months. He was treated successfully by PCI and DES implantation. The second patient was readmitted due to unstable angina pectoris with an in-stent restenosis six months after CTO revascularisation and was successfully treated with a drug-coated balloon (target lesion revascularisation [TLR]). Five control-group patients were readmitted due to unstable angina pectoris. Three patients received treatment by drug-coated balloon due to in-stent restenosis (TLR), while two patients were treated with DES due to de novo stenosis of another coronary artery vessel. No acute myocardial infarction or severe bleedings under DAPT were detected, and no further MACE events were found in this registry. The 12-month rates of death, myocardial infarction, TVF and TLR were not significantly different between the groups (Table 4).
Discussion
As part of the ongoing ALSTER-OCT registry, we present OCT data regarding stent healing and clinical follow-up after PCI for CTO lesions. The data were compared to OCT data following DES implantation of non-CTO lesions. The following were the main findings. 1) Tissue strut coverage of DES implanted following successful CTO revascularisation occurred with a significant delay as compared to control. 2) Subgroup analysis concerning different CTO revascularisation approaches showed no significant differences in strut coverage, apposition and neointimal thickness. 3) In CTO lesions, more than 30% of struts after >6 months and almost 15% of struts after 12 months were found to be uncovered. Compared to the findings of other groups with 2.3 to 8.1% (six months) and approximately 5% (12 months) of uncovered struts in non-CTO lesions, this fact may lead to reconsideration of the duration of DAPT in these patients14,18,27.
Histopathological findings from human autopsies have demonstrated delayed stent coverage and malapposition to be risk factors for ST after DES implantation10,28. Recently, Guagliumi and colleagues presented evidence for a correlation of late ST and uncovered stent struts evaluated by OCT12. To our knowledge, no valid in vivo information on DES coverage after CTO revascularisation was previously available. Our data may explain the link between uncovered struts and the increased risk of ST after interventional CTO treatment8,9.
Chronic total occlusions develop from a total luminal obstruction of coronary arteries by a thrombus, with subsequent organisation by inflammatory cells followed by infiltrating smooth muscle cells and generation of proteoglycan matrix as well as calcification29,30. Successful revascularisation of such lesions often requires a subintimal wire position and distal re-entry with disruption of the vessel integrity. Furthermore, penetration of a necrotic core, overlapping stent placement and excessive stent length represent additional barriers to stent coverage12. We suggest the hypoxic environment within the CTO area as well as the absorption of mural thrombus accompanied by suppressed neointimal tissue to be possible reasons for the delayed coverage observed in our registry29. This suggestion also explains our findings of reduced neointimal thickness in CTO lesions. While the control group data were similar to the findings of other trials, the CTO group presented a significantly lower neointimal thickness14,15.
CTO REVASCULARISATION APPROACHES
Using high-penetration wires for the antegrade approach as well as retrograde dissection and re-entry techniques in CTO revascularisation frequently accepts a subintimal path to the true lumen. Some parts of the implanted DES are therefore located within the subintimal layer of the vessel wall2,20. Hong and colleagues found that subintimal passage of the guidewire and stenting of the false lumen caused stent malapposition31. By performing the antegrade wiring technique it is believed that re-entry to the true lumen occurs through microchannels without disruption of vessel integrity and may result in a better stent healing5,6,20. However, no significant differences concerning the observed approaches were found, suggesting that antegrade wiring and dissection and re-entry techniques are equal concerning DES coverage and apposition. We suggest that the “in-CTO environment” within the former vessel, with thrombus organisation, inflammatory and smooth muscle cells surrounded by proteoglycan matrix as well as calcification, are similar to the subintimal environment, leading to delayed DES coverage in CTO lesions independently from the applied approach.
CLINICAL IMPLICATIONS
Both PCI of long non-CTO lesions employing a stent length of >24 mm as well as PCI in CTO lesions were found to be safe: no statistical differences in 12-month clinical follow-up concerning MACE events, TVF or TLR were found. The time course of complete healing with DES in humans is unknown; therefore, the optimal duration of DAPT is controversial6. Currently, the incidence of acute and subacute ST in the case of BMS and DES is below 1% per year. Within 12 months after PCI with DES, the incidence of life-threatening and fatal bleedings increases with DAPT at 0.2% and 0.1%, respectively10. In pathological studies, the presence of ≥30% uncovered struts per cross-section was identified as a predictive factor for ST32. Using OCT, this observation was recently confirmed in vivo12. Our data found a significantly higher rate concerning the presence of ≥30% uncovered struts per cross-section in case of PCI in former CTO lesions, suggesting that these patients are at higher risk for ST. Furthermore, the data suggest that OCT analyses may find uncovered and malapposed stent struts even beyond 12 months after CTO revascularisation. We suggest the regular use of OCT in follow-up examinations of patients following successful PCI of CTO lesions. Further studies are required to test the hypothesis that an individualised duration of DAPT is required after CTO treatment.
Limitations
No baseline OCT was performed in this registry. Primary vessel/stent mismatch, as a reason for later stent malapposition, may therefore be an issue. However, analysis of stent tissue coverage within the 6 mm proximal/distal stent area did not support this consideration. Concerning the time point of OCT, the control group was studied circa one to two months earlier. Although the difference calculated was not significant, this trend may imply that the actual differences between the two populations could be even larger. Additionally, the presence of patients with STEMI in the control group may be associated with delayed stent coverage, again minimising the difference between the groups. Another potential limitation is the fact that different DES types were analysed. The last limitation of the present registry is the limited number of patients especially for subgroup analyses. However, our report is the first attempt to perform follow-up examinations with OCT after CTO revascularisation compared to non-CTO PCI. Larger, multi-centre registries and/or studies are required to confirm our results and draw final conclusions.
| Impact on daily practice We found a significantly higher rate of uncovered and malapposed stent struts in DES implanted after interventional revascularisation of CTO lesions, suggesting these patients to be at higher risk for ST compared to the control group. Furthermore, the OCT analyses found uncovered and malapposed stent struts even beyond 12-month follow-up. While antegrade wiring as well as dissection and re-entry techniques are leading to similar coverage and apposition, the healing of DES implanted into CTO lesions seems to be independent of the applied revascularisation approach. We suggest regular use of OCT-based follow-up examinations in patients after successful PCI of CTO lesions to assess the duration of DAPT and improve the patient’s outcome. |
Conflict of interest statement
M. Bergmann received travel grants, research grants and speaker honoraria from Medtronic Inc. and Biotronik AG as well as Boston Scientific. C.H. Heeger received travel grants from St. Jude Medical and Biotronik AG. K.H. Kuck received speaker honoraria from Medtronic Inc. The other authors have no conflicts of interest to declare.
Supplàementary data
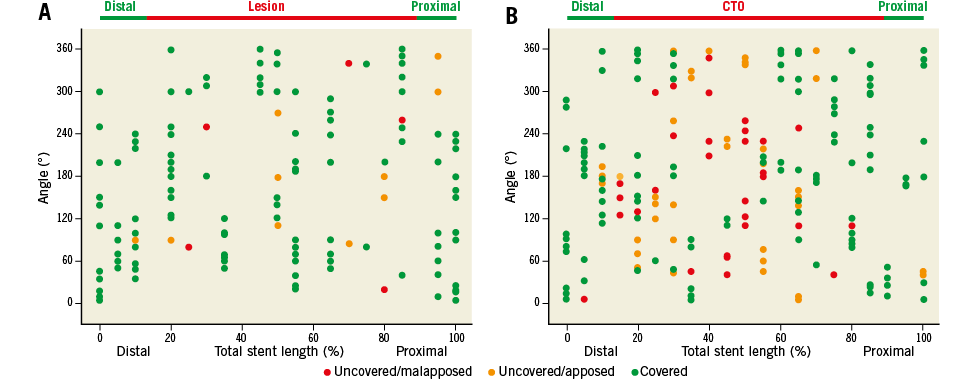
Online Figure 1. Spread-out-vessel graphics. Representative spread-out-vessel graphics of DES implanted into non-CTO lesions (A, control group) and DES implanted after CTO-PCI (B, CTO) at six-month follow-up as analysed by OCT. Uncovered malapposed (red dots), uncovered apposed (yellow dots) and covered struts (green dots) are presented along the entire stented vessel. The location of the particular strut is presented along the stent by angle (y-axis), and by the distance from the distal edge of the stent to the strut (x-axis, % of total stent length, every 5%). These graphics demonstrate the significantly higher frequency of uncovered apposed and malapposed struts in DES implanted after CTO revascularisation compared to non-CTO lesions.
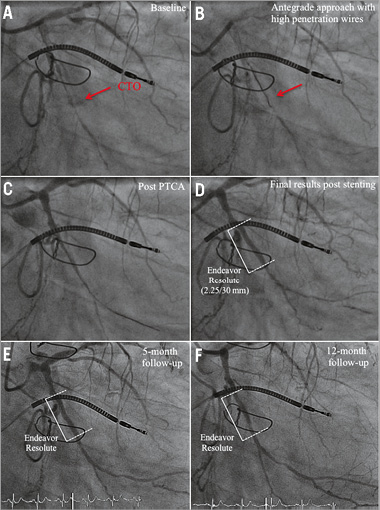
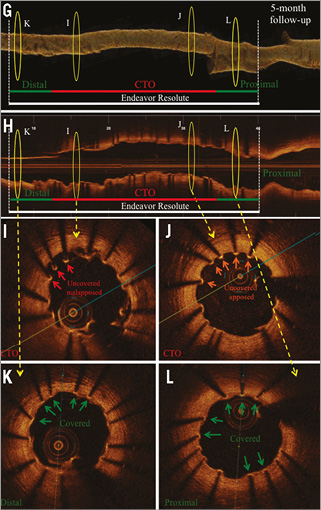
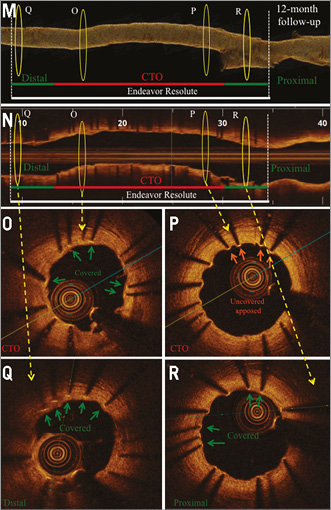
Online Figure 2. OCT analysis at five-month (first OCT) and nine-month (second OCT) follow-up after CTO-PCI via the antegrade approach with high-penetration wires. Representative angiographic (A-F) and OCT images (G-L) from a patient with a CTO of the RCX (M1), after CTO revascularisation and implantation of a zotarolimus-eluting stent (Endeavor Resolute 2.25/30 mm; Medtronic, Minneapolis, MN, USA). A) CTO of the RCX (red arrow) with retrograde collateralisation via the LAD. B) Revascularisation of CTO by the antegrade approach using high-penetration wires (red arrow). C) Results post PTCA. D) Results after successful DES implantation. E) Results at five-month follow-up. F) Results at 12-month follow-up. OCT three-dimensional reconstruction at five-month (G) and 12-month (M) follow-up, and corresponding OCT longitudinal-sectional images (H & N). I)-L) OCT cross-sectional images at five-month follow-up. At this time point a high number of uncovered apposed and malapposed struts was detected. O)-R) OCT cross-sectional images at 12-month follow-up. At this time point the number of covered struts increased compared to five-month follow-up. Some struts are still uncovered. Green arrows (covered stent struts), orange arrows (uncovered apposed) and red arrows (uncovered malapposed) are shown in images I-K and O-R. DES (white lines), CTO area (red lines), 6 mm proximal/distal stent area (green lines), presented area in G, H and M, N (yellow circles).
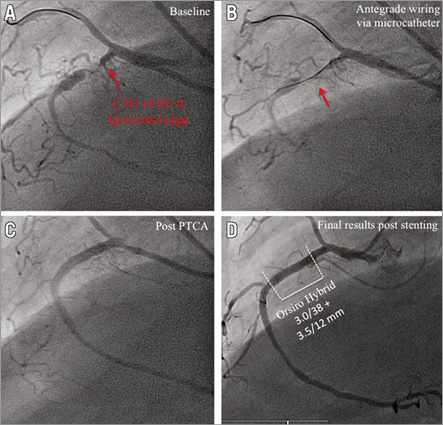
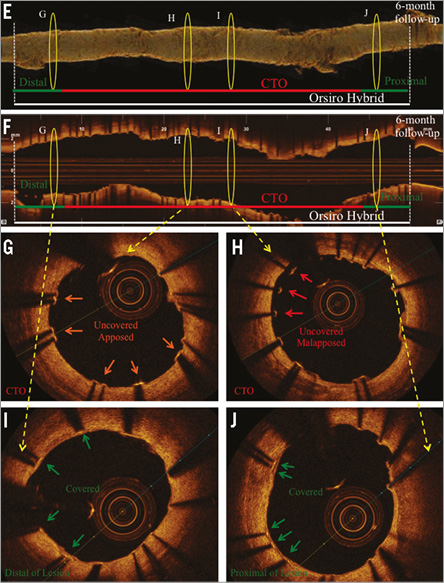
Online Figure 3. Angiography and OCT analysis of DES implanted after CTO revascularisation via antegrade wiring, six months after implantation. Representative angiographic (A-D) and OCT images (E-J) from a patient with a CTO of the RCA six months after revascularisation and implantation of two sirolimus-eluting stents (Orsiro Hybrid 3.0/38, 3.5/12 mm; Biotronik AG, Bülach, Switzerland). A) CTO of the RCA with proximal cap (red arrow) and retrograde collateralisation. B) Revascularisation of CTO by antegrade wiring (red arrow). C) Results after PTCA. D) Results after successful DES implantation. E) OCT three-dimensional reconstruction. F) OCT longitudinal-sectional image six months after CTO-PCI. G)-J) OCT cross-sectional images. DES (white lines), CTO area (red lines), 6 mm proximal/distal stent area (green lines), presented area in E & F (yellow circles). Green arrows (covered stent struts), orange arrows (uncovered apposed) and red arrows (uncovered malapposed) are shown in images G-J.
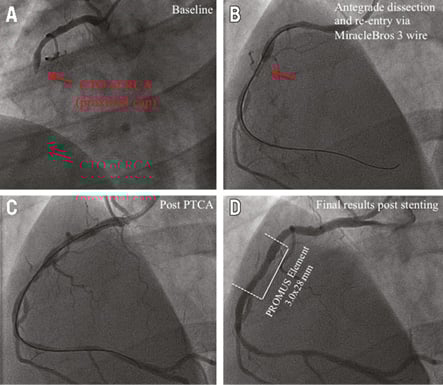
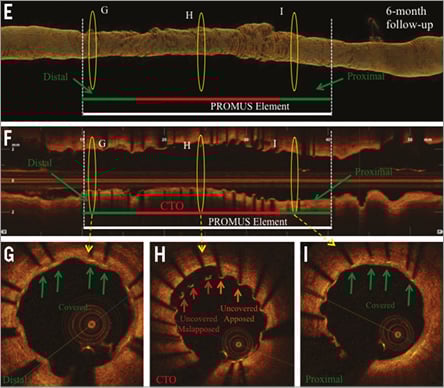
Online Figure 4. Angiography and OCT analysis of DES at 6-month follow-up after CTO revascularisation via the antegrade approach with high-penetration wires. Corresponding angiographic (A-D) and OCT (E-I) images of a patient with a CTO of the RCA, CTO revascularisation and implantation of an everolimus-eluting stent (PROMUS Element 3.0/28 mm; Boston Scientific, Natick, MA, USA). A) CTO of RCA with proximal cap (red arrow). B) Revascularisation of CTO via the antegrade approach with high-penetration wires (MiracleBros 3 wire [red arrow]; ASAHI Intecc). C) Results post PTCA. D) Results after successful DES implantation. E) Three-dimensional reconstruction. F) OCT longitudinal-sectional image. G), H) & I) OCT cross-sectional images. G) Area 6 mm of the distal stent edge with covered stent struts (green arrows). H) CTO area with uncovered malapposed (red arrows) and uncovered apposed (orange arrows) stent struts. I) Area 6 mm of the proximal stent edge with covered stent struts (green arrows). DES (white lines), CTO area (red lines), 6 mm proximal/distal stent area (green lines), presented area in G, H & I (yellow circles).