
Abstract
Aims: The aim of this study is to present a contrast media (CM) protocol for the dynamic visualisation of the tricuspid valve (TV) and tricuspid annulus (TA) with CT.
Methods and results: Fifteen patients with no cardiac abnormalities (controls), 15 patients with functional tricuspid regurgitation (FTR) <3+, and 13 patients with FTR ≥3+ underwent a dedicated cardiac CT protocol. Using advanced visualisation, segmentation and analysis software, the annular area, entire annular circumference, its three parts, and annular diameters were measured by two independent, blinded readers. The homogeneity of attenuation in the right heart was 63 HU in the RA and 46 HU in the RV, showing a significant negative correlation with the degree of FTR (r=–0.61, p<0.001). The annular area, entire annulus and diameters were larger in patients with FTR compared to controls (p<0.05). There were significant differences between systole and diastole in controls and patients with FTR <3+ and FTR ≥3+ for the annular area and annulus (p<0.05). The annulus was significantly smaller (all, p<0.05) in 2D compared to 3D (systematic underestimation: 1.0-1.3 mm), the difference decreasing with increasing FTR grades.
Conclusions: This study introduces an individually tailored CM protocol for optimised visualisation of the TV with CT. We found dynamic changes of the geometry within the cardiac cycle and between 3D and 2D measurements, the latter systematically underestimating the true size of the TA. Use of this CM protocol enables accurate imaging of the dynamic geometry of the TA prior to transcatheter valve repair.
Introduction
Functional tricuspid regurgitation (FTR) is characterised by a coaptation defect of the valvular leaflets during systole due to global dilatation of the right ventricle (RV) and tricuspid annulus (TA), while the tricuspid apparatus itself remains structurally normal1.
Surgical tricuspid valve repair in patients with FTR secondary to left heart disease has not been routinely performed in the past; however, recent evidence has indicated a benefit for a more aggressive surgical treatment approach2. Treatment options for FTR are primarily surgical, but recent developments have shown that percutaneous procedures are an attractive alternative to open surgery, especially in high surgical risk patients3. Different transcatheter tricuspid annuloplasty devices are currently under evaluation, among them the Mitralign (Mitralign, Inc., Tewksbury, MA, USA) and TriCinch™ device (4Tech Cardio, Galway, Ireland)4. Initially developed for the mitral valve, the Mitralign system can be used for a transcatheter bicuspidisation of the tricuspid valve (TV) via a transvenous jugular approach5, whereas the TriCinch is a catheter-based device which aims at a reduction of FTR by reducing the septolateral annular diameter6.
Detailed knowledge of the anatomy of the TV is fundamental, especially prior to minimally invasive, percutaneous therapy7,8. Functional assessment of the TV is routinely performed with two-dimensional (2D) transthoracic echocardiography (TTE) or transoesophageal echocardiography (TEE). However, 2D echocardiography may fail to provide complete anatomical information of the TV because of its anterior position in the chest and complex geometry9-11. Real-time 3D-TTE yields more detailed anatomical information, but image quality remains dependent on the acoustic window, and 3D-TTE is hampered by relatively low temporal resolution9,12,13. Magnetic resonance (MR) imaging allows visualisation of the dynamic TV anatomy throughout the cardiac cycle14; however, MR has inherent limitations. Computed tomography (CT) can visualise the TV; however, a non-adjusted contrast media injection protocol results in reduced image quality of the right heart15,16.
The purpose of this study was, first, to introduce a contrast media protocol allowing an optimised visualisation of the TV apparatus in CT angiography and, second, to compare with CT the dimensions and geometry of the TA in healthy subjects and in patients with various grades of FTR in systole and diastole in both 3D and 2D.
Materials and methods
Between January 2012 and December 2013, 15 patients with FTR <3+ (FTR=1+: n=9, FTR=2+: n=6) (10 females, five males; 64±15 years; range: 40-85 years) and 13 patients with FTR ≥3+ (FTR=3+: n=7; FTR=4+: n=6) (six females, seven males; 60±19 years, range: 22-88 years) as determined by TTE who underwent coronary CT angiography at two institutions were included in this study. The aetiology for FTR was severe mitral regurgitation (n=15), severe aortic regurgitation (n=6), ventricular septal defect (n=2), and severe end-stage heart failure prior to heart transplantation with a left ventricular ejection fraction (LVEF) <35% (n=5). CT examinations were clinically indicated in all patients at both centres; all CT data were evaluated in one centre. Demographic patient data are provided in Table 1.
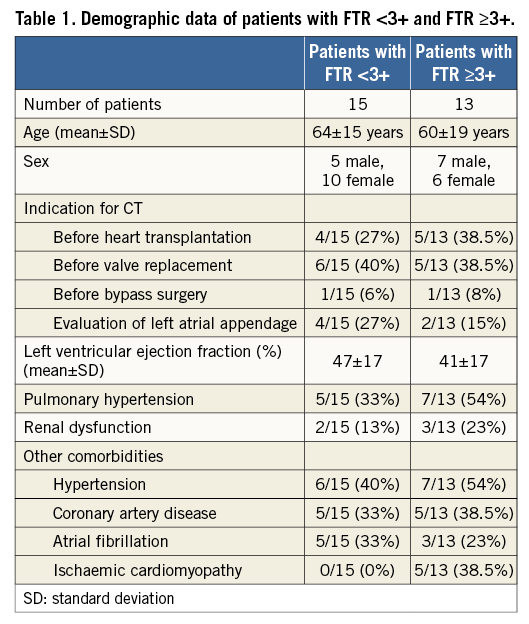
In addition, 15 patients who underwent coronary CT angiography in one of the two institutions were included as the control group (11 females, four males; 57±15 years, range: 21-74 years). Of these 15 patients, six (40%) underwent TTE which showed no abnormalities of the TV. The indication for CT in the control group was exclusion of coronary artery disease in patients with atypical chest pain at a low pre-test probability. None of the patients in the control group had a history of structural heart disease, prior cardiac surgery or intervention, and none had coronary plaques or stenoses on coronary CT angiography. Patients from this group are hereafter referred to as “controls”. There were no significant differences between controls, patients with FTR <3+ and patients with FTR ≥3+ regarding gender and age (both, p>0.05). All patients and controls were in sinus rhythm during CT. This retrospective study was performed after institutional review board approval was obtained. Written informed consent requirement was waived by the local ethics committee.
CT DATA ACQUISITION AND IMAGE RECONSTRUCTION
CT examinations in all 43 patients were performed on a 128-slice (n=19, SOMATOM® Definition Flash; Siemens Healthcare, Forchheim, Germany) or a 192-slice dual-source CT scanner (n=24, SOMATOM® Force; Siemens Healthcare) at the two institutions. The scan range covered the entire heart in a cranio-caudal direction. No β-blockers were given prior to CT, as is routine in our institutions since starting to use dual-source CT.
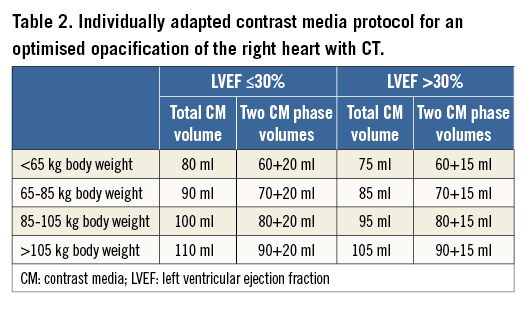
The contrast media protocol was developed and tested in coronary CT angiography examinations in previous patients not included in the current study. This protocol had the aim of improving the contrast in the right heart, while at the same time keeping the image quality of the coronary arteries high and diagnostic. It represents an individually tailored protocol taking into account body weight and LVEF. The triphasic iodinated contrast media (370 mg/ml iodine concentration, iopromide, Ultravist® 370; Bayer Schering Pharma, Berlin, Germany) protocol was designed as follows. The total volume was split into 80% at a flow rate of 5 ml/s and 20% at 3.5 ml/s followed by a saline chaser of 30 ml at 3.5 ml/s. The total contrast media volume ranged between 80 and 110 ml and was calculated depending on the patient’s body weight and scan time of 5-6 sec. Contrast agent application was controlled by bolus tracking in the ascending aorta (attenuation threshold 120 Hounsfield units [HU] at 120 kVp). Details of the contrast media protocol are provided in Table 2. As compared to our standard protocol in patients undergoing coronary CT angiography without TR, the total contrast volume is 10-20 ml higher with this tailored protocol.
CT data acquisition was performed using standard parameters17 in a spiral data acquisition mode synchronised to the electrocardiogram (ECG) in a retrospective mode using ECG pulsing, as typically performed when analyses of the cardiac valves in various phases are required. The average effective radiation dose of the protocol was 9±4 mSv.
CT DATA ANALYSIS
Using the dedicated contrast media protocol described above, images of the coronary arteries were of diagnostic quality in all patients and controls. Results from coronary CT angiography are not further reported in this study.
For determining the quality of right heart opacification, one reader measured the attenuation (in Hounsfield units [HU]) and standard deviation of attenuation in the right atrium (RA) and RV using regions of interest (ROI) in end-systole and mid-diastole. Then, the CT data of all patients were transferred for further post-processing and analysis to a computer equipped with an advanced visualisation, segmentation and image analysis software (3mensio Structural Heart 6.0; Pie Medical Imaging, Maastricht, The Netherlands). Since there is currently no dedicated segmentation tool for the tricuspid valve, we adapted and used the segmentation tool for the mitral valve. In order to do so, we used the two movable seed points for the three commissures of the tricuspid valve.
Using the software, the entire TA circumference was measured by two blinded and independent readers (with two and four years experience in cardiovascular radiology, respectively) in end-systole at 38±6% of the RR interval (median phase 37%) and in mid-diastole at 77±7% of the RR interval (median phase 75%). These two phases have been previously recommended for the geometric analysis of the TV with CT and echocardiography18,19. After manually placing 16 seed points along the TA (in the long-axis reformation) in each patient, the entire circumference of the TA in 3D and in 2D, and the area of the TA were automatically determined (Figure 1). In addition, the circumferences of the anterior, posterior and septal parts of the annulus (subdivided by the commissures) and the septolateral and anteroposterior diameters were measured.
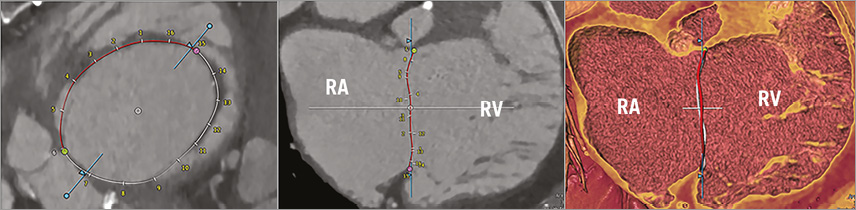
Figure 1. Screenshot of the image analysis software tool illustrating the anatomic segmentation and definition of the tricuspid annulus in 2D and 3D in a patient with FTR ≥3+. Red and white ring indicates the segmented tricuspid annulus; intersections indicate the manually set seed points along the annular circumference. The pink and green dots define the commissures of the anterior leaflet. The blue line represents the long-axis plane of the RV. RA: right atrium; RV: right ventricle
DEFINITION OF MEASUREMENTS
Anatomic definitions of the TV apparatus were used according to Saremi et al16, and the following measurements were made in each data set in both phases:
– Area: the annular area calculated when the annulus is projected to a plane perpendicular through the mathematical centre of the tricuspid annulus.
– Anteroposterior (AP) diameter: the maximal diameter from the septal-posterior commissure to the anterior leaflet.
– Septolateral (SL) diameter: the maximal diameter in the septal-lateral direction.
– Anterior/posterior/septal circumferences 3D: the length of the anterior/posterior/septal tricuspid annular circumferences, subdivided by the commissures, in 3D.
– Anterior/posterior/septal circumferences 2D: the length of the anterior/posterior/septal tricuspid annular circumferences, subdivided by the commissures, in 3D projected to a 2D plane perpendicular to the mathematical centre.
– Entire TA circumference 3D: the length of the entire annular circumference in 3D.
– Entire TA circumference 2D: the length of the entire annular circumference in 3D projected to a 2D plane perpendicular to the mathematical centre.
STATISTICAL ANALYSIS
Normality was tested using the Shapiro-Wilk test. To determine the inter-observer agreement between the two readers, the intraclass correlation coefficient (ICC) was calculated and Bland-Altman plots were performed. According to Landis and Koch, ICC values of 0.61-0.80 were interpreted as substantial and 0.81-1.00 as excellent agreement20. Fisher’s exact test was used to compare gender between groups. One-way ANOVA analyses were performed to test for differences in age, annular area, entire annular circumference, anterior/posterior/septal circumference and anteroposterior and septolateral diameters in both 2D and 3D. Comparison between 2D and 3D measurements of the annular circumference and comparison between end-systolic and mid-diastolic annular area and circumference were tested using the paired t-test. Bland-Altman plots were performed to determine systematic errors between 2D and 3D measurements. Spearman rank order correlation was used to test for associations of differences between 3D and 2D measurements and grades of FTR, and to evaluate correlations between grades of FTR and the homogeneity of attenuation in the right heart. Data were analysed using commercially available software (SPSS Statistics for Windows, Version 22.0; IBM Corp., Armonk, NY, USA). A p-value <0.5 was considered statistically significant.
Results
OPACIFICATION OF THE RA AND RV
In all patients and controls, the average CT attenuation in the RA was 353±130 HU; the average attenuation in the RV was 391±147 HU, with no significant differences between controls and patients with FTR (RA: p=0.4; RV: p=0.1). The average homogeneity of attenuation in all patients and controls was 63 HU in the RA and 46 HU in the RV. We found a significant negative correlation between the homogeneity of attenuation and the degree of FTR (r=–0.61, p<0.001) (Figure 2).
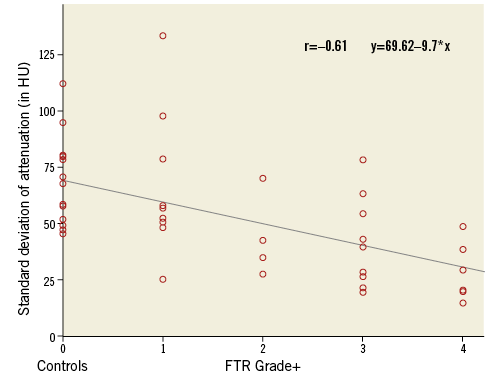
Figure 2. Correlation between the mean standard deviation of attenuation in the RA and the RV (in HU) in controls and patients with FTR. Note the increasing homogeneity of attenuation with higher FTR grades.
INTER-READER AGREEMENT
The inter-reader agreement between readers was high for all measurements in both phases (ICC=0.995-0.999). Bland-Altman plots revealed small errors between readers in end-systole (mean difference: –0.2 mm) and mid-diastole (mean difference: –0.1 mm) (Figure 3).
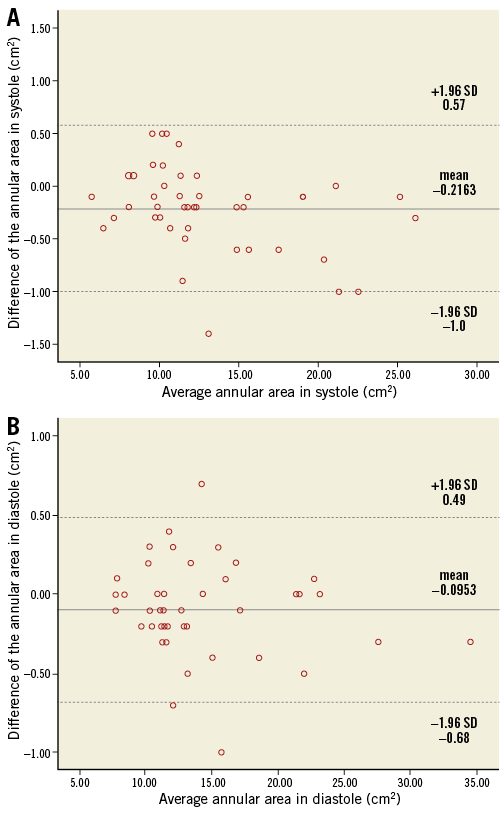
Figure 3. Bland-Altman analysis showing the inter-observer agreement of the annular circumference between readers. A) End-systole. B) Mid-diastole.
MEASUREMENTS OF THE TRICUSPID VALVE
The annular area, entire annular circumference and septolateral/anteroposterior diameters were larger in patients with FTR than in controls, with significant differences between controls and patients with FTR ≥3+ for the annular area (p<0.001), annulus in 3D (p<0.001) and 2D (p<0.001), and for both diameters (septolateral: p<0.001; anteroposterior: p=0.01). We found significant differences between controls and patients with FTR ≥3+ for all three annular parts in both 3D and 2D (all, p≤0.004).
There were significant differences between patients with FTR <3+ and patients with FTR ≥3+ for the annular area (p=0.05) and the septal part of the annular circumference in 2D (p=0.029). There were also significant differences between controls and patients with FTR <3+ for the posterior annular part in 3D (p=0.047) and 2D (p=0.026).
COMPARISON OF END-SYSTOLE VERSUS MID-DIASTOLE
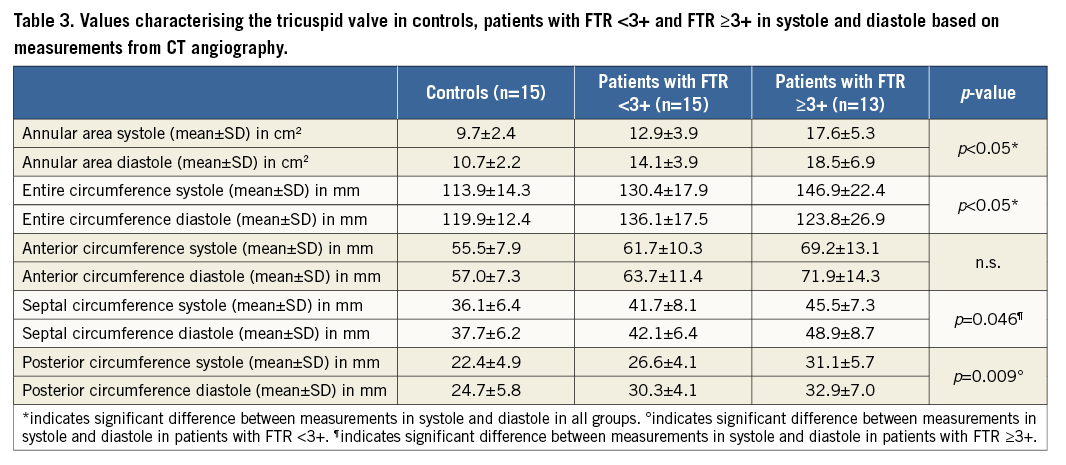
There were significant differences in controls, patients with FTR <3+ and patients with FTR ≥3+ for the annular area (all, p<0.05) and annulus (all, p<0.05) between end-systole and mid-diastole. Reduction of the annular area in systole was 9.8% in controls, 9.8% in patients with FTR <3+ and 11.1% in patients with FTR ≥3+. Reduction of the entire annulus in systole was 5.2% in controls, 4.4% in patients with FTR <3+ and 4.8% in patients with FTR ≥3+ (Figure 4). We found significant differences in patients with FTR <3+ for the posterior annular circumference (p=0.009; 13.8% reduction in systole) and in patients with FTR ≥3+ for the septal annular circumference (p=0.046; 7.4% reduction in systole) (Table 3).
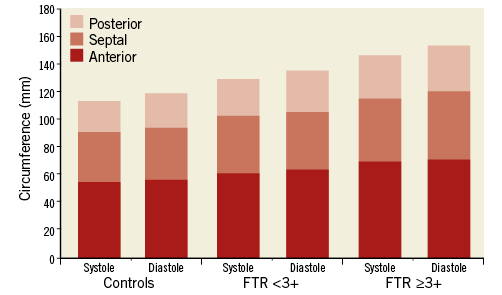
Figure 4. Measurements of the dynamic changes of the anterior, posterior and septal annular circumference between end-systole and mid-diastole in controls, in patients with FTR <3+ and FTR ≥3+.
COMPARISON OF 3D AND 2D MEASUREMENTS
The anterior, posterior, septal and the entire annular measurements were significantly different (all, p<0.05) between 3D and 2D (Table 4). Systematic errors with underestimation of the entire annulus for 2D measurements were found: 1.3±0.7 mm in controls, 1.2±0.6 mm in patients with FTR <3+ and 1.0±0.7 mm in patients with FTR ≥3+ (Figure 5). The extent of systematic underestimation decreased with progressively increasing grades of FTR; however, this did not reach statistical significance (p=0.26, Spearman’s rho: –0.17) (Figure 6).
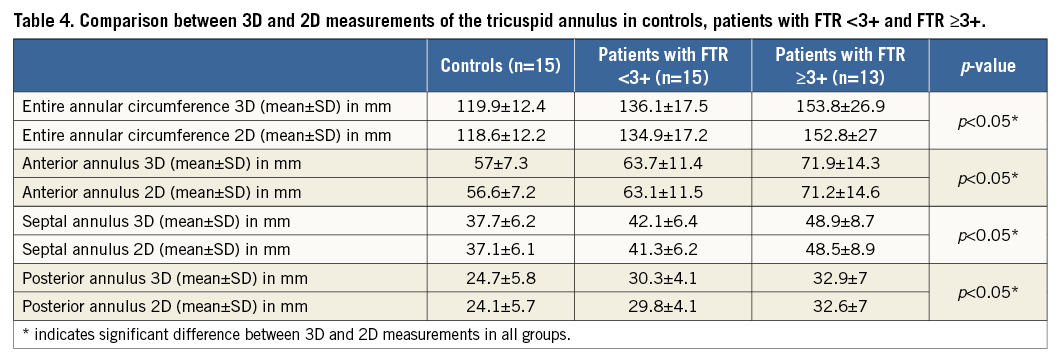
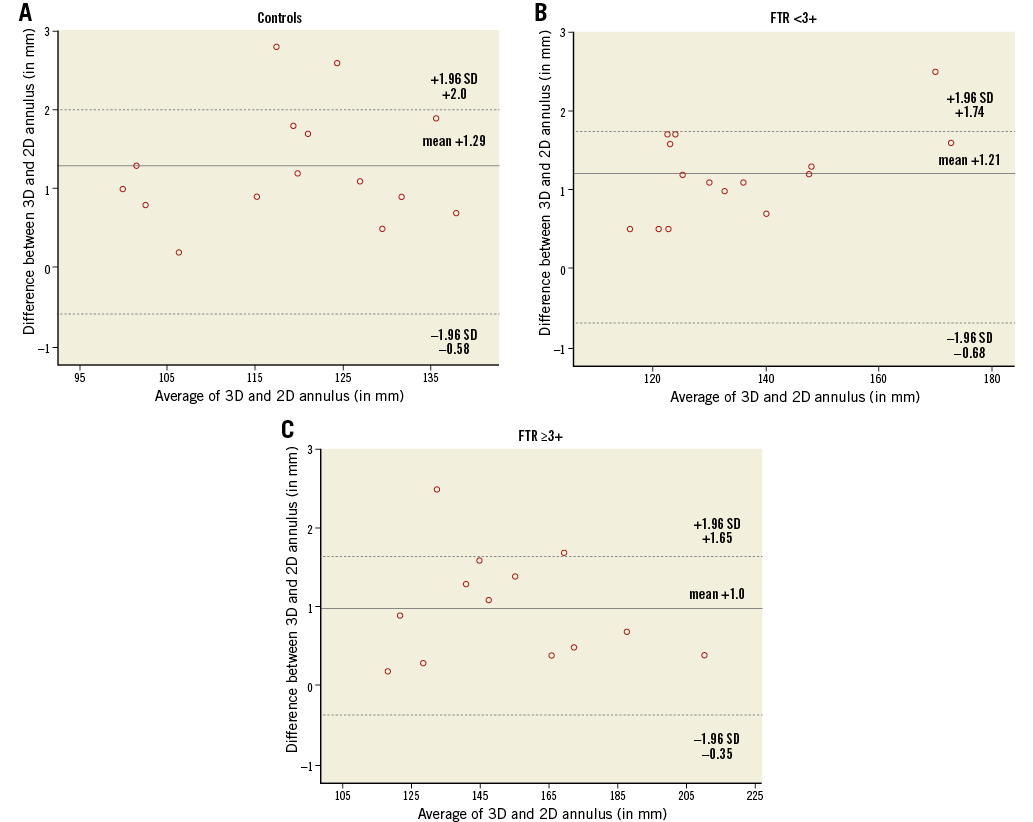
Figure 5. Bland-Altman analysis demonstrating the agreement between 3D and 2D measurements of the entire annular circumference. A) Controls. B) Patients with FTR <3+. C) Patients with FTR ≥3+. The mean differences between 3D and 2D measurements (solid line) and limits of agreement (dashed lines) are shown.
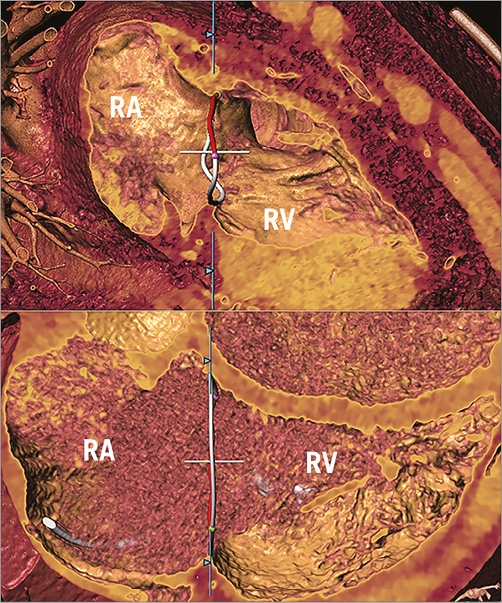
Figure 6. 3D measurements of the TA. Measurements in a patient from the control group (upper panel) and in a patient with FTR ≥3+ (lower panel). Note flattening of the TA at higher degrees of FTR. RA: right atrium; RV: right ventricle
Discussion
Our study adds to the literature a dedicated individually tailored contrast media protocol for CT of the TV. While optimised contrast media protocols for visualisation of the left heart have been available for coronary CT angiography for several years, image quality of the right heart is usually insufficient for demonstrating details of the TV apparatus. Kerl et al were able to suppress streak artefacts and provided sufficient attenuation for visualisation of right heart structures by injecting 50-75 ml of undiluted contrast media at a flow rate of 5.0 mL/s, followed by 50 ml at a 70:30% saline to contrast mixture in the second phase, again followed by 30 ml of pure saline21. We further elaborated on this protocol through individual tailoring of the contrast volume to the body weight and LVEF of each patient, i.e., first, 80-90% of the contrast media at a flow rate of 5.0 mL/s, followed by 10-20% of the contrast media diluted with 80-90% saline, followed by 30 ml saline at the same flow rate. By increasing the contrast media volume in patients with a higher body weight and in those with a normal LVEF, we were able to achieve a homogeneous opacification of the right heart. The homogeneity of opacification increased with higher FTR grades, which indicates that increased regurgitation of contrast from the RV together with less dilution from non-enhanced blood leads to more homogenous contrast in the right heart. This protocol has the disadvantage, however, that it comes at the expense of an 10-20 ml higher contrast volume delivered to the patients compared to a standard coronary CT angiography examination.
Our measurements showed that the annular area, circumference and diameters increased with progressive FTR grades. Van Rosendael et al18 showed similar results for the annular area (TR <3+: 1,228 mm2 vs. 1,285 mm2 in our study; TR ≥3+: 1,540 mm2 vs. 1,667 mm2) and entire annular circumference (TR <3+: 129 mm vs. 130 mm; TR ≥3+: 145 mm vs. 147 mm). Differences in the results for the anteroposterior (TR <3+: 43 mm vs. 41 mm; TR ≥3+: 49 mm vs. 46 mm) and septolateral diameter (TR <3+: 36 mm vs. 40 mm; TR ≥3+: 40 mm vs. 47 mm) are most probably related to differences in the phases used for measurements and to the fact that van Rosendael18 included 16 patients without TR in the group of patients with FTR <3+.
Our study additionally determined the circumferences of the three annular parts. We believe that these numbers are useful for planning minimally invasive procedures of the TV. For example, the TriCinch device is directly attached to the tricuspid annulus and should be strictly positioned between the anteroposterior commissure and the mid-anterior annulus, thereby avoiding impact on adjacent commissures. Moreover, transcatheter repair of the TV is particularly challenging with large annular dimensions with a non-planar and elliptical shape, carrying the risk of affecting proximate structures such as the coronary sinus, the atrioventricular node and the right coronary artery22,23. Here, exact pre-interventional depiction and measurements of the TV geometry are important to avoid complications of the procedure.
We performed measurements in end-systole and mid-diastole to assess dynamic changes of the TV apparatus. We were able to show significant reductions in systole for the annular area and for the entire annulus across all patients and controls, which is in line with previous studies using 3D-TEE24 and MR imaging14.
The tricuspid annulus has an elliptical shape and is non-planar in healthy subjects12. Using 2D-TTE, Tei et al25 measured an annular circumference of 119 mm in healthy subjects and 140 mm in patients with FTR. Larger values were reported by Ring et al24 using 3D-TEE, reporting an annular circumference of 124 mm in healthy subjects and 145 mm in patients with FTR. Our study revealed values for the annular circumference of 119 mm for 2D and of 120 mm for 3D measurements in controls, 135 mm for 2D and 136 mm for 3D in patients with FTR <3+, and 153 mm for 2D and 154 mm for 3D in patients with FTR ≥3+. As expected, measurements in 3D were always larger than corresponding measurements in 2D, with a systematic underestimation between 1.0 mm and 1.3 mm reflecting the 3D nature of the annulus. The non-planarity diminished with increasing FTR grades, which confirms previous observations that FTR is associated with flattening of the annulus and dilatation and decreased longitudinal excursion during the cardiac cycle16.
Limitations
The following study limitations must be acknowledged. First, there are the inherent drawbacks of a retrospective study design. Second, the study was conducted with a relatively small number of patients. Third, we did not directly compare measurements from echocardiography with those from CT. Finally, we did not perform measurements in each phase of the RR interval, but only selectively in the end-systolic and mid-diastolic phases automatically generated by the scanner software. However, these phases are exactly those previously used for CT18 and recommended for echocardiography for quantifying the geometry of the TV19.
Conclusions
In conclusion, our study introduces an individually tailored contrast media protocol for an optimised visualisation of the TV with CT. CT measurements showed considerable differences of the tricuspid area, annulus and diameters both within the cardiac cycle and between controls and patients with FTR. We found a systematic underestimation for 2D as compared to 3D measurements of the tricuspid annulus, which progressively diminished with increasing grades of FTR. These issues need be taken into account when minimally invasive, transcatheter interventions of the tricuspid valve are planned.
| Impact on daily practice Minimally invasive transcatheter procedures represent an emerging alternative for treating patients with tricuspid regurgitation; however, the development of such techniques for use in routine clinical practice has to overcome several anatomical challenges. Thus, transcatheter repair of the tricuspid valve requires precise pre-interventional imaging of the tricuspid apparatus for determining the exact 3D geometry of the valve. Our study introduces an individually tailored contrast media protocol for the optimised CT imaging of the tricuspid valve. |
Conflict of interest statement
M. Taramasso is a consultant for St. Jude Medical. F. Maisano is a co-founder of 4Tech, a consultant for Abbott Vascular, St. Jude Medical, Medtronic, and Valtech Cardio, and receives royalties from Edwards Lifesciences. The other authors have no conflicts of interest to declare.