Abstract
Aims: Non-invasive quantitative compositional analysis of coronary plaque would be a major advantage to study coronary artery disease. This study explores the application to use the Hounsfield units (HU) distribution of coronary plaques imaged by multislice computed tomography-coronary angiography (MSCT-CA).
Methods and results: A dedicated computer-assisted method was developed to measure the HU distribution within a coronary plaque by MSCT-CA. To test the feasibility of the method, an ex vivo left anterior descending (LAD) coronary specimen, excised during autopsy, was imaged both by non-enhanced and enhanced MSCT-CA. Quantitative histology was used as a reference. To test the feasibility of the new volumetric analytic method, the MSCT-CA data were compared with volumetric histopathology. The coronary specimen, with a heterogeneously distributed plaque composition without large areas of calcification, was histologically sampled at five different locations, 5 mm apart, where at each location 15 sections were taken at 100 µm intervals, resulting in 75 individual histology sections. Tri-chrome Masson staining was used for histology quantification of three plaque/tissue components: smooth muscle cells (SMC), collagen and calcium. MSCT plaque composition was defined as “lower-HU” or “higher-HU” plaque and “calcium” based on the HU distribution. Comparison of the MSCT defined tissue components against histology showed a good relationship without significant differences.
Conclusions: This ex vivo study shows the feasibility of using the Hounsfield unit distribution to perform compositional coronary plaque volumetry by MSCT-CA. The results are encouraging.
Introduction
Multislice computed tomography of coronary arteries (MSCT-CA) has gained large interest as a diagnostic imaging tool for patients suspected of coronary artery disease (CAD)1-3. The three-dimensional (3D) nature of MSCT-CA allows 3D image reconstruction of the coronary artery tree4 with the advantage over standard coronary angiography of showing, not only luminal obstructions, but also plaque formation5. Quantitative MSCT-CA (QMSCT-CA) has been developed6-9, and most manufacturers are currently implementing computer-assisted analysis tools in their MSCT-CA consoles.
Since plaque composition is one of the important predictors of future events, quantification of its composition by a non-invasive imaging method would have advantages10,11. Early attempts by MSCT showed mixed results5,12. This could be explained by the lack of a robust dedicated MSCT-CA plaque compositional analysis method5,13-15. There are also technical difficulties comparing in vivo MSCT-CA data to reference methods, such as intracoronary ultrasound (ICUS) or histology. Despite the rapid technical developments of MSCT-CA, the thickness of reconstructed cross-sectional images is currently 400 to 600 µm and is significantly below that of ICUS (approximately 200 µm) and histology (6 µm). Since plaque components are mostly heterogeneously distributed, straightforward comparison of a single individual cross-sectional MSCT-CA image against a single individual cross-section of one of these two reference methods (e.g., a straightforward 2D comparison) may also lead to divergent results.
We developed a computer-assisted volumetric method for quantitative plaque compositional measurements by MSCT-CA and tested it on ex vivo human coronary specimen data. As a reference method, accurately matched computer-assisted volumetric histology was applied. For accurate matching of the two imaging modalities optical coherence tomography was applied (OCT)16.
Materials and methods
Human coronary specimen data
A left anterior descending coronary artery (LAD) was excised within 24 hours post-mortem 1 cm proximal to the bifurcation with the left circumflex (LCX), it covered a length of 40 mm. The specimen was prepared with only the adventitia left surrounding it and fixed in 4% formaldehyde, this to accurately match the MSCT plaque components to histology without a chance of accidentally including epicardial fat or myocardial tissue. A standard 6 Fr coronary sheath (Arrow, Reading, PA, USA) was introduced and fixed with stitches at the distal and proximal end of the specimen to allow stabilisation and central positioning of the imaging probes within the lumen. The Medical Ethical Committee of the Middelheim Hospital Antwerp, Belgium approved the study.
MSCT-CA imaging
Experimental settings and contrast material (CM)
Before MSCT-CA imaging, the specimen was immersed into an olive oil bath, to simulate epicardial fat, at room temperature. Previous studies have shown that a contrast medium influences the absolute HU values of the coronary plaque17. To investigate this effect on the HU distribution and to identify the impact on the quantification of the plaque composition, the specimens were imaged and analysed with and without contrast material (e.g., enhanced and non-enhanced). MSCT-CA imaging was first performed non-enhanced using saline only, injected using a 10 ml syringe from the sheath positioned at the proximal end of the specimen, followed later by a diluted contrast (Lomeprol 400 mg I/mL, Bracco, Milan, Italy), which measured 298.4±3.4 HU, corresponding to a level usually found clinically.
Scan parameters
The MSCT-CA scan (Sensation 16, Siemens AG, Munich, Germany) was performed with the following parameters: slices/collimation 16/0.75 mm, rotation time 375 ms, feed/rotation 3.0 mm (pitch 0.25), kV 120, mAs 400, effective slice thickness 1 mm, reconstruction increment 0.5 mm, Field of View 100 mm, convolution filter B60f. The B60f kernel was selected to get a “sharp” lumen-intima interface for later accurate border detection. The scan geometry was based on a retrospective ECG-gated protocol as is used for in vivo acquisition to avoid differences between machine parameters between the study and in vivo situation. This protocol is based on a low pitch that allows retrospective reconstruction of multiple iso-cardio-phasic moments within a cardiac cycle. In this case, a demo ECG was switched on and the scan was performed as if the heart rate was 71 BPM. The reconstruction algorithm uses 180° of rotation, bringing the effective temporal resolution down to 187 ms.
MSCT-CA image processing
The imaging data were stored in DICOM format on DVD. From the MSCT-CA scanned volume, the coronary specimen data was semi-automatically extracted by dedicated vessel extraction software (MSCT Extractor, CURAD BV, Wijk bij Duurstede, The Netherlands)8, which allows presentation of the data in a similar fashion to performing a pullback of a coronary catheter such as ICUS or OCT. Using this approach, longitudinally reconstructed coronary vessels (L-Views) originating from the different modalities can be simultaneously displayed for accurate comparison and matching18,19.
MSCT-CA plaque identification and tissue compositional measurements
The computer-generated re-sampled cross-sectional MSCT-CA image data set of the specimen was longitudinally reconstructed with the individual cross-sectional images at a distance of 0.1 mm apart19. To be able to identify the lumen/intima border in the non-enhanced MSCT-CA scan, at first the plaque was identified in the enhanced scan and then copied. The segmentation of the coronary plaque was performed in the L-views, a procedure similar to in vivo situations and previously validated8. After the plaque segmentation, the HU value distribution of the voxels within the plaque were calculated for each sub-segment and plotted as a histogram. The HU distribution curve was subdivided into half, with the two parts comprising the same HU range. “Lower-HU” plaque was determined as belonging to the lower HU values and “Higher-HU” plaque to the higher HU values. Voxels belonging to an elevated tail at the high HU-side were labelled calcified, so as a result there are three defined tissue component categories for MSCT-CA:
1) Lower-HU plaque
2) Higher HU plaque
3) CT-Calcium.
Histology
After imaging, histology was performed following a systematic sectioning methodology as proposed by Gundersen and Jensen20 (Figure 1). This study demonstrated that in adjacent 5 mm sections there was a large variation in plaque composition as a result of the heterogeneity of coronary atherosclerosis at close distances. Therefore, within five sub-segments of 1.5 mm each, 5 mm apart, 15 histology sections were taken at a mutual distance of 100 µm (n=75). The distal side of the bifurcation of the LAD to the LCX was used as starting point for the first histological section and sectioning was further performed in both distal and proximal direction until the end of the specimen.
Histology analysis was performed by using Trichrome Masson staining resulting in three defined histology tissue components:
1) Smooth Muscle Cells (HIST-SMC),
2) Collagen (HIST-Coll)
3) Calcium (HIST-Calcium).
Computer-assisted quantitative histology software (CURAD) was used to calculate the areas of the different tissue components and an experienced pathologist (MK) evaluated and approved these results (Figure 2).
OCT imaging as the matching procedure
A complex and crucial element is the matching of the histology sections with respect to the MSCT-CA images. A direct visual one-to-one comparison of the reconstructed cross-sectional images from the MSCT-CA data to the histology sections is difficult, if not impossible, due to the aforementioned large differences in image resolution. Since OCT has an almost similar lateral image resolution (7 µm) as histology, it was applied to establish the link (e.g., synchronisation) between MSCT-CA and histology16.
OCT imaging was performed using a commercially available 0.019-inch imaging catheter and a 1300 nm light source (Lightlab Imaging, Boston, MA, USA)16, which was automatically pulled back at a speed of 1.0 mm/s. The data was digitally stored and transferred to CD-ROM in the AVI file format. Conversion from AVI to DICOM format was performed using in-house developed software. The OCT images were loaded into a dedicated and validated vessel analysis software (CURAD) to be used for later matching to the MSCT imaging data19,21.
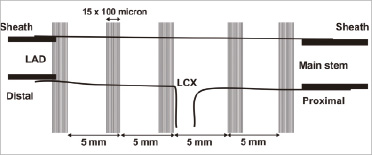
Figure 1. This figure presents the schematic sampling diagram of the histology sectioning. At five locations within the coronary specimen, 15 histology sections were taken 100 µm apart. At the distal and proximal end of the specimen, sheaths were inserted indicated by the thick black lines.
MSCT-CA vs. histology
In the vessel analysis software, both the OCT and MSCT-CA image data were loaded and longitudinally reconstructed. Using the identification of the sheath boundaries in both modalities as distance calibration, the cross-sectional image data could be automatically synchronised between OCT and MSCT (Figure 3). Then, a visual matching was performed between the histology sections and the OCT images based on the lumen morphology (Figure 4). Aided by the synchronisation, each visually matched OCT image was mapped to the location of the particular histology section within the MSCT-CA image data. In this way, the subsegments from the histology data could be matched with the corresponding subsegments in the MSCT dataset.
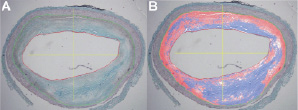
Figure 2. This figure shows a Tri-chrome Masson stained histology section (Panel A) and the result of the computer-assisted quantitative measurement by a colour-coded overlay (Panel B). Pixels containing collagen are coloured blue, calcium pixels are coloured white and smooth muscle cells pixels are coloured red.
Statistical analysis
Comparison between the histology and the MSCT-CA compositional results were performed by a paired student’s t-test using Microsoft Excel software. A p-value <0.05 was considered to be statistical significant.
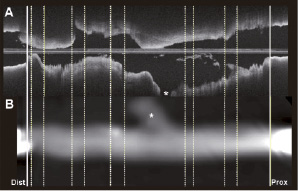
Figure 3. In panel A, the reconstructed longitudinal view (L-view) of the optical coherence tomography (OCT) images is presented. In panel B, the L-view of the MSCT-CA acquisition is presented. The inserted sheaths, used for the synchronisation between the two modalities, can be appreciated in both L-views, and are indicated by the thick solid white lines at the distal and proximal part of the specimen.
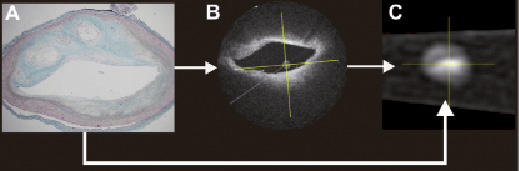
Figure 4. This figure presents the identification process tracing the position where the histology section is taken with respect to the MSCT-CA image data. On the basis of the similarity of the lumen morphology, the histology section was first identified in the OCT image data set (Panel B), which then leads, as well, to identification of the position of this particular histology section within the MSCT-CA image data, since the OCT and the MSCT-CA data sets are synchronised.
Results
OCT imaging and histology matching
From the five subsegments (Figure 5), 75 histology sections were derived and analysed. Seventy histology sections could be matched to the OCT images. In the distal subsegment, the sheath partially blocked the view for which the five histology sections could not be matched. An example of the visual appearance of the MSCT plaque analysis software is presented in Figure 5.
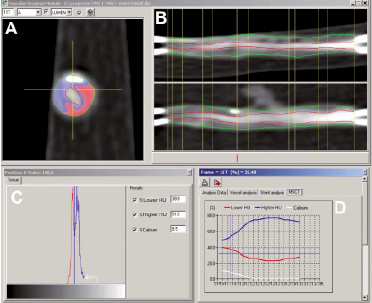
Figure 5. Panel A shows a tissue colour-coded MSCT-CA cross-sectional slice where white is calcification, blue=“Lower-HU” tissue and red=“Higher-HU” tissue. Panel B shows the longitudinal reconstruction of the MSCT acquired images with the outer vessel contour as a green line and the lumen-intima border as the red line. The 5 sub-segments are between the vertical yellow lines. Panel C shows the Hounsfield unit (HU) distribution of all voxels in the cross-section of panel A. Finally, the graph in panel D shows the relative portion of these three tissue types for each cross-section in one of the sub-segments.
MSCT-CA vs. histology
Both the saline (Figure 6A) and the contrast scan (Figure 6B) show a close relationship between the three defined tissue components of both modalities, (e.g., Hist-SMC vs. Lower-HU plaque; Hist-Coll vs. Higher-HU plaque and Hist-Calcium vs. CT-Calcium, respectively) with the enhanced scan showing the closest relationship. The relative mean plaque area results of the three defined tissue components between the modalities in the saline scan: Hist-SMC 58±16% vs. Lower-HU 48±24% (p=0.95), Hist-Coll 37±16% vs. Higher-HU 33±20% (p=0.8) and Hist-Calcium 5±2% vs. CT-Calcium 3±5% (p=0.4); respectively, did not show statistically significant differences. Also, the contrast enhanced scan results: Hist-SMC 58±16% vs. Lower-HU 46±16% (p=0.6), Hist-Coll 37±16% vs. Higher-HU 35±13% (p=0.4) and Hist-Calcium 5±2% vs. CT-Calcium vs. 3±5% (p=0.4); respectively, did not show statistically significant differences.
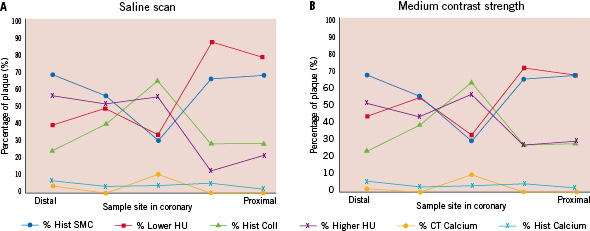
Figure 6. Panel A shows the MSCT-CA results for the saline scan expressed in percentages of plaque volume together with the quantitative histology results. Panel B shows the results of the medium contrast scan.
The HU distribution of the contrast-enhanced scan appears to be broader and shows more structure than the HU distribution from the saline scan (Figure 7). The relatively large deviation in the result of the distal segment was caused by the fact that at this site on the vessel there was only a small intimal thickening present, which was below the scanning capabilities of the CT.
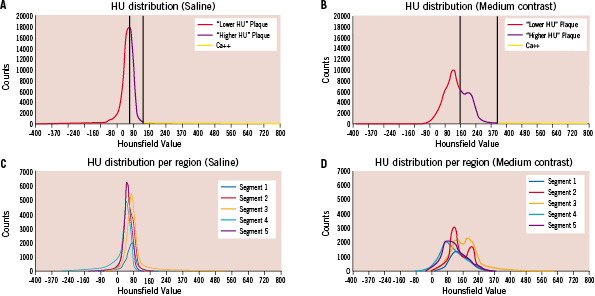
Figure 7. Panels A and B show the Hounsfield unit (HU) distributions as determined for the total plaque volume in the saline (A) and medium contrast (B) scan, together with the discrimination values (vertical lines). The discrimination line between “Lower-HU” and “Higher-HU” plaque is set in the middle of the HU distribution range as shown in panels A and B. As an example, in panel A the upper HU range shows a value of 150 and consequently the discrimination value is set at 75 HU. Panels C and D show the HU distributions for each of the 5 plaque sub-segments imaged with the saline (C) and medium contrast (D) solution. It can be appreciated that due the influence of the contrast medium, the HU distributions are broadened.
Discussion
This ex vivo study shows the feasibility of volumetric plaque tissue composition analysis by MSCT-CA. The influence of the use of contrast agents has also been evaluated. These are needed to visualise the coronary arteries in vivo, and have an effect on the plaque HU distribution as well; the HU distribution depending strongly on the administered contrast concentration. This complies with the results of Cademartiri et al17 who found a nearly linear relationship of the measured HU values in the plaque as a function of luminal contrast. Consequently, the plaque HU distribution broadens with increasing luminal contrast, and shows more structure. Although absolute HU values should therefore be used with caution, the discriminating power of the HU distribution seems to improve by the luminal contrast. This is supported by our result that the contrast-enhanced scan shows a closer match to histology than the saline scan (Figure 6). The mechanistic details of this contrast influence, taking into account scanner resolution, applied CT reconstruction algorithms and convolution kernels, needs to be further explored.
In contrast to this study, other MSCT-CA plaque compositional studies reported mostly disappointing results5,6,13,15. The deviation in the outcome between this study and others could have been caused by the application of different methods. MSCT-CA imaging of a rapidly moving coronary artery in vivo causes much more possible artifacts than ex vivo imaging of a coronary specimen. Furthermore, most other studies are applying ICUS as a reference method, which presents plaque compositional results differently than histology, making comparison of the studies difficult. Also, and maybe even more importantly, most of these studies applied a limited MSCT-CA plaque compositional measurement method by measuring manually HU values at a very limited number of positions within a coronary plaque at a given individual cross-sectional location in the coronary vessel. Furthermore, they did not take into account the influence of the administered contrast medium17.
Another possible cause of error in the other studies could be an erroneous identification (e.g., segmentation) of the plaque since correct delineation of the boundaries in an in vivo situation is difficult. To overcome this problem for this ex vivo feasibility study, the coronary specimen was prepared with only the adventitia surrounding it to make sure that only plaque tissue components could be analysed.
With our approach, we can derive the plaque composition from the HU distribution. The choice of the definition of three sub-classes of tissue components (e.g., lower-HU-, higher-HU plaque and calcium) is rather crude and has its limitations. However, the commonly used ICUS derived compositional techniques also show a limited number of different tissue components22,23. In vivo validation of our approach will most likely be performed using ICUS as a reference method and derived compositional techniques such as virtual histology23 and/or echogenicity24.
This study focuses on the feasibility of deriving quantitative tissue composition measurements from the plaque HU distribution in a controlled ex vivo setting, and is the first step towards further development of a method for clinical use. An in vivo plaque segmentation method and consequently a plaque dimensional measurement method similar to the one used in this study has been described8. A good correlation with quantitative ICUS was found. However, tracing both the luminal and external vessel boundaries in vivo is far more difficult due to artifacts caused by the cardiac and respiratory motion of the patient. In this study a B60f convolution kernel was applied to get a sharp interface between the lumen and the intima. In in vivo studies, usually a medium-sharp kernel in the range of B30f is applied, resulting in smoother images and more pleasing images for the eye, but with less sharp interfaces between different tissue structures.
The reproducibility of the proposed method depends on the accuracy of the delineation of the plaque within the original MSCT-CA images. Previous work showed that the reproducibility for dimensional MSCT-CA measurements was reasonable using previous generation scanners and with the current rapid technological developments of the MSCT-CA scanners, which are much faster in acquisition, reducing motion artifacts as well as increasing imaging resolution, the reproducibility is expected to increase8. This, although more research is necessary, could provide the opportunity to study plaque compositional changes under the influence of new treatment methods, non-invasively applying the proposed method.
Although MSCT-CA has a lower image resolution than ICUS, the results of this study indicate that when significant plaque burden exists, its composition can be measured from the HU distribution. Definition of more tissue sub-classes will be the subject of further research when scanner technology improves (e.g., higher spatial resolution).
Study limitations
The specimen was imaged after fixation with formaldehyde (4%). The advantage is that the circular shape of the vessel is preserved, however, the fixation could have altered the morphology and drains the water content of the plaque. There is little known about the fixation effects with respect to MSCT imaging in particular, but previous reports comparing fixed versus fresh harvested coronary arteries applying ICUS as imaging modality, showed only minor changes in plaque morphology25.
Another limitation is the absence of the perfusion of the plaque by the vasa vasorum with blood, and thus also with contrast. In vivo the plaque could be attenuated by the contrast via the vasa vasorum. Placement of the specimen within a thorax phantom could have brought the results closer to a clinical situation, however, at the cost of introducing other artefacts, such as x-ray absorption by bone, which could have influenced the results of this feasibility study.
The use of a 16-slice scanner is a limitation, however, without motion the spatial resolution of the scanner types is almost identical. The advantage of the 64-, and higher resolution scanners is the speed of acquisition. This results in reduced motion artefacts, which could provide the ability to perform tissue characterisation with MSCT-CA.
There was unfortunately not a large lipid pool present in this studied ex vivo specimen. In a case where a large lipid pool is present, this method will show an elevated leg on the lower-HU plaque side of the HU distribution curve, as opposed to the elevated leg of the presence of calcium (Figure 5C). It is important to stress that this method was tested in a coronary specimen with only a small calcium spot, which is more likely to be found in unstable plaques. Unfortunately, most coronary plaques often show a large area of homogeneously distributed calcium, and are considered to be stabilised. These plaques, with large calcified areas, are 1) less interesting and 2) less appropriate for this feasibility study since calcium obscures visualisation of other tissue components due to its high x-ray absorption imaged as bright blooming structures on MSCT-CA.
Conclusion
This ex-vivo study shows the feasibility of using the Hounsfield unit distribution to perform compositional coronary plaque volumetry by MSCT-CA. The results are encouraging.