Risk stratification is an integral and increasingly important aspect of the assessment of patients who are candidates for coronary revascularisation. Careful risk assessment for each patient, based on both clinical and angiographic characteristics, informs decisions regarding aggressive therapeutic interventions, triage among alternative hospital care levels and allocation of clinical resources.
Capodanno et al recently raised the interest within the interventional community on the importance of the assessment of performance of a prognostic score or prediction models.1,2 The performance of a risk model or prognostic score had however been well established within statistical literature, with up to four different assessments being previously described (Table 1).

An understanding of the basic concepts of the assessment of the prediction models are therefore essential, especially since this is currently subject to an intense area of research and new methods to refine these traditional concepts have and are still being developed.3
Steyerberg et al3 recently eloquently summarised these concepts. Traditional measures for binary and survival outcomes include the Brier score to indicate overall model performance, the concordance (or c) statistic for discriminative ability (or area under the receiver operating characteristic ROC curve), and goodness-of-fit statistics for calibration. Consequently, it has been suggested and recommended that, as a minimum, the reporting of discrimination and calibration are essential for understanding the importance of a prediction model, with a recommendation against relying on the c-statistic alone.3,4
The overall performance of the score
The scale of agreement (or lack of) between the predicted and actual outcomes (i.e., “goodness-of-fit” of the model) are central in allowing the assessment of the overall model performance. The overall model performance essentially captures both calibration and discrimination aspects as discussed below. The distances between observed and predicted outcomes are related to this concept, with better models having smaller distances between predicted and observed outcomes.
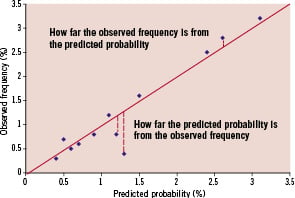
One such measure used widely to assess these concepts is the Brier score; this being initially proposed in the 1950s by Glenn Brier as a means to verify weather forecasts in terms of probability.9 The Brier score is a quadratic scoring rule based on the average squared deviation between predicted probabilities for a set of events and their observed outcomes (Figure 1).

Figure 1. The concept of the Brier Score.
Consequently, the score consists of only positive values ranging from 0 (perfect prediction) to 1 (worst possible prediction), with lower scores representing a higher accuracy and no rule-of-thumb, per se, on what constitutes an acceptable value. This would potentially allow comparison across different prediction models. 3,5-8
Discrimination and calibration
Accurate predictions discriminate between those with without the outcome. Individuals are categorised into different outcome groups on the basis of their risk model score in order to allow the physician to assess the outcomes of each group. A well-discriminated model should therefore be able to discriminate between a trend towards a significantly different event rate within each respective category. For example, higher, intermediate and lower event rates should be discernible by their respective scores from the prediction models. Receiver operator characteristic (ROC) curves are commonly used to assess discrimination and are essentially a plot of true positive rate (sensitivity) of the score against false positive rate (1-specificity or 1-true negative rate). The area under the ROC curve (AUROC) gives an indication of the ability of the score to discriminate between those who do and do not experience the event with 0.5 being no better than chance and 1.0 a perfectly discriminated model.3,5-8
Conversely, calibration assesses how closely the predicted probabilities from the risk model agree with the actual outcomes (i.e., detecting a lack of goodness-of-fit). In keeping with the weather forecast analogy, this gives a probability of the forecast event and how close this prediction would be to the actual forecast event if and when it occurs. With the risk model however, this would be the agreement of all the predicted probabilities against their respective observed outcomes, which would give an indication as to how well calibrated our model was.
The Hosmer-Lemeshow goodness-of-fit test is frequently used to assess for calibration by assessing for the presence or absence of goodness-of-fit (based on chi-squared analysis and the subsequent significance of the p-value) for logistic regression models. A significant p-value means the overall model fit is NOT good, it however gives no indication of the nature of the goodness-of-fit. Within this test, observed outcomes are plotted by deciles of predictions, with a good discriminating model having more spread between such deciles compared to a poorly discriminating model. Good calibration and good discrimination are therefore usually inconsistent for predictive models, with a necessary trade-off between the two being required.5-8
Lastly is the proposition of potentially assessing whether the score will work in different populations from the population from which the score was derived. This can be performed with internal validation; i.e., performed on two separate samples within the study population, with the score derived in one sample and tested on the other as performed by Ito et al11 in this issue of EuroIntervention. Conversely, external validation is where the score is assessed on a separate population from the study group. The former would perhaps lead to a more optimistic assessment, and the latter, a potentially more accurate assessment of the validity of the score model. Other ways to cross-validate the models include methods such as “boot-strapping” and methods analogous to “jack-knifing,” the former is described by Baran et al10 in this issue of EuroIntervention they are however, outside the scope of this editorial.
Within this issue of EuroIntervention, three articles using these models are included.
Ito et al11 developed a risk model to predict 30-day MACCE from the STENT Group Registry. The strengths of this study are that c-statistics, Hosmer-Lemeshow test of goodness-of-fit and an internal validation of the data were all performed. The latter was feasible given the large cohort of patients (>10,000 patients) investigated. The final c-statistic value was moderate (0.653 and 0.692 in the study and validation set) and was used by the authors to compare this model against other previously investigated models, despite the limitations of using c-statistics alone in comparing models as previously discussed.
Baran et al10 developed a risk model for the VLST risk score for the second year post-DES implantation. Once again c-statistics and Hosmer-Lemeshow tests were performed; in this case a bootstrap method was used as a validation tool. Given the expected low event rate associated with stent thrombosis and moderate population size (approximately 7,500 patients), which is essentially underpowered to fully investigate stent thrombosis, it is noteworthy to see that a risk model could still be developed and does hold out the intriguing possibility of developing a model with a better discriminatory value within a larger patient group. The limitations, such as only being performed with one DES type and not comparing with BMS are obvious. However, the potential clinical utility with regards to this model are yet to be explored, and does potentially open the door with regards to perhaps better advising patients with respect to dual antiplatelet therapy regimes and even possibly the selection of PCI techniques, despite the studies limitations.
Federspiel et al12 describe the fascinating concept of risk-benefit trade-off in the choice of coronary revascularisation modality: essentially trading the long-term risk of repeat revascularisation in exchange for short-term morbidity benefits. This issue is particularly pertinent in this present age, where the need for some individuals to remain active in their professional/personal lives are vital, and they are thus prepared to accept the longer term risks of coronary revascularisation in order to remain at their present functional state. Although this study was performed on the original ARTS study13 data, which in itself was undertaken over ten years previously, the results are nevertheless supportive of this concept, and do allow a quantification of a level of risk that a patient would be able to accept in order to maintain their present state. Clearly, and as to what the authors elude to in their discussion, in order to better calculate the risk, data from SYNTAX14 and FREEDOM trials, will be able to explore this concept to match modern day practice. This present study, however, is a welcome addition to the data in helping to explain these complex concepts to patients, and gives a taste of the quality of the data due to come from further studies investigating this issue.
In closing, it will be interesting to see how far we should go in allowing assessment of risk scores and importantly, allowing comparison of different types of risk models, within cardiology based trials. Undoubtedly, a greater collaboration with statisticians with expertise in these fields and cardiologists would aid in developing, refining and simplifying the assessment of these performance models.

