Abstract
Background: Data on the safety of valve-in-valve transcatheter mitral valve replacement (ViV-TMVR) compared with redo surgical mitral valve replacement (SMVR) in patients with a history of bioprosthetic mitral valve (MV) remain limited.
Aims: We aimed to evaluate the in-hospital, 30-day and 6-month readmission outcomes of ViV-TMVR compared with redo-SMVR in a real-world cohort.
Methods: The Nationwide Readmission Database was utilised, analysing data from 2015 to 2019. To determine the adjusted odds ratio (aOR), we used the propensity-matched analysis for major outcomes at index hospitalisation, 30 days, and 6 months during the episode of readmission.
Results: A total of 3,691 patients were included, of these, 24.2% underwent ViV-TMVR and 75.8% underwent redo-SMVR. Patients undergoing ViV-TMVR were older with higher rates of comorbidities. The mean length of stay (15 days vs 4 days) and cost of hospitalisation ($76,558 vs $46,743) were significantly higher for redo-SMVR. The rate of in-hospital all-cause mortality was also significantly lower in ViV-TMVR (2.6% vs 7.3%). By contrast, 30-day all-cause mortality during the episode of readmission (aOR 1.01, 95% confidence interval [CI]: 0.40-2.55) and all-cause readmission rates (aOR 0.82, 95% CI: 0.66-1.02) were similar between both groups. The incidence of all-cause readmissions at 6 months (aOR 0.83, 95% CI: 0.65-1.05) and all-cause mortality during the episode of readmission at 6 months (aOR 1.84, 95% CI: 0.54-6.36) were also comparable. The utilisation of the ViV-TMVR procedure increased significantly during our study duration, from 5.2% to 36.8%, (ptrend<0.01).
Conclusions: ViV-TMVR is associated with lower odds of in-hospital mortality, complications, and resource utilisation. The all-cause readmissions and 30-day and 6-month mortality during the episode of readmissions were comparable between both groups.
Introduction
Bioprosthetic valves have an advantage over mechanical valves due to a lower risk of thrombotic complications and a shorter duration of anticoagulation1. However, these benefits are offset by the frequent degenerative changes seen with bioprosthetic valves, leading to an increased need for repeat intervention2. Redo surgical mitral valve replacement (redo-SMVR) has been the treatment of choice in about one-third of patients with bioprosthetic mitral valve complications3. However, redo-SMVR has been linked with high morbidity and periprocedural mortality, due to the risks of an open surgical procedure, longer bypass time, and the complex anatomy of the prosthetic valves345. Valve-in-valve transcatheter mitral valve replacement (ViV-TMVR) is emerging as a viable alternative to redo-SMVR in high surgical risk patients with prosthetic mitral valve disease67. Following the success of valve-in-valve transcatheter aortic valve replacement (ViV-TAVR), the US Food and Drug Administration (FDA) has now approved ViV-TMVR use for degenerated bioprosthetic mitral valves, but data on the comparative outcomes of ViV-TMVR and redo-SMVR remain limited8. The current study aims to evaluate the in-hospital and short-term outcomes of ViV-TMVR compared with redo-SMVR in a real-world cohort.
Methods
Data source
This is a retrospective analysis of the National Readmission Database (NRD) using data from September 2015 to November 2019. The NRD is a database provided by the Agency for Healthcare Research and Quality (AHRQ) and developed through the Federal-State industry partnership. The Healthcare Cost and Utilization Project (HCUP) maintains data on approximately 35 million annual weighted discharges. The discharge data are available from 28 states, representing 59.7% of the US population and 58.7% of in-patient hospitalisations9. It is an all-payer database that captures nationally representative records on hospital readmissions and resource utilisation. For tracing readmissions within a calendar year, each patient is assigned a unique randomly generated identifier code (NRD_visitLink) to protect their confidentiality. The “NRD days-to-event” variable is utilised to capture and trace readmissions from January until the end of December in a calendar year but cannot trace across different years. A timing variable called “admittime” was computed to calculate the timing of readmission after discharge from the index hospitalisation. The provided data are compliant with the HCUP guidelines with observations <11 not reported in the available tables. This study was exempted from the institutional review board (IRB) approval as it was performed on publicly available de-identified data.
The NRD contains data on the total in-patient charges billed by the hospital and differs from the actual cost, which includes the total expense needed for hospital services including utilities, wages, and supplies. To further calculate the cost, the HCUP provides cost-to-charge ratio (CCR) files that provide hospital-level data, including hospital-specific ratios or weighted average ratios, to supplement the original NRD file. Cost information is obtained from the accounting reports of the participating hospitals, which are collected by the Centers for Medicare and Medicaid Services (CMS), with some imputation of missing values as deemed necessary10. For our study, the provided adjusted cost of care is calculated by multiplying the element of the total charges provided by the NRD and the CCR.
Study sample and patient selection
We extracted data using the International Classification of Diseases, 10th Revision Clinical Modifications (ICD-10-CM) (Supplementary Table 1). All patients with a history of bioprosthetic mitral valve (MV) undergoing ViV-TMVR or redo-SMVR were selected using NRD data from the fourth quarters (Q4) of 2015 to November 2019. The ICD-10-CM codes for prosthetic valve dysfunction and history of prosthetic valve (T82.01XA, T82.02XA, T82.03XA, T82.09XA, T82.221A, T82.222A, T82.223A, T82.228A, Z45.09, T82.857 and Z95.2) were used to identify admissions with a degenerated bioprosthetic valve. We excluded patients with aortic valve disease, tricuspid valve disease, pulmonic valve disease, coronary artery bypass graft surgeries, surgical aortic valve replacement, tricuspid/pulmonic valve surgery, transcatheter aortic valve replacement, atrial/ventricular septal defect closures, and infective endocarditis. We defined index admissions for patients undergoing ViV-TMVR or redo-SMVR and who were discharged alive with no missing variables critical for identifying readmissions (i.e., length of stay, mortality, or days-to-event variables). For in-hospital index hospitalisation and their 30-day readmissions, December admissions were excluded to allow for the calculation of 30-day readmissions rates. For the 6-month readmission analysis, July to December admissions were excluded to allow for the calculation of 6-month readmission rates. Baseline patient characteristics, including sex, age, hospital characteristics (i.e., teaching status and bed size), and median household income, and patient comorbidities (i.e., hypertension, diabetes, etc.) were included in the current study. For patients who had multiple readmissions, only the first hospitalisation is included in the analysis. Readmission was defined as the first elective or non-elective admission after discharge. Readmission mortality was defined as mortality during re-hospitalisation, and it did not include patients that died outside the hospital or out of the state. For readmission outcomes, we reported 30-day and 6-month readmission rates and mortality rates during the episode of readmission follow-up. We used the discharge weights provided by the NRD to provide nationally representative data. A detailed methods flow chart of the study is shown in Figure 1.
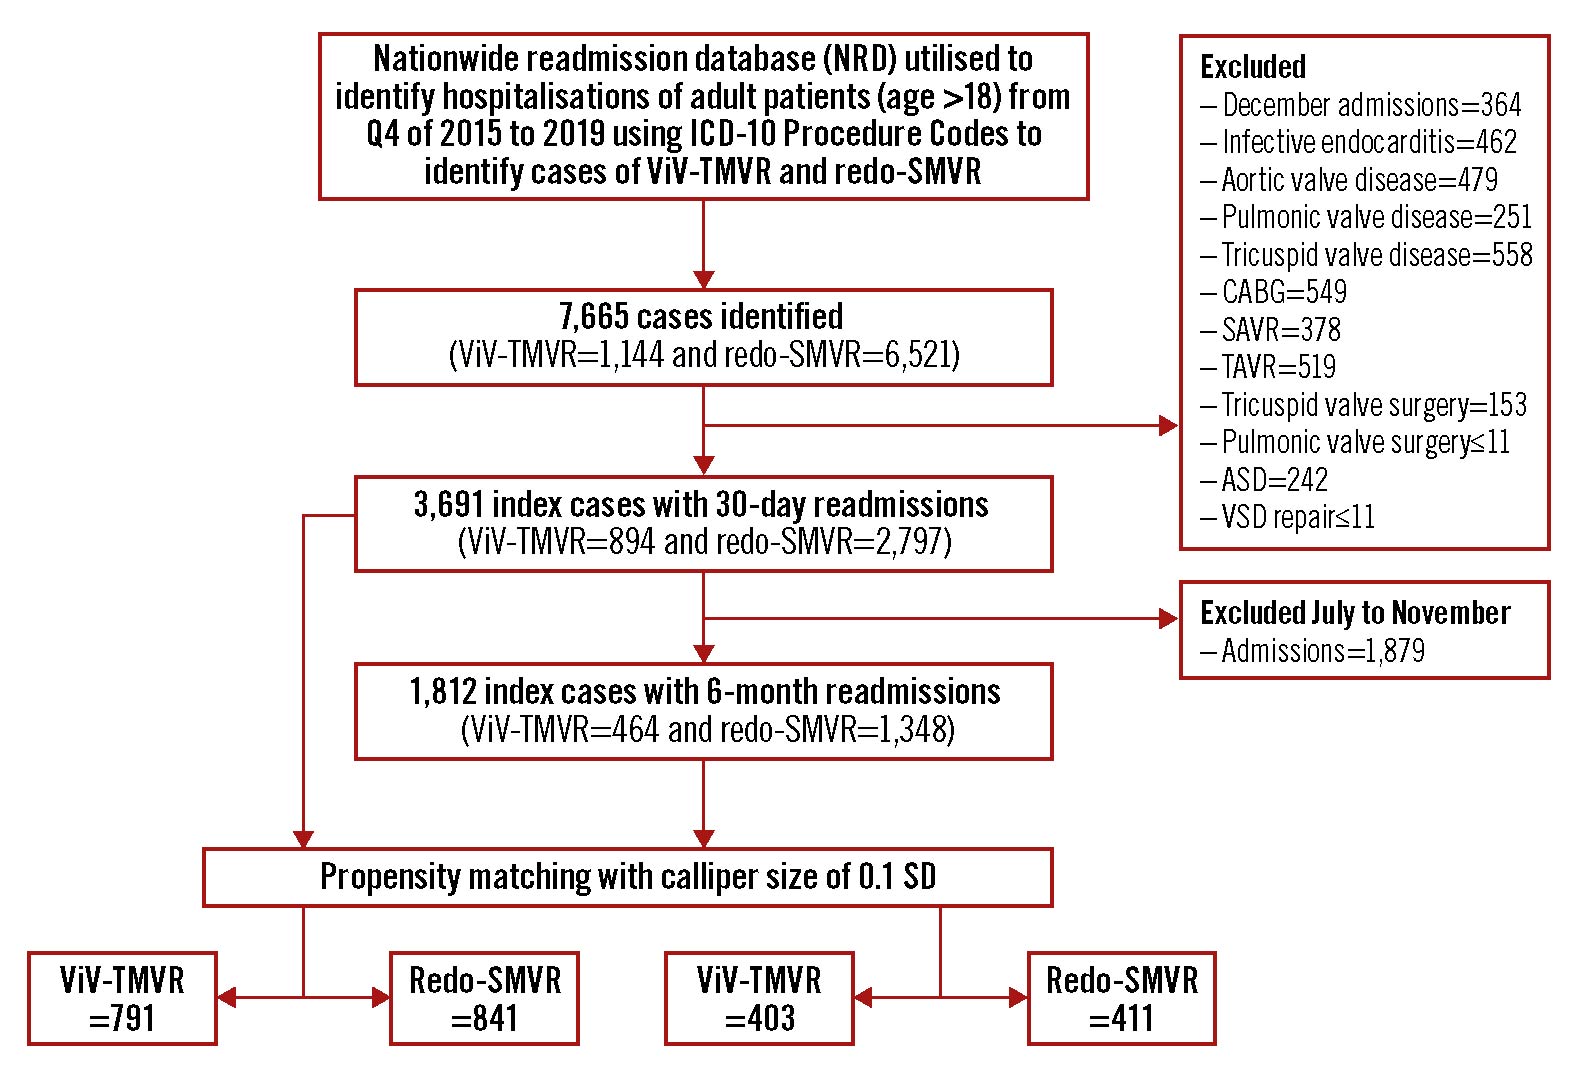
Figure 1. Study flow diagram. ASD: atrial septal defect; CABG: coronary artery bypass graft; ICD-10: International Classification of Diseases 10th Revision; SAVR: surgical aortic valve replacement; SD: standard deviation; SMVR: surgical mitral valve replacement; TAVR: transcatheter aortic valve replacement; ViV-TMVR: valve-in-valve transcatheter mitral valve replacement; VSD: ventricular septal defect repair
Study outcomes
The primary outcomes were in-hospital mortality, 30-day, and 6-month all-cause readmissions, and mortality during the episode of readmission after ViV-TMVR in comparison with redo-SMVR. The secondary outcomes included disposition, temporal trends, procedural complications, and measures of utilisation of resources (i.e., adjusted hospitalisation cost and length of hospital stay).
Statistical analysis
Statistical analysis was performed using RStudio software for statistical computing version 4.3 (Rstudio). Categorical variables were expressed as frequencies and percentages, and continuous variables were reported as medians with an interquartile range (IQR). Baseline characteristics were compared using Pearson’s chi-square or Fisher’s exact tests for categorical variables and the Mann-Whitney U test for continuous variables. For the weighted analysis of data, we used a survey package of R11. The Cochrane-Armitage test was used for trend analysis. The survey package takes into consideration the nationally weighted data and clustering outcomes within hospitals to report nationally representative proportions of readmissions11. To account for potential confounding and selection bias, a propensity score matching model using R’s MatchIt package12 was developed using logistic regression to derive 2 nearly matched groups for comparative outcomes analysis of ViV-TMVR versus redo-SMVR. A nearest-neighbour variable ratio, parallel, balanced propensity matching model was made using a calliper width of 0.1 standard deviations (SD). The variables used in the propensity matching model included: age, sex, mode of admission (elective versus non-elective), median household income, insurance status, and baseline comorbidities (anaemia, atrial fibrillation, heart failure, chronic obstructive pulmonary disease, coronary artery disease, cerebrovascular disease, diabetes, hypertension, liver disease, obesity, peripheral vascular disease, prior pacemaker, chronic kidney disease, end-stage renal disease and smoking). All variables considered clinically meaningful on an a priori basis were selected regardless of the significance of the p-value. Covariate balance before and after propensity matching is shown in Figure 2. R’s survival package13 was also used for cumulative incidences, using a log-rank test to assess the timing of readmissions within 30 days, and 6 months. A falsification14 and E-value analysis15 to evaluate for the presence of residual confounding for in-hospital mortality, and 30-day and 6-month readmission mortality were performed. The E-value provides an estimate of the minimum strength of association for an unmeasured confounder with both the outcome and the treatment group to entirely explain the treatment-outcome association, conditional on the measured covariates. For the falsification analysis, 2 outcomes that are not expected to be associated with the treatment were selected. The falsification endpoints included hip/femur fracture and acute chronic obstructive pulmonary disease (COPD) exacerbation. A lack of association of falsification endpoints with the intervention supports a causal association between the treatment and study outcomes. For all analyses, a 2-tailed p-value of 0.05 is considered statistically significant.
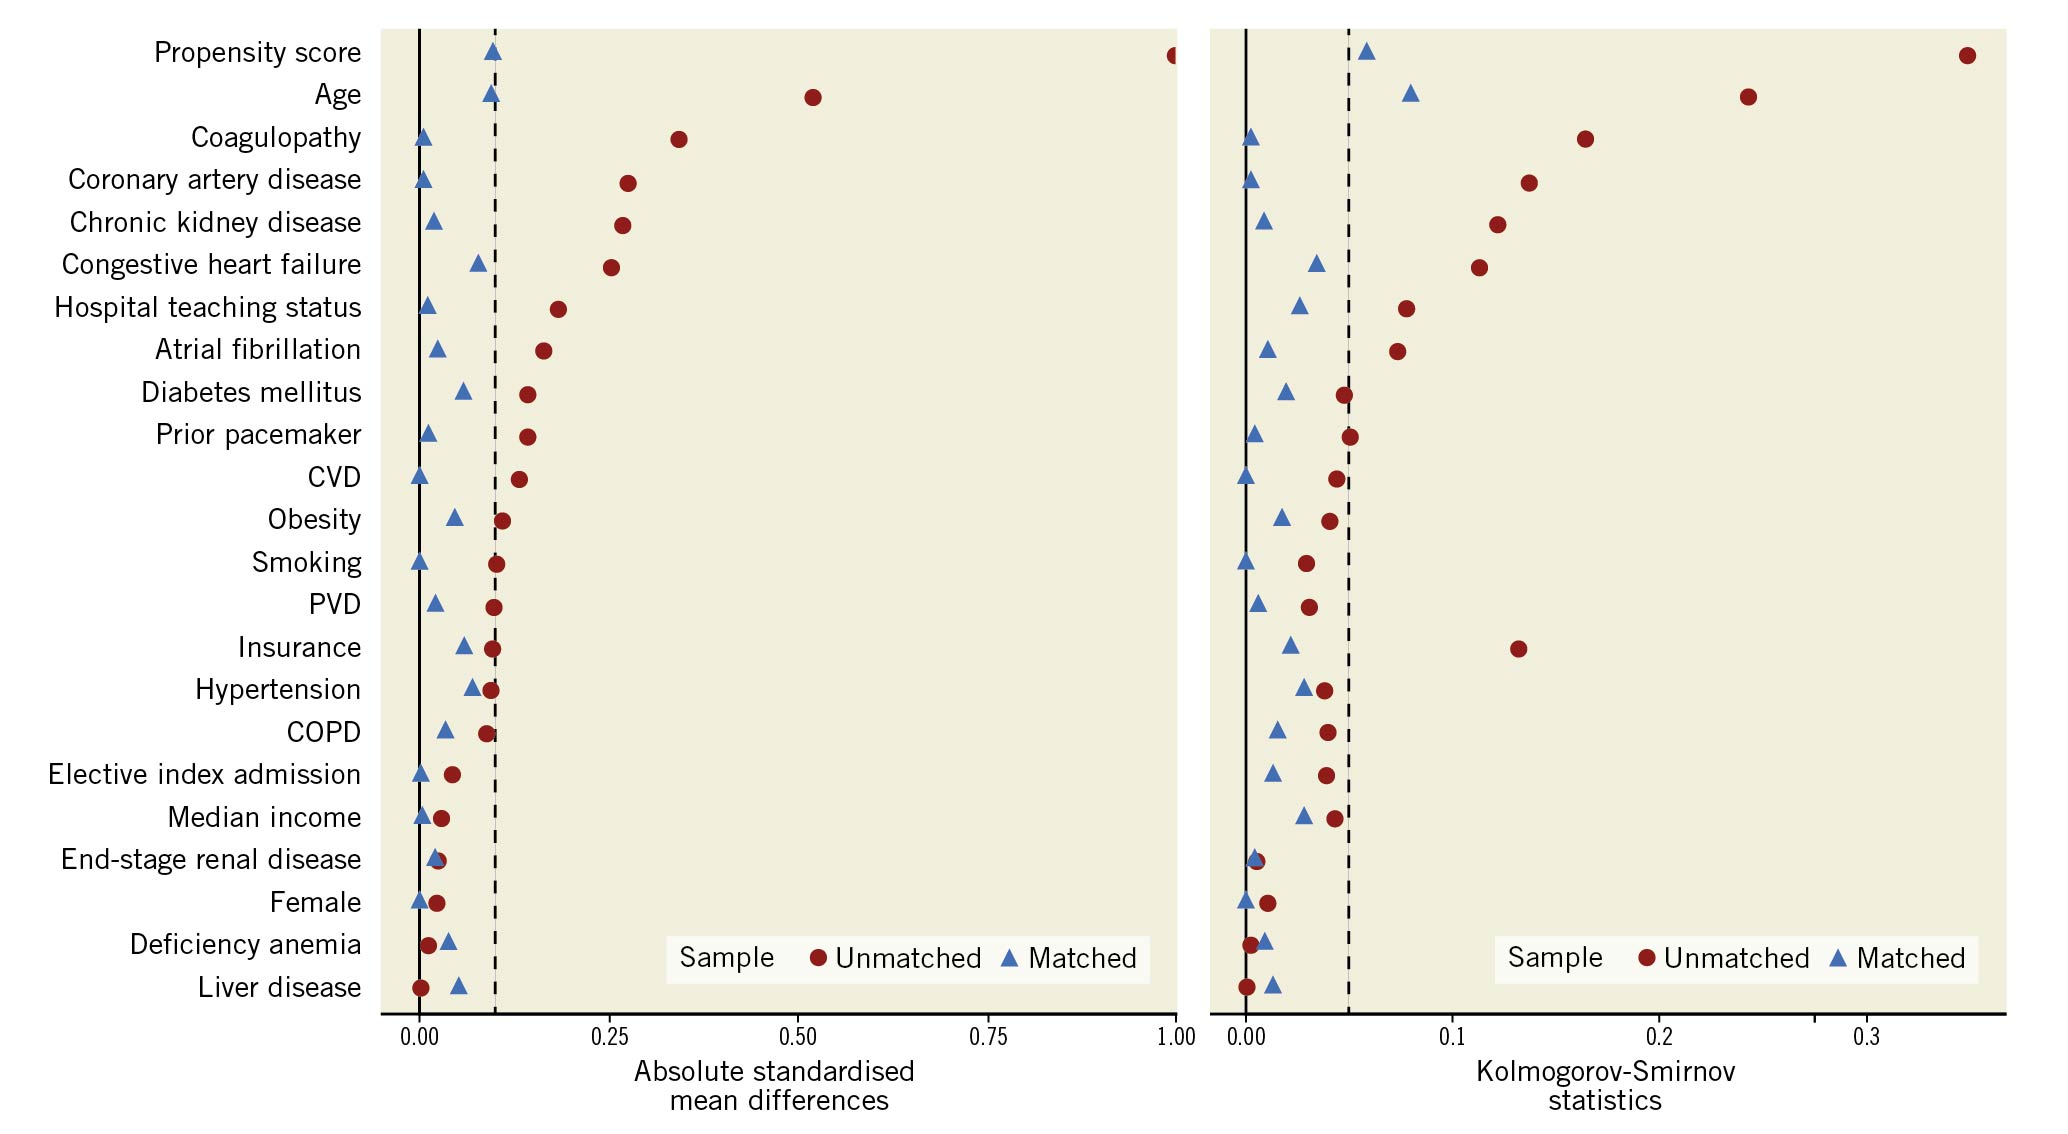
Figure 2. Covariate balance before and after propensity matching. COPD: chronic obstructive pulmonary disease; CVD: cardiovascular disease; PVD: peripheral vascular disease
Results
Selection of cases
A total of 7,665 patients were identified during the initial screening. After applying the exclusion criteria (i.e., excluding coronary artery bypass graft surgeries, aortic valve disease, tricuspid valve disease, pulmonic valve disease, surgical aortic valve replacement, tricuspid/pulmonic valve surgery, transcatheter aortic valve replacement, atrial/ventricular septal defect closures, and infective endocarditis), 3,691 index hospitalisations with 30-day readmissions were selected. Of these, 23.2% underwent ViV-TMVR (n=894) and 76.8% underwent redo-SMVR (n=2,797). Amongst the ViV-TMVR procedures, 84.2% (n=875) were performed via the transseptal approach. On propensity matching, 791 cases of ViV-TMVR were matched with 841 cases of redo-SMVR.
Baseline characteristics
On crude analysis, patients undergoing ViV-TMVR (76 years, IQR 68-81) were significantly older than those undergoing redo-SMVR (69 years, IQR 60-76). In terms of comorbidities, the frequency of congestive heart failure (84.3% vs 72.8%; p<0.01), coronary artery disease (60.6% vs 45.7%; p<0.01), and chronic kidney disease (41.3% vs 31%; p<0.01) were significantly higher in ViV-TMVR compared with the redo-SMVR group, respectively. On propensity score-matched analysis, balanced comparison groups with no significant differences in the baseline characteristics were selected (Table 1).
Table 1. Baseline characteristics of the study population.
|
Variable, n (%) |
Unmatched |
Propensity matched |
||||
|---|---|---|---|---|---|---|
|
ViV-TMVR (n=894) |
Redo-SMVR (n=2,797) |
ViV-TMVR (n=791) |
Redo-SMVR (n=841) |
p-value |
||
|
Age, median (IQR), years |
76 (68-81) |
69 (60-76) |
75 (67-79) |
73 (65-79) |
<0.01 |
|
|
Female |
484 (54.2) |
1,537 (54.9) |
438 (55.4) |
455 (54.1) |
0.61 |
|
|
Elective index admission |
577 (64.5) |
1,723 (61.6) |
509 (64.4) |
549 (65.3) |
0.69 |
|
|
Deficiency anaemia |
48 (5.4) |
151 (5.4) |
39 (4.9) |
38 (4.5) |
0.71 |
|
|
Atrial fibrillation |
582 (65.1) |
1,993 (71.3) |
528 (66.8) |
559 (66.5) |
0.88 |
|
|
Congestive heart failure |
754 (84.3) |
2,035 (72.8) |
654 (82.7) |
658 (78.2) |
0.02 |
|
|
Chronic obstructive pulmonary disease |
289 (32.3) |
755 (27.0) |
259 (32.8) |
243 (28.9) |
0.09 |
|
|
Coagulopathy |
181 (20.3) |
1,002 (35.8) |
181 (22.9) |
182 (21.7) |
0.55 |
|
|
Coronary artery disease |
542 (60.6) |
1,278 (45.7) |
454 (57.4) |
478 (56.9) |
0.82 |
|
|
Cerebrovascular disease |
78 (8.7) |
378 (13.5) |
77 (9.7) |
84 (10.0) |
0.86 |
|
|
Diabetes mellitus |
64 (7.1) |
369 (13.2) |
64 (8.1) |
91 (10.9) |
0.06 |
|
|
Hypertension |
747 (83.5) |
2,260 (80.8) |
657 (83.1) |
681 (81.0) |
0.27 |
|
|
Liver disease |
59 (6.6) |
195 (7.0) |
46 (5.9) |
65 (7.7) |
0.13 |
|
|
Obesity |
114 (12.7) |
483 (17.3) |
111 (14.0) |
130 (15.5) |
0.42 |
|
|
Peripheral vascular disease |
63 (7.1) |
310 (11.1) |
62 (7.8) |
69 (8.2) |
0.79 |
|
|
Prior pacemaker |
181 (20.2) |
423 (15.1) |
158 (20.0) |
164 (19.5) |
0.81 |
|
|
Chronic kidney disease |
369 (41.3) |
868 (31.0) |
318 (40.2) |
345 (41.1) |
0.72 |
|
|
End-stage renal disease |
45 (5.0) |
137 (4.9) |
41 (5.2) |
47 (5.6) |
0.71 |
|
|
Smoking |
59 (6.6) |
256 (9.1) |
56 (7.1) |
54 (6.4) |
0.59 |
|
|
Hospital teaching status |
Metropolitan non-teaching |
56 (6.3) |
382 (13.6) |
65 (8.3) |
89 (10.6) |
<0.01 |
|
Metropolitan teaching |
821 (91.8) |
2,329 (83.3) |
720 (91.0) |
717 (85.3) |
||
|
Non-metropolitan hospital |
17 (1.9) |
86 (3.1) |
<11 (<1.4)* |
34 (4.0) |
||
|
Median quartile of income |
0-25th percentile |
186 (20.8) |
719 (25.7) |
170 (21.5) |
209 (24.9) |
0.42 |
|
26-50th percentile |
224 (25.0) |
678 (24.2) |
191 (24.2) |
199 (23.6) |
||
|
51-75th percentile |
229 (25.6) |
711 (25.4) |
205 (26.0) |
205 (24.4) |
||
|
76-100th percentile |
241 (27.0) |
613 (21.9) |
213 (26.9) |
211 (25.0) |
||
|
Insurance |
Medicare |
734 (82.1) |
1,909 (68.3) |
633 (80.1) |
644 (76.6) |
0.03 |
|
Medicaid |
40 (4.5) |
230 (8.2) |
40 (5.1) |
47 (5.6) |
||
|
Private insurance |
100 (11.1) |
567 (20.3) |
97 (12.2) |
127 (15.1) |
||
|
Self-pay |
<11 (1.2)* |
39 (1.4) |
<11 (<1.4)* |
<11 (1.3)* |
||
|
Others |
17 (1.9) |
46 (1.7) |
17 (2.2) |
<11 (1.3)* |
||
|
*Observations <11 are not reported as per HCUP guidelines. HCUP: Healthcare Cost and Utilization Project; IQR: interquartile range; SMVR: surgical mitral valve replacement; ViV-TMVR: valve-in-valve transcatheter mitral valve replacement |
||||||
In-hospital all-cause mortality and procedural complications
On crude analysis of the index hospitalisation, the unadjusted all-cause mortality and in-hospital complications were significantly higher with redo-SMVR. A propensity score-matched analysis mirrored the findings of the crude analysis. The adjusted odds of all-cause mortality remained significantly higher in patients undergoing redo-SMVR (7.3%) compared with ViV-TMVR (2.6%, odds ratio [OR] 1.55, 95% confidence interval [CI]: 1.05-2.27). The odds of non-home facility discharge were 2-fold higher with redo-SMVR (77.2%) compared with ViV-TMVR (46.1%, OR 2.64, 95% CI: 2.26-3.08). Similarly, the in-hospital complication rates, including stroke, need for transfusions, and need for permanent pacemaker (PPM) implantation were higher for the surgery group compared with the transcatheter approach. The median length of stay on index hospitalisation (15 days vs 4 days; p<0.01) and adjusted cost of hospitalisation ($76,558 vs $46,743; p<0.01) were also significantly higher for redo-SMVR compared with the ViV-TMVR group, respectively (Table 2, Figure 3).
Table 2. Hospitalisation outcomes at 30 days and 6 months after the procedure.
|
Variable, N (%) |
Unadjusted |
Propensity matched |
||||
|---|---|---|---|---|---|---|
|
ViV-TMVR (n=894) |
Redo-SMVR (n=2,797) |
p-value |
ViV-TMVR (n=791) |
Redo-SMVR (n=841) |
p-value |
|
|
In-hospital outcomes |
||||||
|
Mortality |
33 (3.7) |
156 (5.6) |
0.03 |
21 (2.6) |
61 (7.3) |
<0.01 |
|
Home discharge |
470 (52.5) |
826 (29.5) |
<0.01 |
426 (53.9) |
192 (22.8) |
<0.01 |
|
Skilled nursing care |
426 (47.5) |
1,968 (70.6) |
365 (46.1) |
649 (77.2) |
||
|
Cardiogenic shock |
93 (10.4) |
400 (14.3) |
<0.01 |
68 (8.6) |
93 (11.0) |
0.11 |
|
Stroke |
13 (1.4) |
148 (5.3) |
<0.01 |
13 (1.6) |
36 (4.3) |
<0.01 |
|
Vascular complications |
85 (9.5) |
523 (18.7) |
<0.01 |
73 (9.2) |
126 (15.0) |
<0.01 |
|
Blood transfusion |
110 (12.3) |
876 (31.3) |
<0.01 |
96 (12.1) |
245 (29.1) |
<0.01 |
|
Cardiac arrest with CPR |
<11 (<1.2)* |
55 (2.0) |
0.03 |
<11 (<1.4)* |
20 (2.4) |
0.02 |
|
Pneumonia |
63 (7.0) |
343 (12.2) |
<0.01 |
58 (7.4) |
102 (12.2) |
<0.01 |
|
Urinary tract infection |
77 (8.6) |
277 (9.9) |
0.25 |
63 (8.0) |
79 (9.4) |
0.31 |
|
Pericardial effusion |
14 (1.5) |
78 (2.8) |
0.04 |
12 (1.6) |
26 (3.1) |
0.04 |
|
PPM |
26 (2.9) |
272 (9.7) |
<0.01 |
23 (2.9) |
93 (11.1) |
<0.01 |
|
Resource utilisation |
||||||
|
Length of stay, median (IQR), days |
4 (2-10) |
15 (8-26) |
<0.01 |
4 (2-11) |
15 (8-25) |
<0.01 |
|
Cost of hospitalisation, median (IQR), $ |
49,019 (38,102-89,688) |
73,879 (52,613-106,736) |
<0.01 |
46,743 (35,997-89,834) |
76,558 (50,148-142,501) |
<0.01 |
|
Readmission outcomes at 30 days |
||||||
|
All-cause readmissions |
131 (14.7) |
345 (12.3) |
0.07 |
120 (15.1) |
119 (14.2) |
0.57 |
|
30-day readmission mortality |
<11 (<1.2)* |
19 (0.7) |
0.98 |
<11 (1.4)* |
<11 (<1.3)* |
0.36 |
|
Cardiogenic shock |
0 (0.0) |
<11 (<0.4)* |
0.07 |
0 (0.0) |
<11 (<1.3)* |
0.04 |
|
Stroke |
<11 (<1.2)* |
<11 (<0.4)* |
0.81 |
<11 (1.4)* |
<11 (<1.3)* |
0.99 |
|
Vascular complications |
<11 (<1.2)* |
24 (0.9) |
0.59 |
<11 (1.4)* |
<11 (<1.3)* |
0.41 |
|
Blood transfusion |
16 (1.8) |
33 (1.2) |
0.17 |
15 (1.9) |
<11 (<1.3)* |
0.20 |
|
Cardiac arrest with CPR |
<11 (<1.2)* |
4 (0.1) |
0.60 |
<11 (1.4)* |
<11 (<1.3)* |
0.99 |
|
Pneumonia |
13 (1.4) |
38 (1.4) |
0.83 |
<11 (1.4)* |
<11 (<1.3)* |
1.00 |
|
Urinary tract infection |
<11 (<1.2)* |
35 (1.3) |
0.75 |
<11 (1.4)* |
<11 (<1.3)* |
0.80 |
|
Pericardial effusion |
<11 (<1.2)* |
14 (0.5) |
0.27 |
<11 (1.4)* |
<11 (<1.3)* |
0.25 |
|
PPM |
<11 (<1.2)* |
<11 (<0.4)* |
0.25 |
<11 (1.4)* |
0 (0.0) |
0.08 |
|
Falsification outcome |
||||||
|
Hip/femur fracture |
0 (0) |
<11 (<0.4)* |
0.57 |
0 (0) |
<11 (<1.3)* |
0.33 |
|
Acute COPD exacerbation |
<11 (<1.2)* |
<11 (<0.4)* |
0.54 |
<11 (1.4)* |
<11 (<1.3)* |
0.61 |
|
Resource utilisation |
||||||
|
Length of stay, median (IQR), days |
5 (3-11) |
4 (2-8) |
0.16 |
5 (3-11) |
4 (2-9) |
0.10 |
|
Cost of hospitalisation, median (IQR), $ |
10,309 (4,207-18,794) |
7,105 (4,277-15,855) |
0.28 |
10,298 (4,420-17,023) |
8,327 (4,509-16,823) |
0.67 |
|
Readmission outcomes at 6 months |
(n=464) |
(n=1,348) |
(n=403) |
(n=411) |
||
|
All-cause readmissions |
126 (27.1) |
317 (23.5) |
0.12 |
101 (25.2) |
123 (29.8) |
0.13 |
|
Mortality |
<11 (<2.4)* |
16 (1.2) |
0.33 |
<11 (<2.4)* |
<11 (<0.8)* |
0.11 |
|
Falsification outcome |
||||||
|
Hip/femur fracture |
<11 (<2.4)* |
<11 (<0.8)* |
0.43 |
<11 (<2.4)* |
<11 (<0.8)* |
0.99 |
|
Acute COPD exacerbation |
<11 (<2.4)* |
<11 (<0.8)* |
0.27 |
<11 (<2.4)* |
<11 (<0.8)* |
0.46 |
|
Resource utilisation |
||||||
|
Length of stay, median (IQR), days |
4 (2-9) |
4 (2-8) |
0.94 |
4 (2-9) |
4 (2-8) |
0.85 |
|
Cost of hospitalisation, median (IQR), $ |
9,472 (4,072-19,549) |
8,427 (4,706-18,635) |
0.54 |
8,904 (3,943-15,998) |
8,723 (4,981-17,080) |
0.25 |
|
*Observations <11 are not reported as per HCUP guidelines. COPD: chronic obstructive pulmonary disease; CPR: cardiopulmonary resuscitation; HCUP: Healthcare Cost and Utilization Project; IQR: interquartile range; PPM: permanent pacemaker; SMVR: surgical mitral valve replacement; ViV-TMVR: valve-in-valve transcatheter mitral valve replacement |
||||||
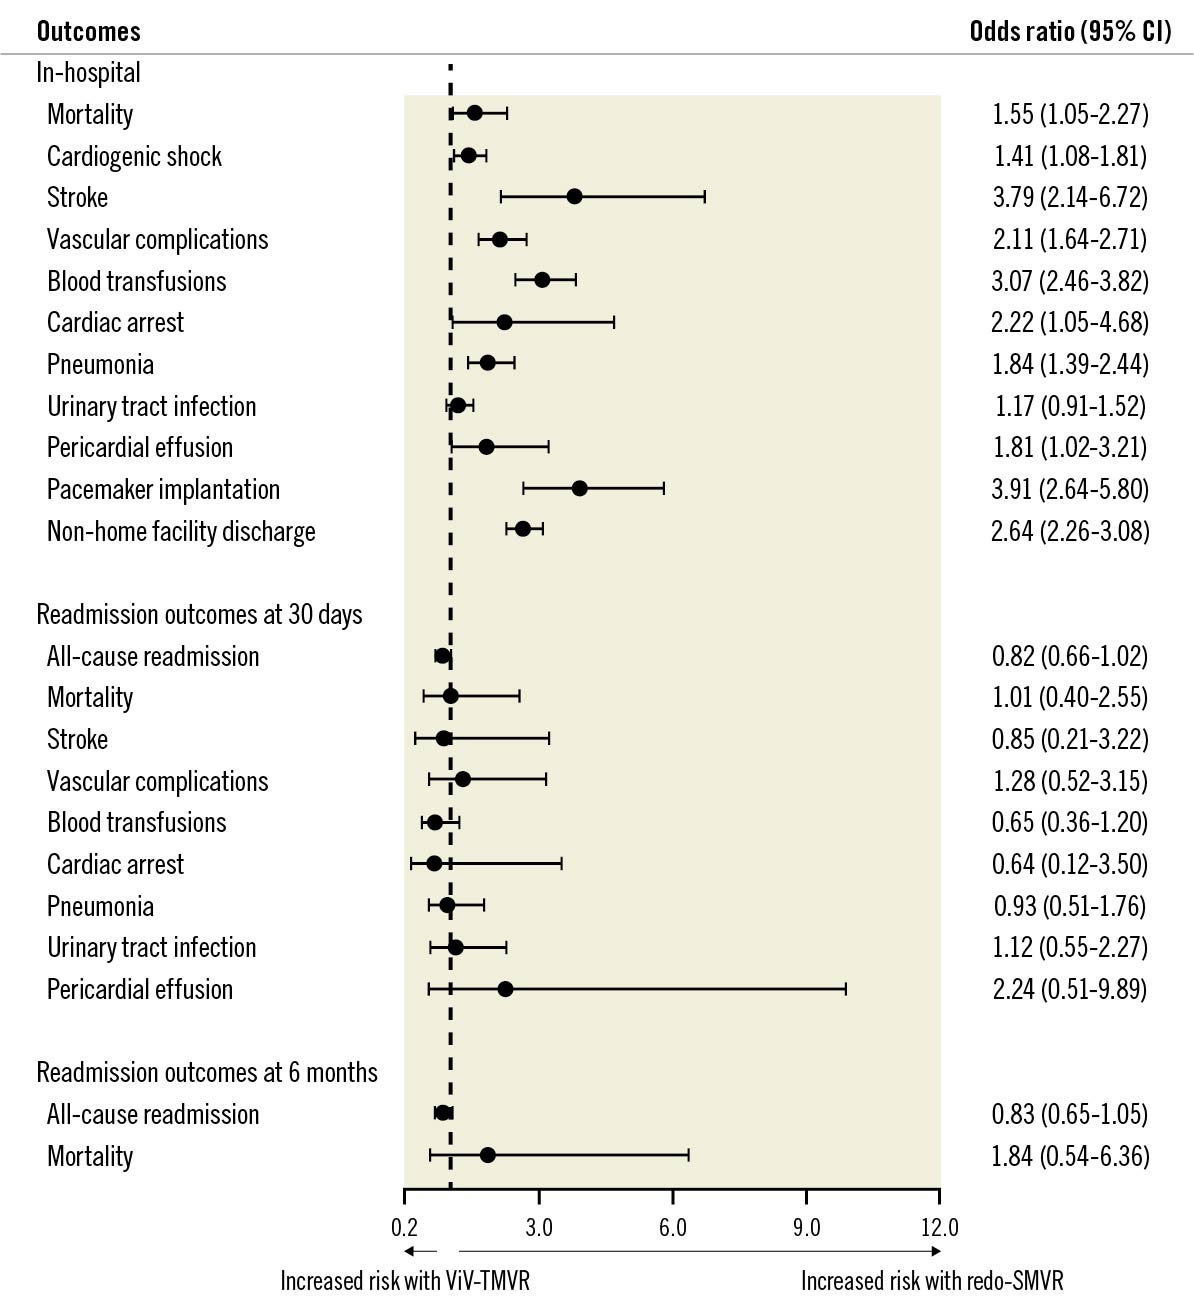
Figure 3. Adjusted odds ratio for in-hospital outcomes. Adjusted outcomes are based on propensity-matched analysis. Propensity matching model adjusted for: age, sex, mode of admission (elective versus non-elective), median household income, insurance status and baseline comorbidities (anaemia, atrial fibrillation, heart failure, chronic obstructive pulmonary disease, coronary artery disease, cerebrovascular disease, diabetes, hypertension, liver disease, obesity, peripheral vascular disease, chronic kidney disease, end-stage renal disease and smoking). CI: confidence interval; SMVR: surgical mitral valve replacement; ViV-TMVR: valve-in-valve transcatheter mitral valve replacement
Temporal trends utilisation and procedural outcomes for ViV-TMVR versus redo-SMVR during the study period
The annual utilisation of ViV-TMVR (ptrend<0.01) increased significantly (5.2% to 36.8%) during the study period (Q4 2015-2019), while the trend of redo-SMVR (ptrend <0.01) procedures decreased from 94.8% in 2015 to 63.2% in 2019 (Figure 4A). Mortality rates decreased for the ViV-TMVR (ptrend =0.01) group from 6.8% in 2016 to 2.0% in 2019 (Figure 4B). Similarly, complication rates also decreased from 59.7% in 2016 to 43.0% in 2019 for ViV-TMVR (ptrend =0.01) (Figure 4C). All-cause 30-day and 6-month readmission rates remained steady for both ViV-TMVR (ptrend =0.79) and redo-SMVR (ptrend =0.47) (Supplementary Figure 1, Supplementary Figure 2). Among the ViV-TMVR group, the utilisation of transseptal (ptrend <0.01) ViV-TMVR increased, whereas the use of the transapical (ptrend <0.01) approach decreased during the study period (Supplementary Figure 3).
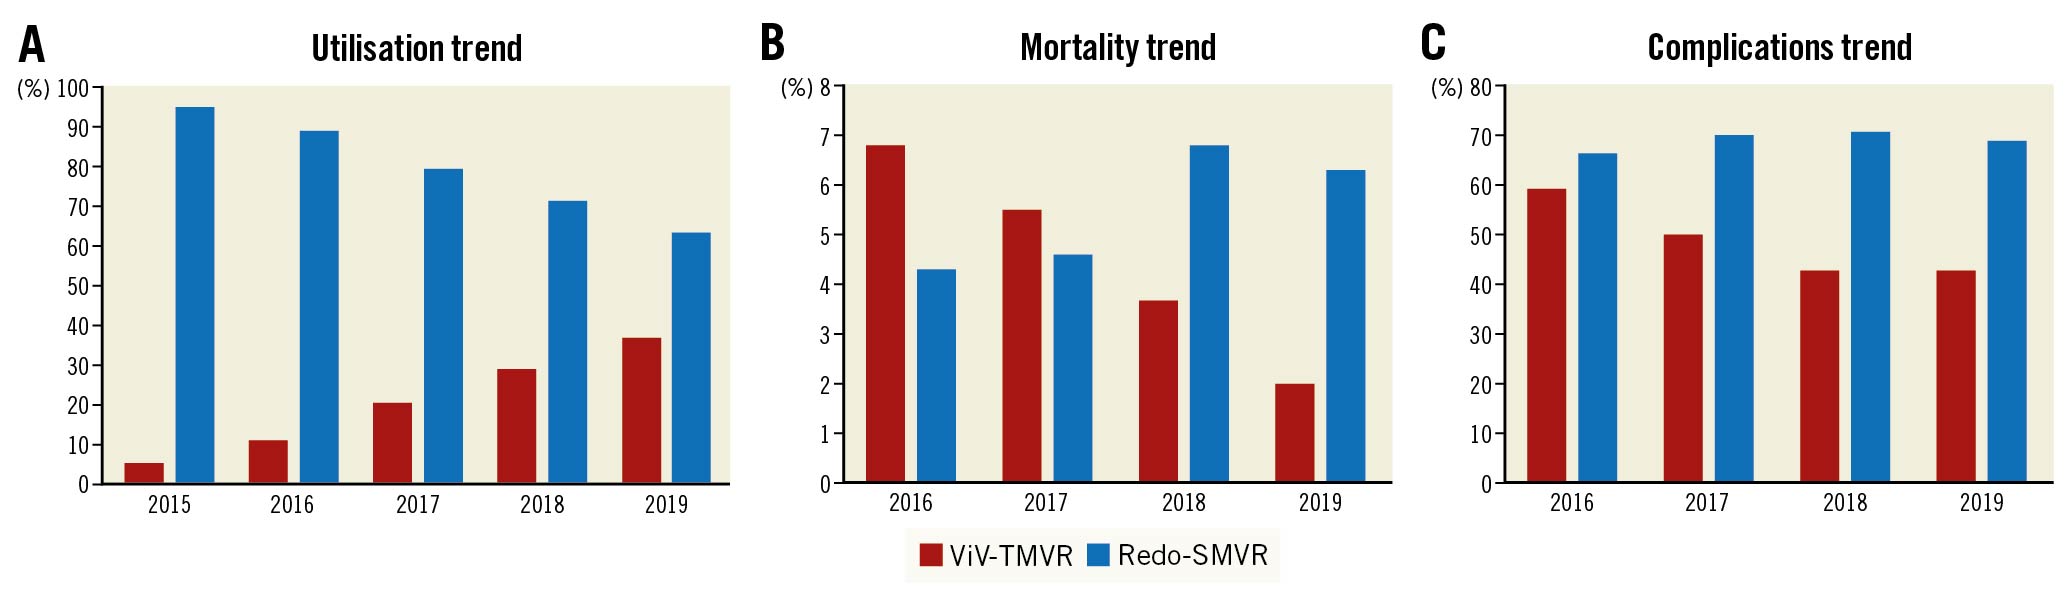
Figure 4. Trends in utilisation, mortality and complications of ViV-TMVR compared with redo-SMVR. A) Utilisation trend. B) Mortality trend. C) Complications trend. Complication rates include a composite of cardiogenic shock, AKI, stroke, vascular complications, bleeding, cardiac arrest, pericardial effusions, need for PPM and infections. AKI: acute kidney injury; PPM: permanent pacemaker; SMVR: surgical mitral valve replacement; ViV-TMVR: valve-in-valve transcatheter mitral valve replacement
Readmission outcomes at 30 days
The mortality rate during the episode of readmission at 30 days (<1.2% vs <1.1%, OR 1.01, 95% CI: 0.40-2.55) and all-cause readmission rates (14.9% vs 13.4%, OR 0.82, 95% CI: 0.66-1.02) were not significantly different in ViV-TMVR compared with redo-SMVR (Figure 5, Figure 6). ViV-TMVR had a similar risk for the need for transfusions, incidence of stroke, vascular complication, and the need for PPM implantation compared with redo-SMVR. In terms of resource utilisation, the readmission length and cost of hospitalisation were also similar for the 2 groups (Table 2). The cumulative incidence of 30-day readmission rates was comparable as shown by the log-rank test (log-rank p-value=0.55) (Table 2, Figure 5).
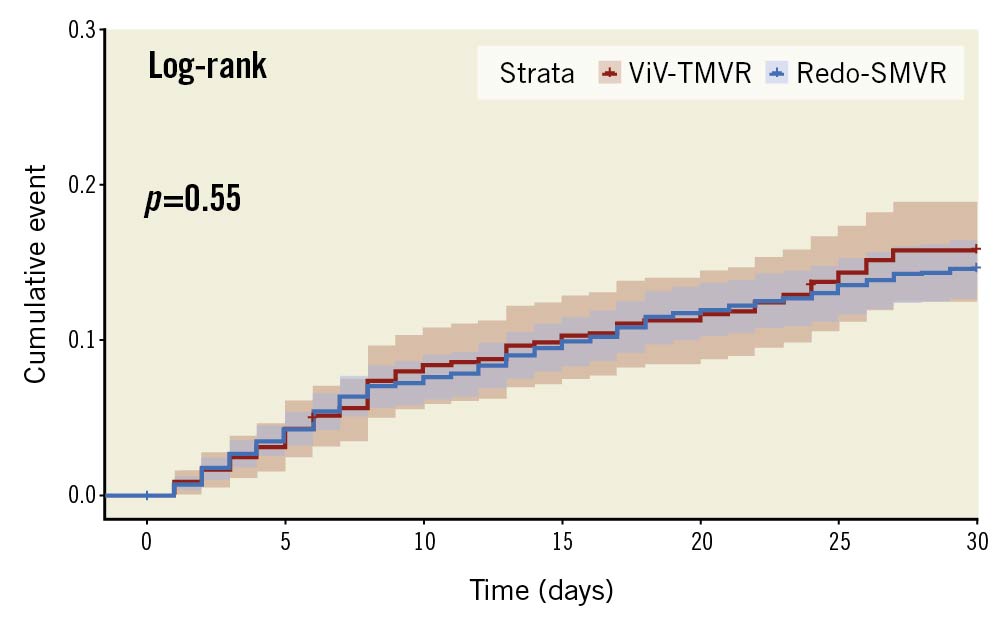
Figure 5. Cumulative incidence of 30-day readmission. SMVR: surgical mitral valve replacement; ViV-TMVR: valve-in-valve transcatheter mitral valve replacement
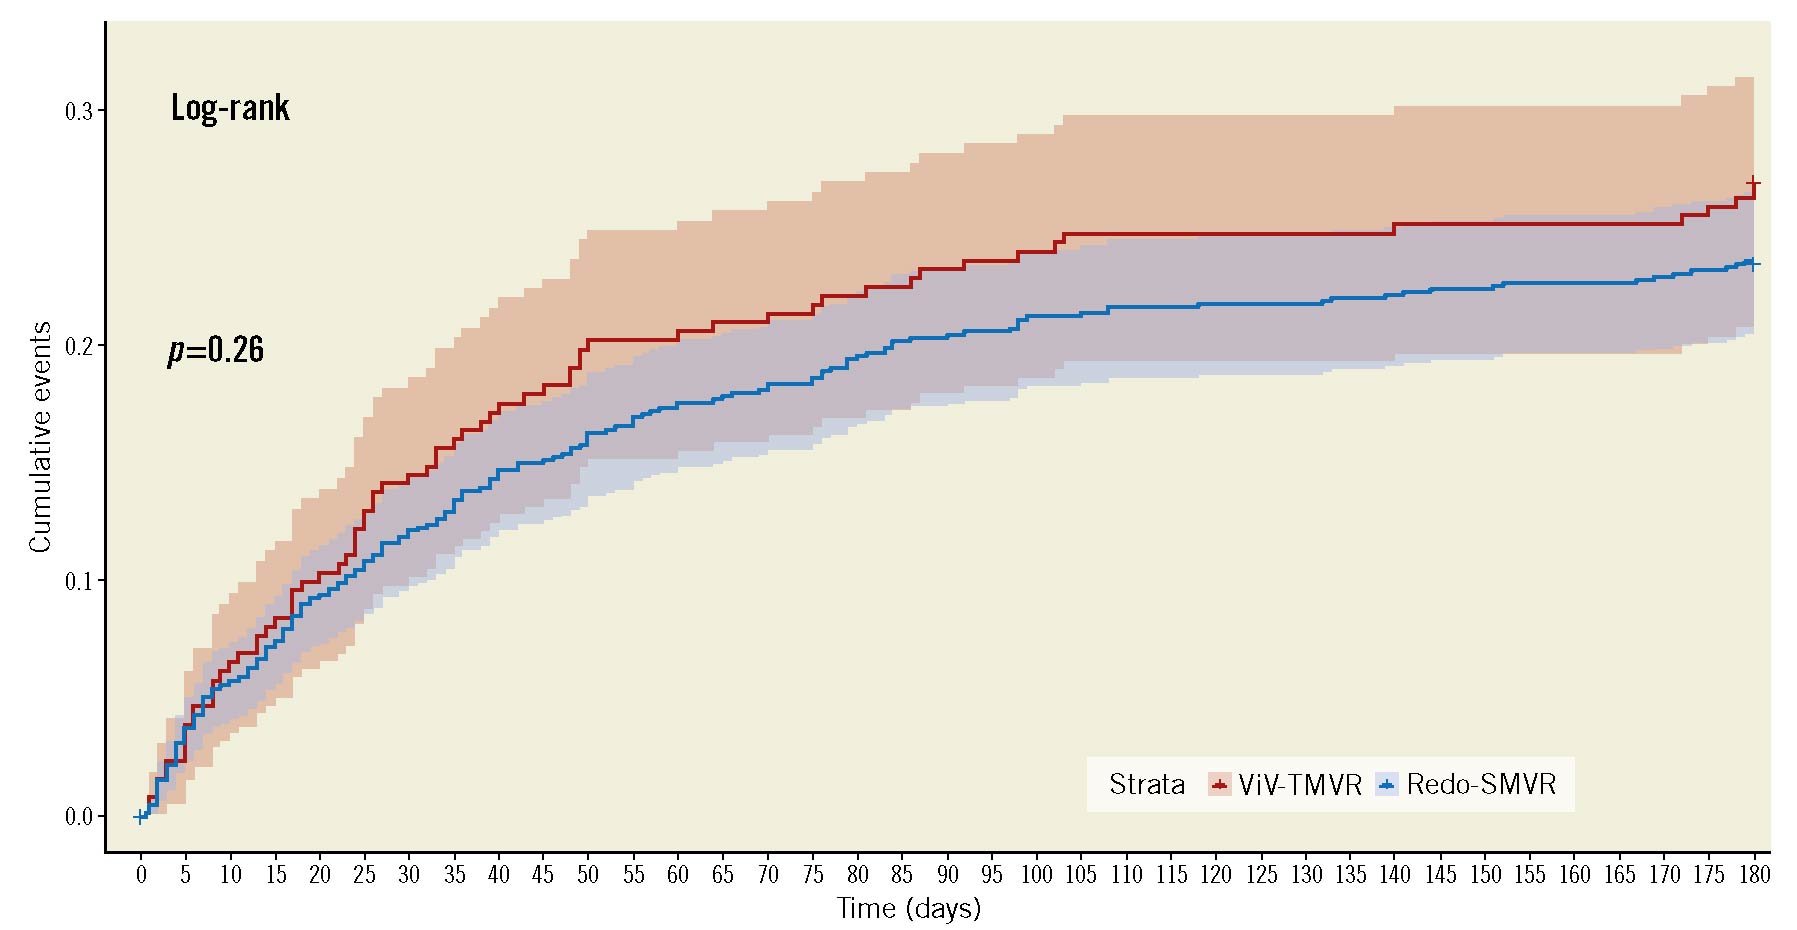
Figure 6. Cumulative incidence of 6-month readmission. SMVR: surgical mitral valve replacement; ViV-TMVR: valve-in-valve transcatheter mitral valve replacement
Readmission outcomes at 6 months
A total of 1,812 index cases and their 6-month readmissions were included in the analysis. Of the included cases, 24.4% underwent ViV-TMVR (n=464) whereas 75.6% had redo-SMVR (n=1,348). After propensity matching, 403 ViV-TMVR cases were matched with 411 redo SMVR procedures. All-cause readmissions at 6 months (30.1% vs 27.5%, OR 0.83, 95% CI: 0.65-1.05) and all-cause readmission mortality (<2.3% vs <2.4%, OR 1.84, 95% CI: 0.54-6.36) remained non-significant between ViV-TMVR and redo-SMVR, respectively. Similarly, there was no difference in terms of the length and cost of hospitalisation. The cumulative incidence of the 6-month readmission was also similar between the 2 groups (log-rank p-value=0.26) (Table 2, Figure 6). The Central illustration provides a graphical summary of our study findings.
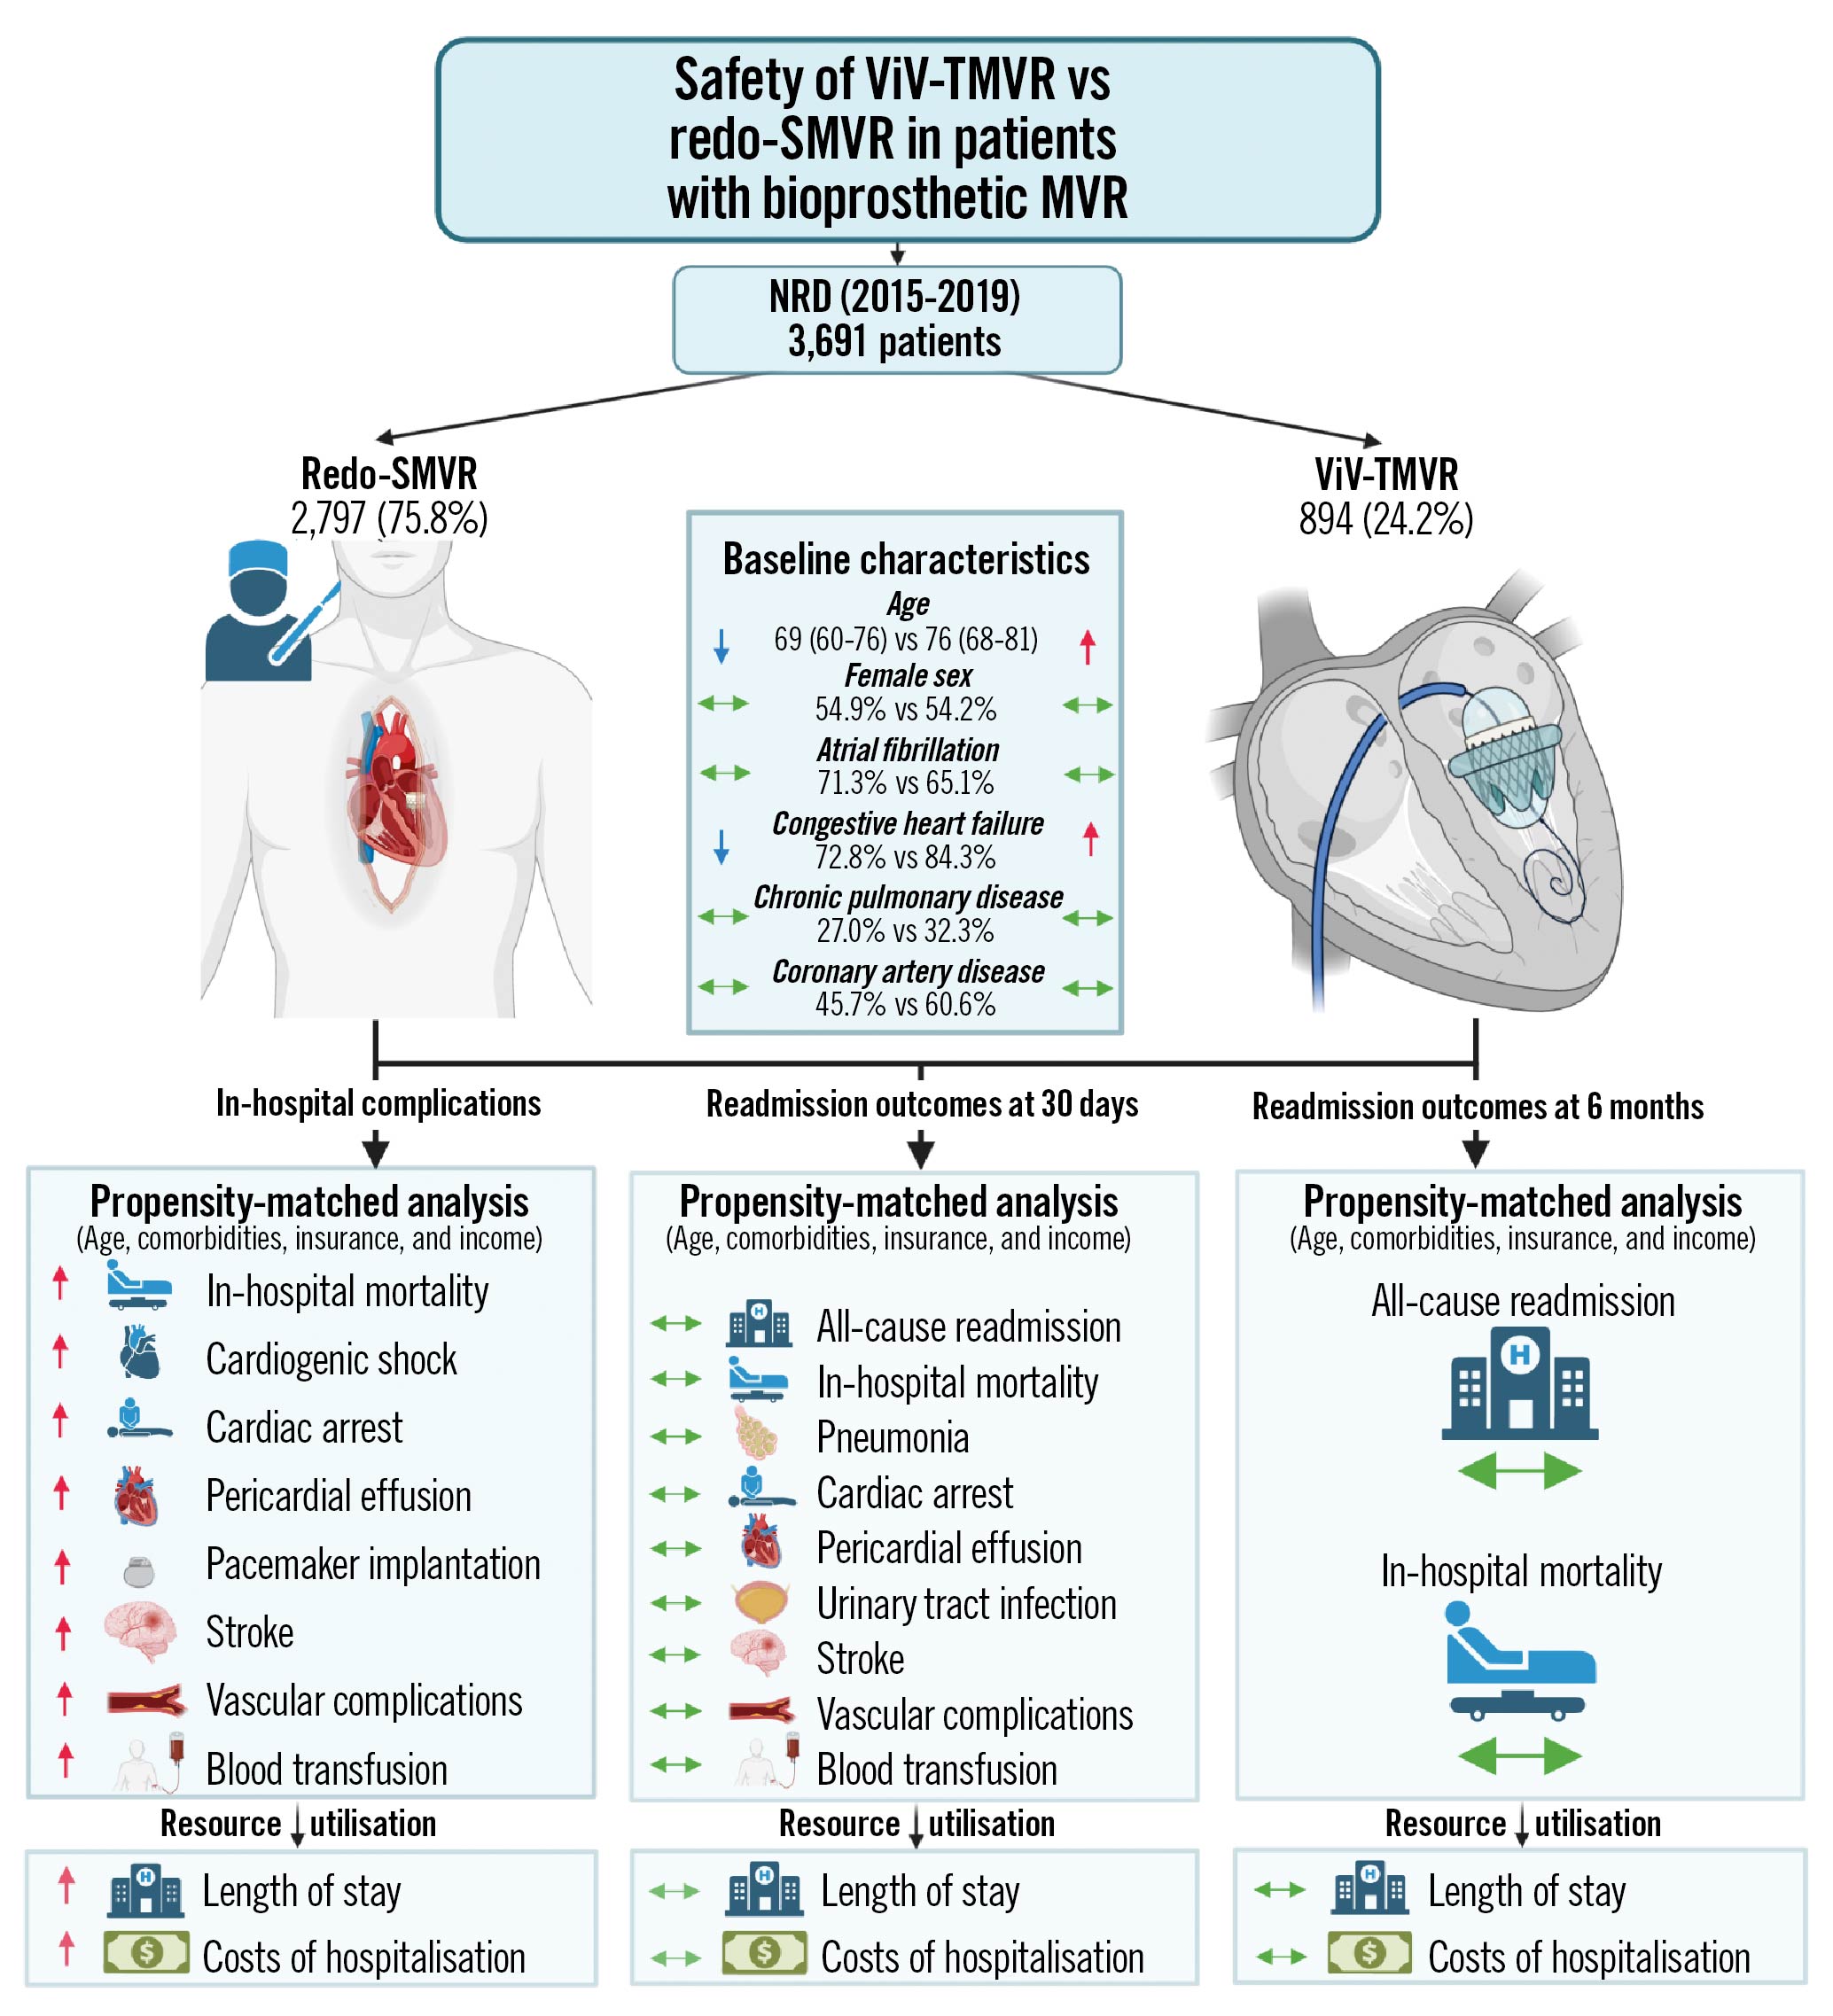
Central illustration. Transcatheter valve-in-valve implantation versus redo surgical mitral valve replacement in patients with failed mitral bioprostheses.
Transseptal and transapical ViV-TMVR versus redo-SMVR for in-hospital outcomes
The baseline characteristics of transseptal and transapical ViV-TMVR compared with redo-SMVR are summarised in Supplementary Table 2 and Supplementary Table 3. The crude mortality rate and the adjusted mortality rate were lower for transseptal ViV-TMVR compared with redo-SMVR. On adjusted analysis, the procedural complication rates of stroke, need for transfusion, vascular complications and need for PPM were lower for the transseptal group (Supplementary Table 4).
There was no difference in terms of unadjusted or adjusted mortality rates or procedural complications for the transapical approach when compared with conventional surgery. PPM implantation rates were lower with the transapical approach when compared with surgery (Supplementary Table 5).
E-value analysis and falsification endpoints
In terms of E-value analysis, the observed effect size for mortality could be explained by unmeasured confounding with an OR of at least 2.7 (in-hospital mortality) and 2.0 (30-day and 6-month readmission mortality) above the measured confounding. Furthermore, there was no significant difference in terms of falsification outcomes during the 30-day and 6-month episode of readmission for hip/femur fracture and acute COPD exacerbation (Table 2).
Discussion
Our contemporary study evaluated the safety of minimally invasive ViV-TMVR compared with redo-SMVR. The principal findings of our adjusted analysis are as follows: 1) the in-hospital odds of all-cause mortality, and post-procedural complications such as vascular complications, stroke, need for transfusions, and need for PPM were significantly higher with redo-SMVR compared with ViV-TMVR at index hospitalisation. 2) Similarly, redo-SMVR appears to be associated with a higher resource utilisation as indicated by a significantly higher mean length of stay, and a greater average cost of hospitalisation. 3) The benefits of ViV-TMVR were attenuated during the episode of 30-day readmission, showing no significant differences in all-cause readmissions, post-procedure stroke, vascular complications, and need for PPM during the episode of readmission. 4) During the 6-month readmission episode, the incidence of mortality and all-cause readmissions remained similar between the 2 groups, indicating a similar safety and efficacy of the transcatheter approach compared with the surgical option. 5) The annual trend of ViV-TMVR utilisation showed an exponential increase peaking at 36.8% in 2019. Furthermore, along with increased utilisation, there was an improvement in ViV-TMVR procedural outcomes, with a decrease in mortality and complication rates over the study duration.
Our study revealed that, despite a higher burden of baseline comorbidities in patients undergoing ViV-TMVR, the crude and adjusted survival rate favoured the ViV-TMVR group. This indicates that redo-SMVR carries inherent risks of periprocedural complications that can translate into high in-hospital mortality. However, as evidenced by the similar outcomes on follow-up data of up to 6 months, the estimates of all-cause mortality and complication rate decreased substantially with time, implying that the periprocedural complications might not have long-term sequelae. Patients who survive the immediate post-operative phase of redo-SMVR might subsequently have similar outcomes. These findings also indicate that, although ViV-TMVR is a novel procedure for degenerated MV and is performed on a sicker population, in terms of efficacy it might be non-inferior to SMVR on follow-up up to 6 months.
The major caveat to these observations is that only patients who were readmitted within this time frame were assessed, and events occurring outside the hospital admission or emergency department (ED) admissions could not be captured. It is important to note that these findings were in contrast to the conclusions of some of the small-scale prior studies. Kamioka et al reported a higher baseline comorbidity burden with higher Society of Thoracic Surgeons (STS) predicted mortality scores in ViV-TMVR, yet the in-hospital mortality rate was comparable between the 2 groups (n=2 deaths, for both groups)16. The study by Murzi et al also showed an increased baseline mean age of ViV-TMVR, and numerically lower mortality rates compared with a surgical approach, but it did not reach the threshold of statistical significance due to a small sample size (n=61)17. Similar findings were echoed by an Italian study comprising 78 procedures18. Nonetheless, the conclusions of a recent meta-analysis and subsequent database studies were in concordance with our study, showing a higher in-hospital mortality compared with ViV-TMVR519. In the context of disputed results of prior studies, our large scale adjusted analysis provides a benchmark against which future studies could be compared.
Our reported estimates of mortality with ViV-TMVR (5.4%) on NRD were closer to those reported by the TVT and TMVR registry study20. The higher in-hospital complication rates with redo-SMVR translate into an increased length of stay and higher adjusted cost of hospitalisation. These findings are in agreement with the prior study by Kamioka et al who reported increased ICU and hospital length of stay with redo-SMVR16. Prior studies have reported a significant risk of PPM implantation with redo-SMVR, whereas ViV-TMVR is associated with a negligible risk2122232425. These findings were complemented by our study which reports a 4-fold higher risk of PPM with a surgical approach compared with catheter-based treatment. The plausible explanation for these findings could be the proximity of the MV and increased chances of injury to the conduction system with an open surgical approach.
Our findings at short-term follow-up validate the results of prior studies. Kamioka et al reported a similar 30-day mortality between ViV-TMVR (3.2%) and redo-SMVR (3.4%)16. Similarly, Simonetta and colleagues also observed no significant difference in the 30-day mortality difference between the 2 treatment strategies (p=0.41)18. However, the application of the individual studies was limited, due to the small sample size, lack of power to detect the primary outcomes, unadjusted analysis, and single-centre experiences.
Our study provides contemporary evidence on the safety of ViV-TMVR compared with redo-SMVR for up to 6 months post-procedure. Additionally, our study provides insights into the yearly utilisation of the ViV-TMVR approach in the USA. We observed that ViV-TMVR utilisation has increased by more than 300% from 2015 to 2019. These findings suggest a trend towards an increased adoption of this technique in the US for degenerated bioprosthetic valves. Moreover, we also report novel findings of improved temporal trends of procedural complication and mortality rates with ViV-TMVR from 2016 to 2019, which have not been explored previously in a US national database.
Limitations
Our study is constrained by the following limitations. As mentioned above, the NRD cannot capture deaths that occur outside of the hospital or out of state, which might have led to an underestimation of the pooled benefits of ViV-TMVR. Moreover, data on medication use, blood chemistry, echocardiographic data such as left ventricular ejection fraction, mode of valve failure, presence of concomitant tricuspid valve disease, and right ventricular systolic pressure and medication use are lacking, precluding our ability to account for its impact on outcomes. Furthermore, though ViV-TMVR may be associated with better short-term outcomes, data on long-term outcomes and durability are lacking. For evaluating 6-month outcomes, more than 50% of the cases had to be excluded to allow for a 6-month readmission analysis. For temporal trends, we had to exclude the fourth quarter of 2015, due to <11 observations for the ViV-TMVR group for mortality and procedural complication. On subset-analysis (transseptal and transapical ViV-TMVR versus redo-SMVR), due to a reduced sample size, 30-day and 6-month readmission outcome analyses could not be performed. Though it was rare, we could not exclude patients who might have had a failed mechanical valve due to a lack of specific ICD codes. In the ViV-TMVR group, only balloon-expandable valves can be used. Furthermore, data on the size and iteration of the device are not available. Certain outcomes such as acute kidney injury were not assessed, as it is not possible to determine if the outcome occurred prior to the procedure or after the procedure. The low sample size on subset-analysis might have been underpowered to detect a statistically significant difference with respect to mortality and complication rates. The NRD is an administrative claims-based database that uses ICD-10-CM codes for diagnosis Although procedural codes are less prone to error, coding errors cannot be completely excluded. The NRD collects data on in-patient discharges, and each admission is registered as an independent event. Like any observational, retrospective study, association does not imply causation and conclusions are hypothesis-generating and should be drawn cautiously.
Conclusions
ViV-TMVR utilisation in patients with degenerated bioprosthetic MV has increased exponentially in recent years. ViV-TMVR is associated with lower in-hospital mortality, periprocedural complications, and resource utilisation compared with redo-SMVR on index hospitalisation. The all-cause readmissions and 30-day and 6-month mortality during the episode of readmissions were comparable between both groups. In addition to the increased utilisation of ViV-TMVR, procedural outcomes have also improved with time. Future large-scale, controlled studies are needed to confirm these findings and to evaluate the long-term outcomes and durability of ViV-TMVR.
Impact on daily practice
The current guidelines approved the use of ViV-TMVR as an alternative to surgery, especially in patients who are at high surgical risk and have a failed bioprosthetic mitral valve. Based on our findings, the redo-SMVR is associated with increased periprocedural complications and increased resource utilisation including costs and length of hospitalisation. However, there are no differences in terms of 30-day and 6-month outcomes during the episode of readmission. In the absence of randomised trials, our study findings provide initial data supporting the safety of ViV-TMVR for patients with prohibitive surgical risk. The current data can also aid in shared decision-making between the patient and the Heart Team.
Conflict of interest statement
The authors have no conflicts of interest to declare.
Supplementary data
To read the full content of this article, please download the PDF.