Historically, mankind has been fascinated by the “magic” of using a mathematical formula to predict the likelihood of a future event, namely its probability. Risk scores have been created to anticipate a potential outcome given a set of measurable attributes called random variables. Thus, well-established areas of science have aimed to assess the risk of a future outcome by, in general, categorising it into low, medium, or high-risk at the present time. Notably, in the field of business, the risk metrics have gained special attention as decision-making tools to profile the financial risks attached to individuals as well as companies.
Although efficient, credit risk modelling of one company, given the probability of bankruptcy of another, remained a drawback until a paper by Li entitled “On Default Correlation: A Copula Function Approach”1 proposed a magical formula curiously based on the broken-heart effect in actuarial calculus. This mathematical notation emerged as a breakthrough solution in econometrics. Li was aware that this solution could oversimplify reality, but many businessmen lacked his acumen and extended credit and loans beyond the market limit. The result was the world economy’s second biggest disaster after the Great Depression, leading to the global consequences still being felt today2.
In medicine, we have observed a similarly radical transformation with the increasing tendency of practitioners to abandon a thoughtful clinical judgement in favour of calculators and risk scores3. Part of this transformation hinges on the current technological options for the collection and management of the data. Certainly, the multifactorial nature of most conditions and diseases can make the process of risk assessment too complex for the human mind, and may even be too difficult a task for different artificial intelligence algorithms such as neural networks4. On the one hand, risk scores circumvent this complexity by synthesising information and weighting numerous variables describing a particular event, thereby enabling a quantitative perspective on the clinical decision-making process. However, such risk scores are exclusively based on measurable variables and are often restricted to inclusion and exclusion criteria that may lead to essential information being disregarded.
Despite such misgivings, the medical literature is full of risk scores relating to in-hospital and office patient care5-8. Some of these are valuable decision-making tools, such as the “SYNergy between percutaneous intervention with TAXus drug-eluting stents and cardiac surgery (SYNTAX)” score6 which has been incorporated into practice guidelines9. However, other proposed scoring systems have either not achieved clinical relevance or lack consistency. Although the number of variables collected and participants assessed in the studies has increased exponentially over time, the accuracy of some current medical risk scores remains disappointing. In other words, a data-rich theory-free environment is not the only prerequisite for the development of a clinically meaningful risk score. Thus, physicians need to recognise the method used to create a specific scoring system and to be acutely aware of its limitations when applying it in daily clinical practice.
Often, the outcome of the majority of scoring models is binary and follows a binomial distribution. The underlying methodology comes from either the generalised linear or the semi-parametric proportional hazard survival model. Both logistic regression and Cox regression equations aim to estimate the parameters (β) from which the scores are derived. The parameters are estimated from the maximum likelihood in the logistic regression and from the partial maximum likelihood function (accommodates missing and censored data) in Cox regression, respectively. In other words, the estimates (x-axis) are the values for β that maximise a given event probability (y-axis) by achieving the critical point (maximum and minimum) of the functions. These concepts explain why a given risk score can easily overestimate the probability of an event. A recent example was the issue of the novel cardiovascular risk calculator to guide cholesterol-lowering therapy, which was embroiled in controversy due to risk overestimation.
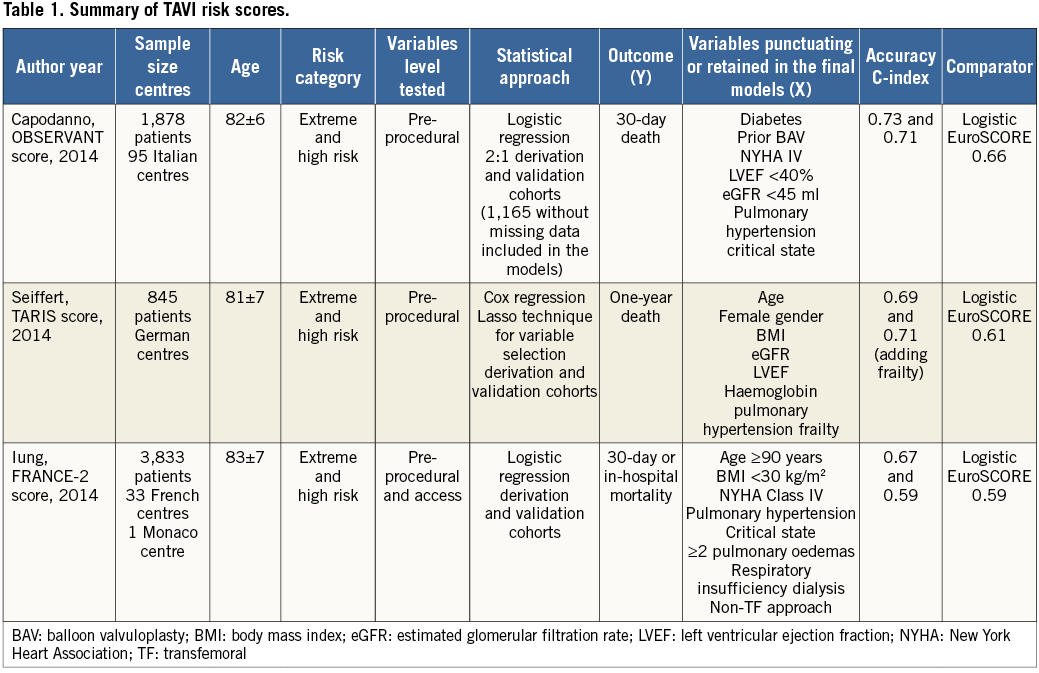
The “new kid on the block” is the transcatheter aortic valve implantation (TAVI) mortality risk score. Investigators with powerful databases have already started to pursue a TAVI mortality risk, as summarised in Table 1. However, the accuracy obtained was only modest, ranging from 0.59 to 0.71 (validation cohorts)10-12. Although not surprising, the variables punctuating these models are well known to both the clinician and the statistician to be predictive of death, irrespective of the cardiovascular procedure being performed, for example, pulmonary oedema, critical perioperative state, low body mass index, renal failure, left ventricular systolic dysfunction, pulmonary hypertension, and advanced heart failure. Thus, at this point we may pose the following questions. 1) Why is the accuracy of TAVI mortality scores modest at best? 2) Should these scores be used to aid in the clinical decision-making process? 3) Do these scores shed light on the risk assessment of a population already defined as high risk?

From a statistical modelling perspective, it is intuitive that we want to observe as much y-axis variation as possible (probability of event) depending on the parameters. Although expected, the surgical risk scores (The Logistic European System for Cardiac Operative Risk Evaluation I and II, Society of Thoracic Surgeons) have proven to be inefficient in determining the mortality risk of the TAVI population13. What comes as a surprise, however, is the poor performance overall and comparatively modest accuracy of these dedicated scores, despite the involvement of different centres using different statistical approaches and databases. The heterogeneity of the TAVI population is frequently indicated as one of the reasons why the mortality risk assessment is challenging. However, we have been collecting almost the same variables in the same way for decades and, as a consequence, have developed homogeneous data sets with limited variance/covariance. This perhaps explains the similarities and the low to modest accuracy level of these initial TAVI mortality multidimensional matrices. Another possible explanation is overdispersion resulting from the collection of inadequate explanatory variables for a particular outcome14. Nevertheless, it should be pointed out that, despite testing fifty-six and retaining nine variables, the FRANCE-2 risk model obtained at most a modest accuracy for predicting one-year mortality11. This indicates that the classic variables being collected may not suffice to explain the TAVI mortality fully.
Although ideally a risk score should be user-friendly to be widely adopted, the proposed TAVI scores may have oversimplified the risk assessment. First, the patient selection for TAVI is a complex, multistep approach, sometimes involving unmeasured variables collectively called an “eyeball test”, which uses a physician’s learning experience to determine a particular patient’s risk. The data currently collected do not capture these a priori risk estimates. Second, frailty has been increasingly recognised as a determinant of poor outcome, but its measurement and incorporation have been difficult in the TAVI risk assessment. Interestingly, the German scoring system showed a significant improvement in accuracy following the inclusion of frailty data into the model13, hence indicating that this variable needs to be further refined and somehow combined with other pre-procedural variables into TAVI risk assessment models. Third, the lack of procedural level data in these scores can be viewed as a limitation, in particular for those assessing early mortality; however, it should be highlighted that it is the a priori clinical complexity that causes the higher procedural risk.
At the same time, the pre-procedural variables assessed in these scores are established risk factors for any given cardiovascular procedure and would not be different among patients undergoing TAVI. Moreover, these variables are non-modifiable and inherent to this specific population, which limits the preventive actions except for declining a potentially futile procedure for extreme-risk candidates15. Thus, although the value of the aforementioned risk scores for experienced clinicians and operators managing TAVI patients on a daily basis is very limited in their intended role of predicting mortality risk, they can be helpful in the decision-making process of this complex population with no other treatment alternatives. On the other hand, it is reasonable to expect that any risk score developed and validated in a TAVI population (already categorised as high-risk or non-surgical candidates) would outperform a risk score developed and validated for surgical candidates. Moreover, as TAVI expands its indication to other patient risk strata and the procedure and technology evolve, the validation of these risk scores needs to be re-evaluated.
We commend Seiffert et al10, the FRANCE 2 Investigators11 and the OBSERVANT Research Group12 for their effort and for providing the evidence that even now, with the sophisticated statistical tools currently available, the development of an efficient and robust TAVI mortality risk score formula still seems to be distant. Furthermore, physicians need to be aware of the limitations of applying risk scores in medical practice, where clinical judgement should prevail. Thus, as Li mentioned in later interviews about the failure of his own “magical” risk formula, “The worst part is when people believe everything coming out of it”.
Conflict of interest statement
A. Pichard is a proctor for Edwards Lifesciences. M. Magalhaes and S. Minha have no conflicts of interest to declare.

