Introduction
Multivariable statistical analyses are frequently used today and commonly appear in the medical literature. The results are often expressed in statements such as “After adjustment for other baseline characteristics, the use of DES was associated with 21% reduction of restenosis as compared with BMS”. Among other applications, multivariable methods such as logistic regression and Cox proportional hazard regression are often used to adjust a “target” parameter for differences in baseline characteristics (or variables), to search for predictors for adverse cardiac outcome or to develop risk prediction models. The primary advantage of multivariable analyses is the possibility to adjust for multiple variables simultaneously.
The increased use of multivariable methods does not automatically imply that these analyses are well conducted. Many studies report incorrect application of these methods. Incorrect conclusions may result if methodological guidelines and mathematical assumptions are ignored. In the current paper, we address an important issue that is often neglected, i.e., the number of variables which are allowed in multivariable regression models.
Points of attention in multivariable analysis are the total number of patients and the number of outcome events in the patient population used to perform the analysis. Although the total number of patients enrolled in a study is always important to know, the statistical strength of a multivariable analysis is driven by the number of events. Many studies have applied multivariable analyses using only a small number of events, forgetting the golden rule: if there are no or almost no events, there is nothing to predict or to investigate.
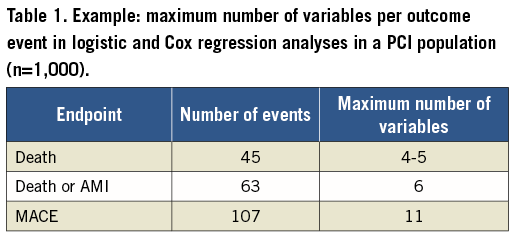
In addition to the above, one of the major pitfalls of multivariable models is the number of variables (variable of interest as well as variables such as age, gender, diabetes, prior MI, etc.) analysed in the model. In statistical packages such as SPSS, SAS and STATA, no restrictions exist on the number of variables to be entered in the model, and no warnings are given if too many variables are used. Multivariable methods render incorrect results if an insufficient number of outcome events (such as death or major adverse cardiac events [MACE]) are available relative to the number of variables analysed in the model1, or in other words if the ratio of events per variable (EPV) is too small. For example, if, in a cohort of 1,000 patients, nine variables are examined in relation to 45 deaths, the EPV = 45/9=5. In multivariable models, an EPV which is too small affects the accuracy (risk estimates) and precision (95% confidence intervals) of odds or hazard ratios of the variables, which may result in misleading findings2. The consequence might be an incorrect significant association between the variable and outcome event (type I error), or on the other hand an incorrect lack of association between a variable and the outcome event (type II error).
On theoretical grounds, Harrell et al suggested a minimum of 10 to 20 EPV2. Peduzzi et al performed a simulation study, and suggested that at least 10 EPV are needed to maintain the validity of the model3. Both found that, with decreasing EPV, the bias of the odds or hazard ratios increased (Table 1).

If one is interested in the relation between a specific variable of interest (e.g., DES versus BMS) and an outcome event (e.g., MACE), then a propensity score might be a good alternative to adjust for confounders in case <10 EPVs are present4,5. The propensity score can be calculated in a separate logistic regression analysis. In brief, it consists of entering the baseline characteristics into a logistic model while using the variable to be compared (in our example DES vs. BMS) as the “outcome event”. As a result, for every patient a probability (propensity) to have a DES or BMS stent type can be determined, based on his/her individual characteristics. This “summary” or propensity score - which is in fact one variable representing a larger number of baseline characteristics - can then be entered into a logistic or Cox model that also contains the variable of interest (DES vs. BMS) and that examines the real outcome event (e.g., MACE). The propensity score will be addressed in detail in the current series of papers in the future.
Conclusion
In conclusion, the validity of multivariable logistic or Cox regression analyses becomes problematic when there are too few events and the number of events per variable becomes less than 10. The odds ratios and hazard ratios may be biased and their 95% confidence intervals may not be reliable. We recommend at least 10 EPV when performing multivariable analyses.
Conflict of interest statement
The authors have no conflicts of interest to declare.

