Abstract
Background: Coronary microvascular dysfunction (CMD) leads to inadequate myocardial perfusion in patients with ST-segment elevation myocardial infarction (STEMI) undergoing primary percutaneous coronary intervention (PPCI). The index of microcirculatory resistance (IMR) is an intraoperative diagnostic tool for CMD. However, its widespread application is hindered by the requirement for pressure wires and hyperaemic agents. The angiographic microcirculatory resistance (AMR) index is concise, convenient, accurate, and serves as a pressure wire-free alternative to the IMR.
Aims: This study aimed to demonstrate the ability of AMR to detect CMD in patients with STEMI undergoing PPCI therapy and to assess its predictive value for long-term prognosis.
Methods: The EARLY-MYO-AMR trial comprised two cohorts. The derivation cohort included 495 patients with STEMI who underwent PPCI within 12 h and cardiac magnetic resonance (CMR) within 14 days of symptom onset. The optimal AMR cutoff value for diagnosing CMD using CMR was determined by analysing the receiver operating characteristic curves. The validation cohort enrolled 2,663 patients with STEMI who underwent PPCI within 12 h of symptom onset from January 2012 to April 2022 across 5 medical centres. All patients were followed up for at least 1 year. The primary endpoint was the occurrence of major adverse cardiovascular events (MACE), including cardiac death, hospitalisation for heart failure, repeat myocardial infarction, and target lesion revascularisation.
Results: The derivation cohort identified an AMR cutoff >26.6 mmHg*s/dm for predicting CMD post-PPCI (area under the curve 0.721, 95% confidence interval [CI]: 0.677-0.763). Multivariable logistic regression analysis indicated that AMR >26.6 mmHg*s/dm was a CMD risk factor (odds ratio 4.10, 95% CI: 2.56-6.56; p<0.001). The MACE incidence was significantly higher among patients in the validation cohort with AMR >26.6 mmHg*s/dm than among those with AMR ≤26.6 mmHg*s/dm (30.9% vs 21.5%, adjusted hazard ratio [HR] 1.47, 95% CI: 1.20-1.80; p<0.001). MACE incidence increased with AMR, with an adjusted HR of 1.30 (95% CI: 1.17-1.46; p<0.001) per 10 mmHg*s/dm increase. The Bland-Altman and Kappa analyses showed good intra- and interobserver agreement for AMR (intraobserver: bias=–0.104, k=0.914; interobserver: bias=–0.032, k=0.958).
Conclusions: AMR >26.6 mmHg*s/dm predicts CMD during PPCI and increased MACE incidence in patients with STEMI. This convenient tool helps in risk stratification and treatment guidance for STEMI prognosis.
The goal of primary percutaneous coronary intervention (PPCI) is to restore blood flow in the epicardial vessels and achieve effective myocardial perfusion at the tissue level in patients with ST-segment elevation myocardial infarction (STEMI). Coronary microvascular dysfunction (CMD) is an important factor affecting myocardial perfusion in patients with acute STEMI undergoing PPCI1. The index of microcirculatory resistance (IMR) is currently the most commonly used method for intraoperative diagnosis of CMD2. Numerous studies have demonstrated that a high IMR during PPCI is associated with a poor prognosis345. However, the measurement of the IMR involves invasive procedures, cumbersome steps, and the need for a pressure wire, which has prevented its widespread adoption as a routine procedure globally and has resulted in many patients with CMD being overlooked. Therefore, a more concise, convenient, and sufficiently accurate method to replace the IMR and improve this situation is needed. In recent years, some microcirculation indices based on angiographic images and calculated using the quantitative flow ratio (QFR) have been explored6789, though they all have certain computational limitations, especially regarding vessel bifurcations10. Recently, μQFR, based on the single-view Murray’s Law, has been developed, and its derived parameter − angiographic microcirculatory resistance (AMR) − has been validated in patients with acute (ACS) and chronic coronary syndromes (CCS)11. The AMR is an ideal intraoperative tool for assessing CMD in patients with STEMI. However, no large-sample studies have verified the predictive role of AMR for the prognosis of patients with STEMI. Thus, we designed this study to validate the association between AMR and CMD in STEMI patients after PPCI and to assess the predictive value of AMR for long-term prognosis.
Methods
Study design and population
The EARLY-MYO-AMR study (ClinicalTrials.gov: NCT05653765) conformed with the Declaration of Helsinki and was approved by the ethics committee of each participating hospital. Given the retrospective nature of this study, and with approval from the ethics committees of the respective centres, all patients in the EARLY-MYO-AMR study were exempt from providing written informed consent.
This study included derivation and validation cohorts (Central illustration). Derivation cohort data were obtained from 495 patients enrolled in the EARLY-MYO-CMR study12 (ClinicalTrials.gov: NCT03768453). The validation cohort, also retrospective, included 2,663 patients who underwent PPCI for STEMI between January 2012 and April 2022 at 5 medical centres: Fuwai Central China Cardiovascular Hospital; Renji Hospital, affiliated with Shanghai Jiao Tong University School of Medicine; First Affiliated Hospital of Xinxiang Medical University; Shangqiu First People’s Hospital; and Yongcheng Central Hospital. All patients were followed for at least 12 months, with a median follow-up period of 44 months.
The inclusion criteria were as follows: (1) clinically diagnosed STEMI patients who underwent PPCI within 12 hours of symptom onset; (2) culprit vessel diameter ≥2.5 mm.
Conversely, the exclusion criteria were defined as follows: (1) poor image quality or extreme vessel tortuosity that prevented accurate lesion analysis; (2) inability to identify the culprit vessel; (3) post-PPCI QFR ≤0.80 in the culprit vessel; (4) concomitant dilated cardiomyopathy or severe structural heart disease, such as moderate to severe aortic stenosis/insufficiency, mitral stenosis/insufficiency, congenital ventricular septal defects; (5) absence of dual antiplatelet therapy post-PPCI; (6) post-PPCI Thrombolysis in Myocardial Infarction (TIMI) flow grade 0-1; (7) haemodynamic instability requiring mechanical support after PPCI; (8) history of coronary artery bypass grafting; (9) incomplete clinical data; or (10) loss to follow-up.
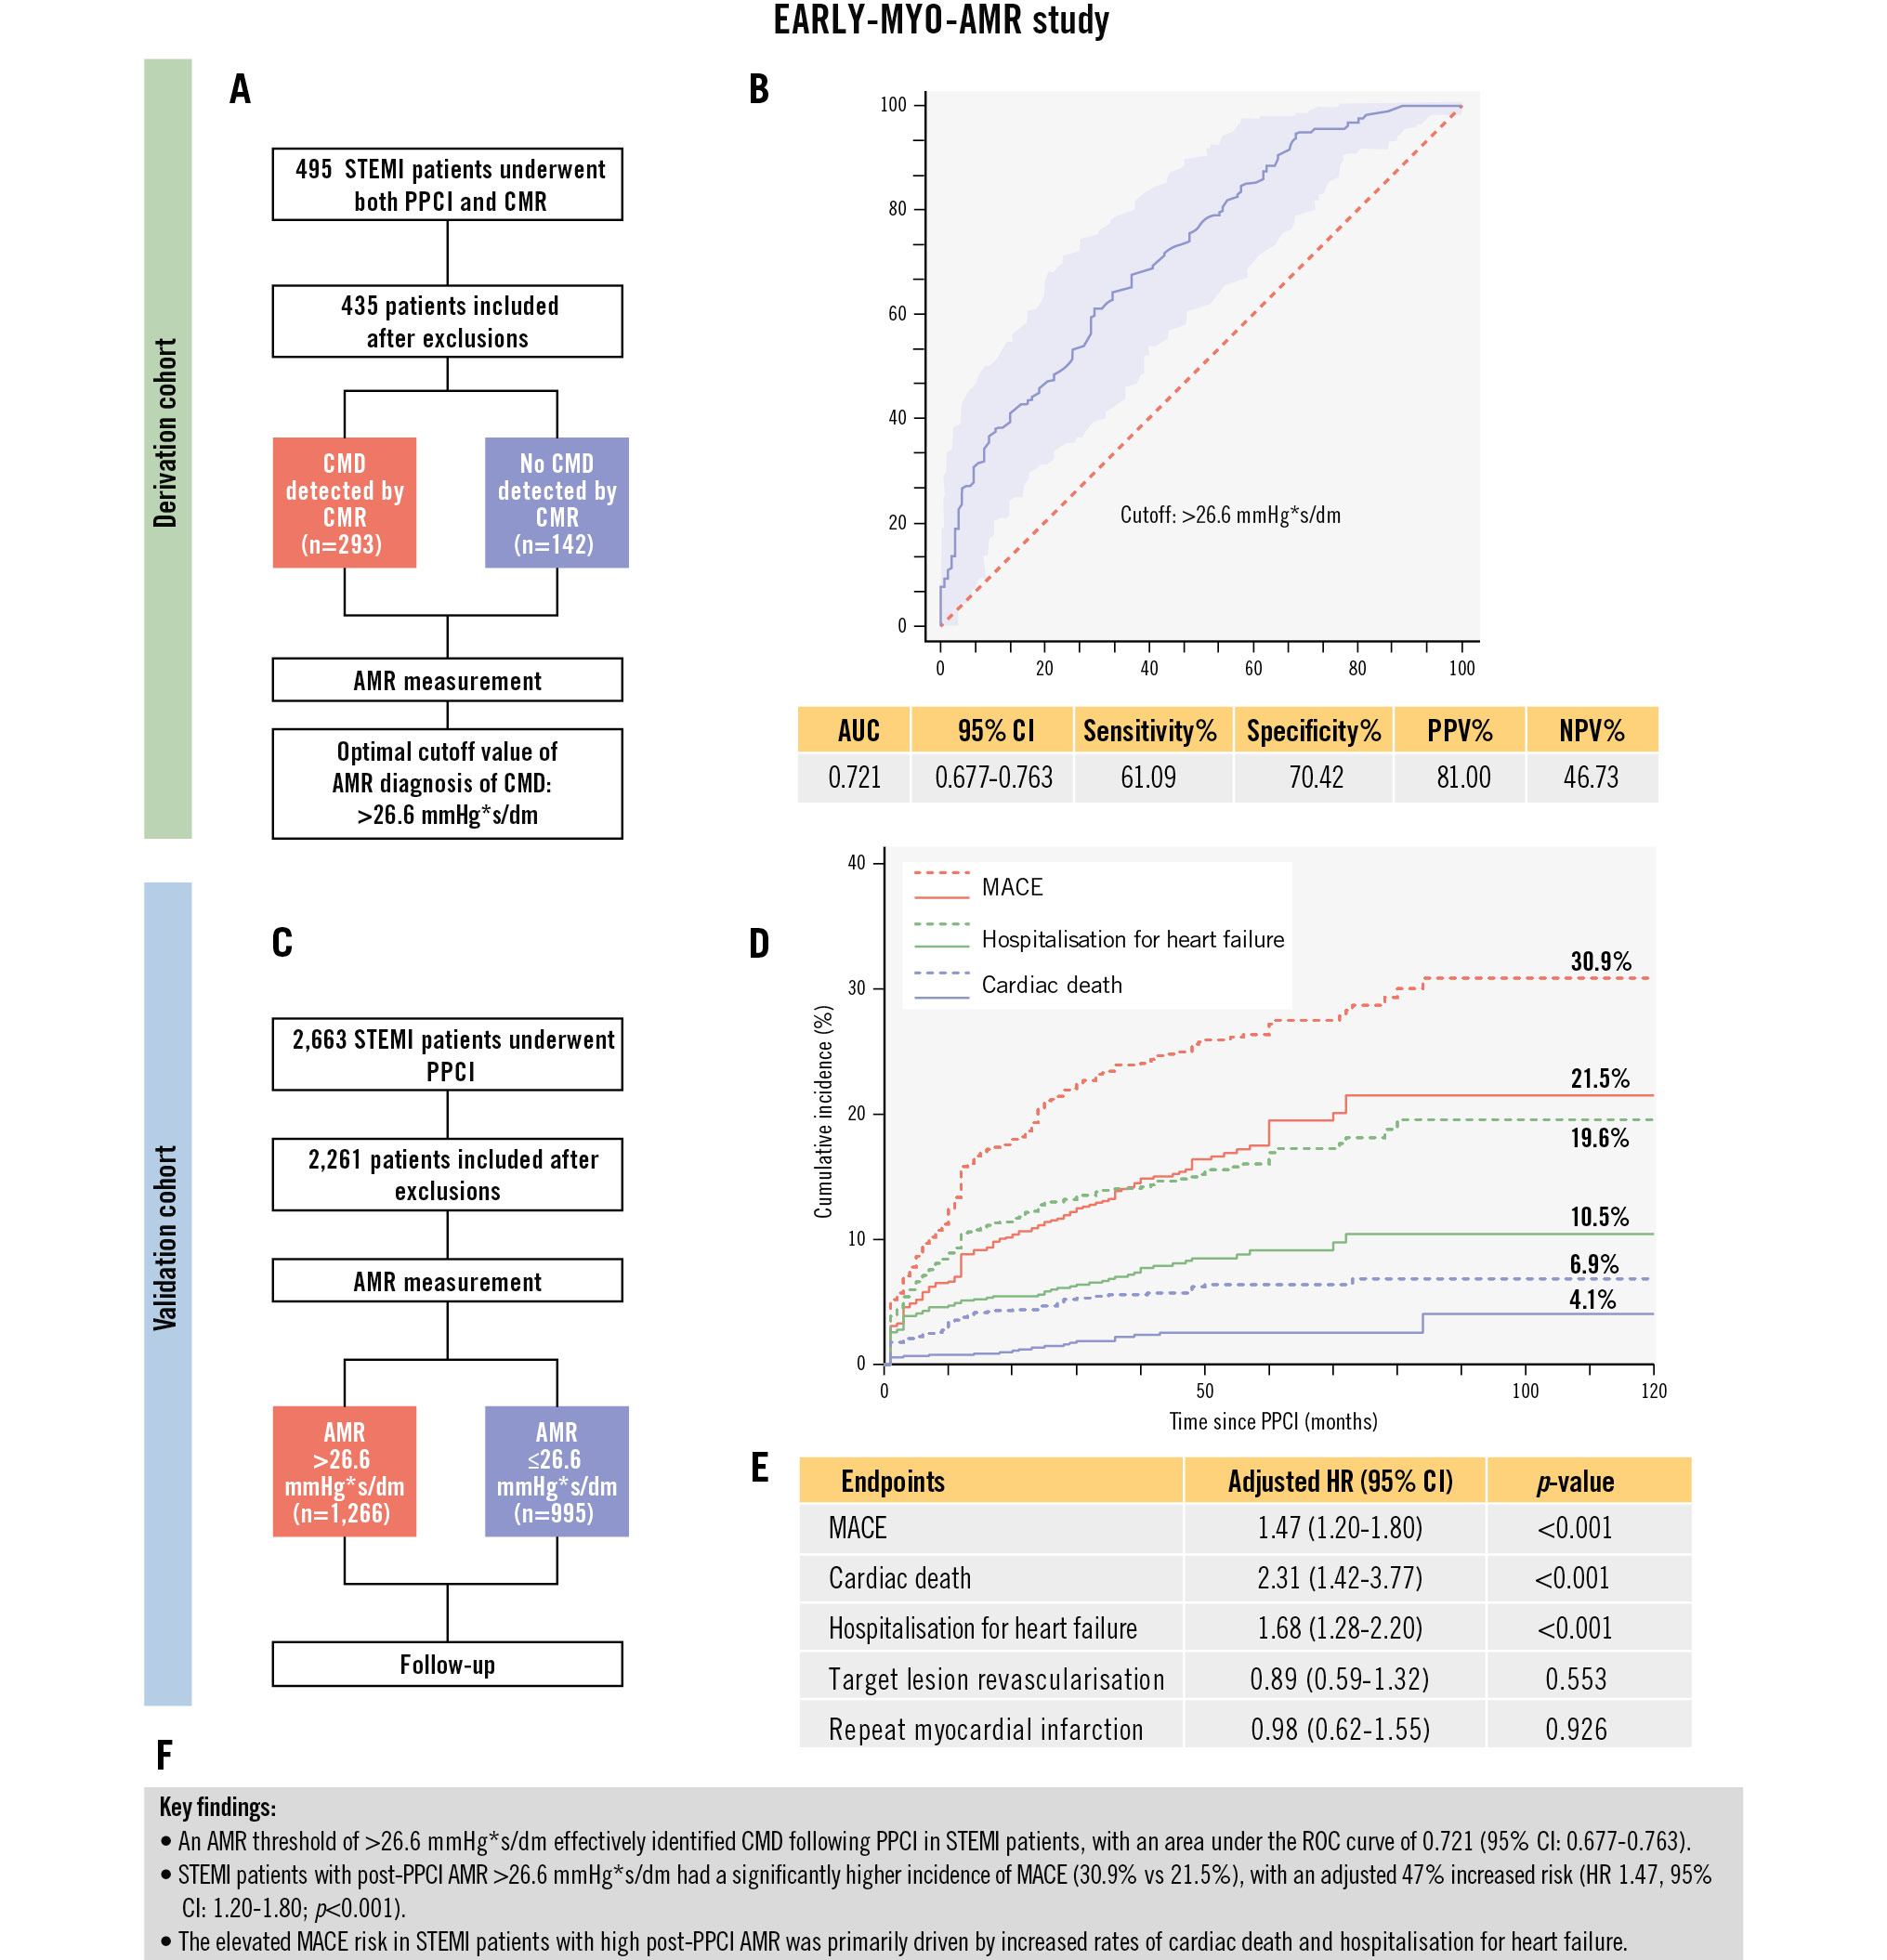
Central illustration. Study flowchart and key findings of the EARLY-MYO-AMR study. A) Study flowchart of the derivation cohort. B) ROC curve analysis of AMR for the diagnosis of CMD. C) Study flowchart of the validation cohort. D) Kaplan-Meier curves for MACE and its two major contributors. Red represents MACE, green represents hospitalisation for heart failure, and blue represents cardiac death; all solid lines correspond to the AMR ≤26.6 mmHg*s/dm group and dashed lines to the AMR >26.6 mmHg*s/dm group. E) Adjusted hazard ratios for MACE and its individual components. F) Key findings. AMR: angiographic microcirculatory resistance; AUC: area under the curve; CI: confidence interval; CMD: coronary microvascular dysfunction; CMR: cardiac magnetic resonance; HR: hazard ratio; MACE: major adverse cardiovascular events; NPV: negative predictive value; PPCI: primary percutaneous coronary intervention; PPV: positive predictive value; ROC: receiver operating characteristic; STEMI: ST-segment elevation myocardial infarction
Clinical follow-up
The primary clinical outcome of this study was the occurrence of major adverse cardiovascular events (MACE), defined as a composite of cardiac death, hospitalisation for heart failure, target lesion revascularisation (TLR), and repeat myocardial infarction (MI). The secondary endpoint events included the components of the primary endpoint and all-cause mortality. All deaths were considered cardiac, unless there was a clear alternative cause. Hospitalisation for heart failure was defined as admission due to new or worsening signs and symptoms of heart failure, together with non-invasive imaging findings or elevated B-type natriuretic peptide (BNP) and/or N-terminal proBNP concentration and a discharge diagnosis of heart failure. Repeat MI was defined according to the Academic Research Consortium-2 Consensus Document13, which includes elevated markers of myocardial injury along with ischaemic evidence after PPCI. TLR was defined as new stenosis that developed within previously treated coronary segments and within 5 mm of their borders, with corresponding evidence of ischaemia and subsequent treatment by repeat percutaneous coronary intervention (PCI) or coronary artery bypass grafting (CABG). The detailed event definitions are provided in Supplementary Appendix 1. Follow-up was conducted through clinic visits, telephone contacts, and medical record reviews. All events were resolved by the Clinical Endpoint Committee, which was blinded to the groups.
Cardiac magnetic resonance imaging
Cardiac magnetic resonance (CMR) imaging was used to assess the myocardium within 14 days of symptom onset, following the protocol outlined in our previous studies912. The presence of myocardial microvascular obstruction (MVO) or intramyocardial haemorrhage (IMH) detected by CMR indicates coexisting CMD in a patient14. See Supplementary Appendix 1 for detailed CMR protocols.
AMR measurement
The final sequence of the eligible angiographic images of the culprit vessel during PPCI was selected, and nitrates were given intracoronarily before angiography to avoid epicardial vasospasm affecting the results of the analysis. Certified analysts with extensive experience performed AMR measurements at a core laboratory using the AngioPlus system (Pulse Medical); they were blinded to the patient grouping, treatment, and clinical outcomes. The detailed measurement methods are described elsewhere11. Briefly, images were imported into the software, which automatically outlined vessel contours, including vessel length and branches. The length of the vessel’s centreline, divided by the time required for contrast agent filling, provided the contrast flow velocity, which was then converted to hyperaemic flow velocity. The reference vessel diameter was then reconstructed based on the Murray bifurcation fractal law, and the AMR was calculated using the following formula15, in which Pd is distal coronary artery pressure and Pa is aortic pressure (Figure 1): (Formule_1)
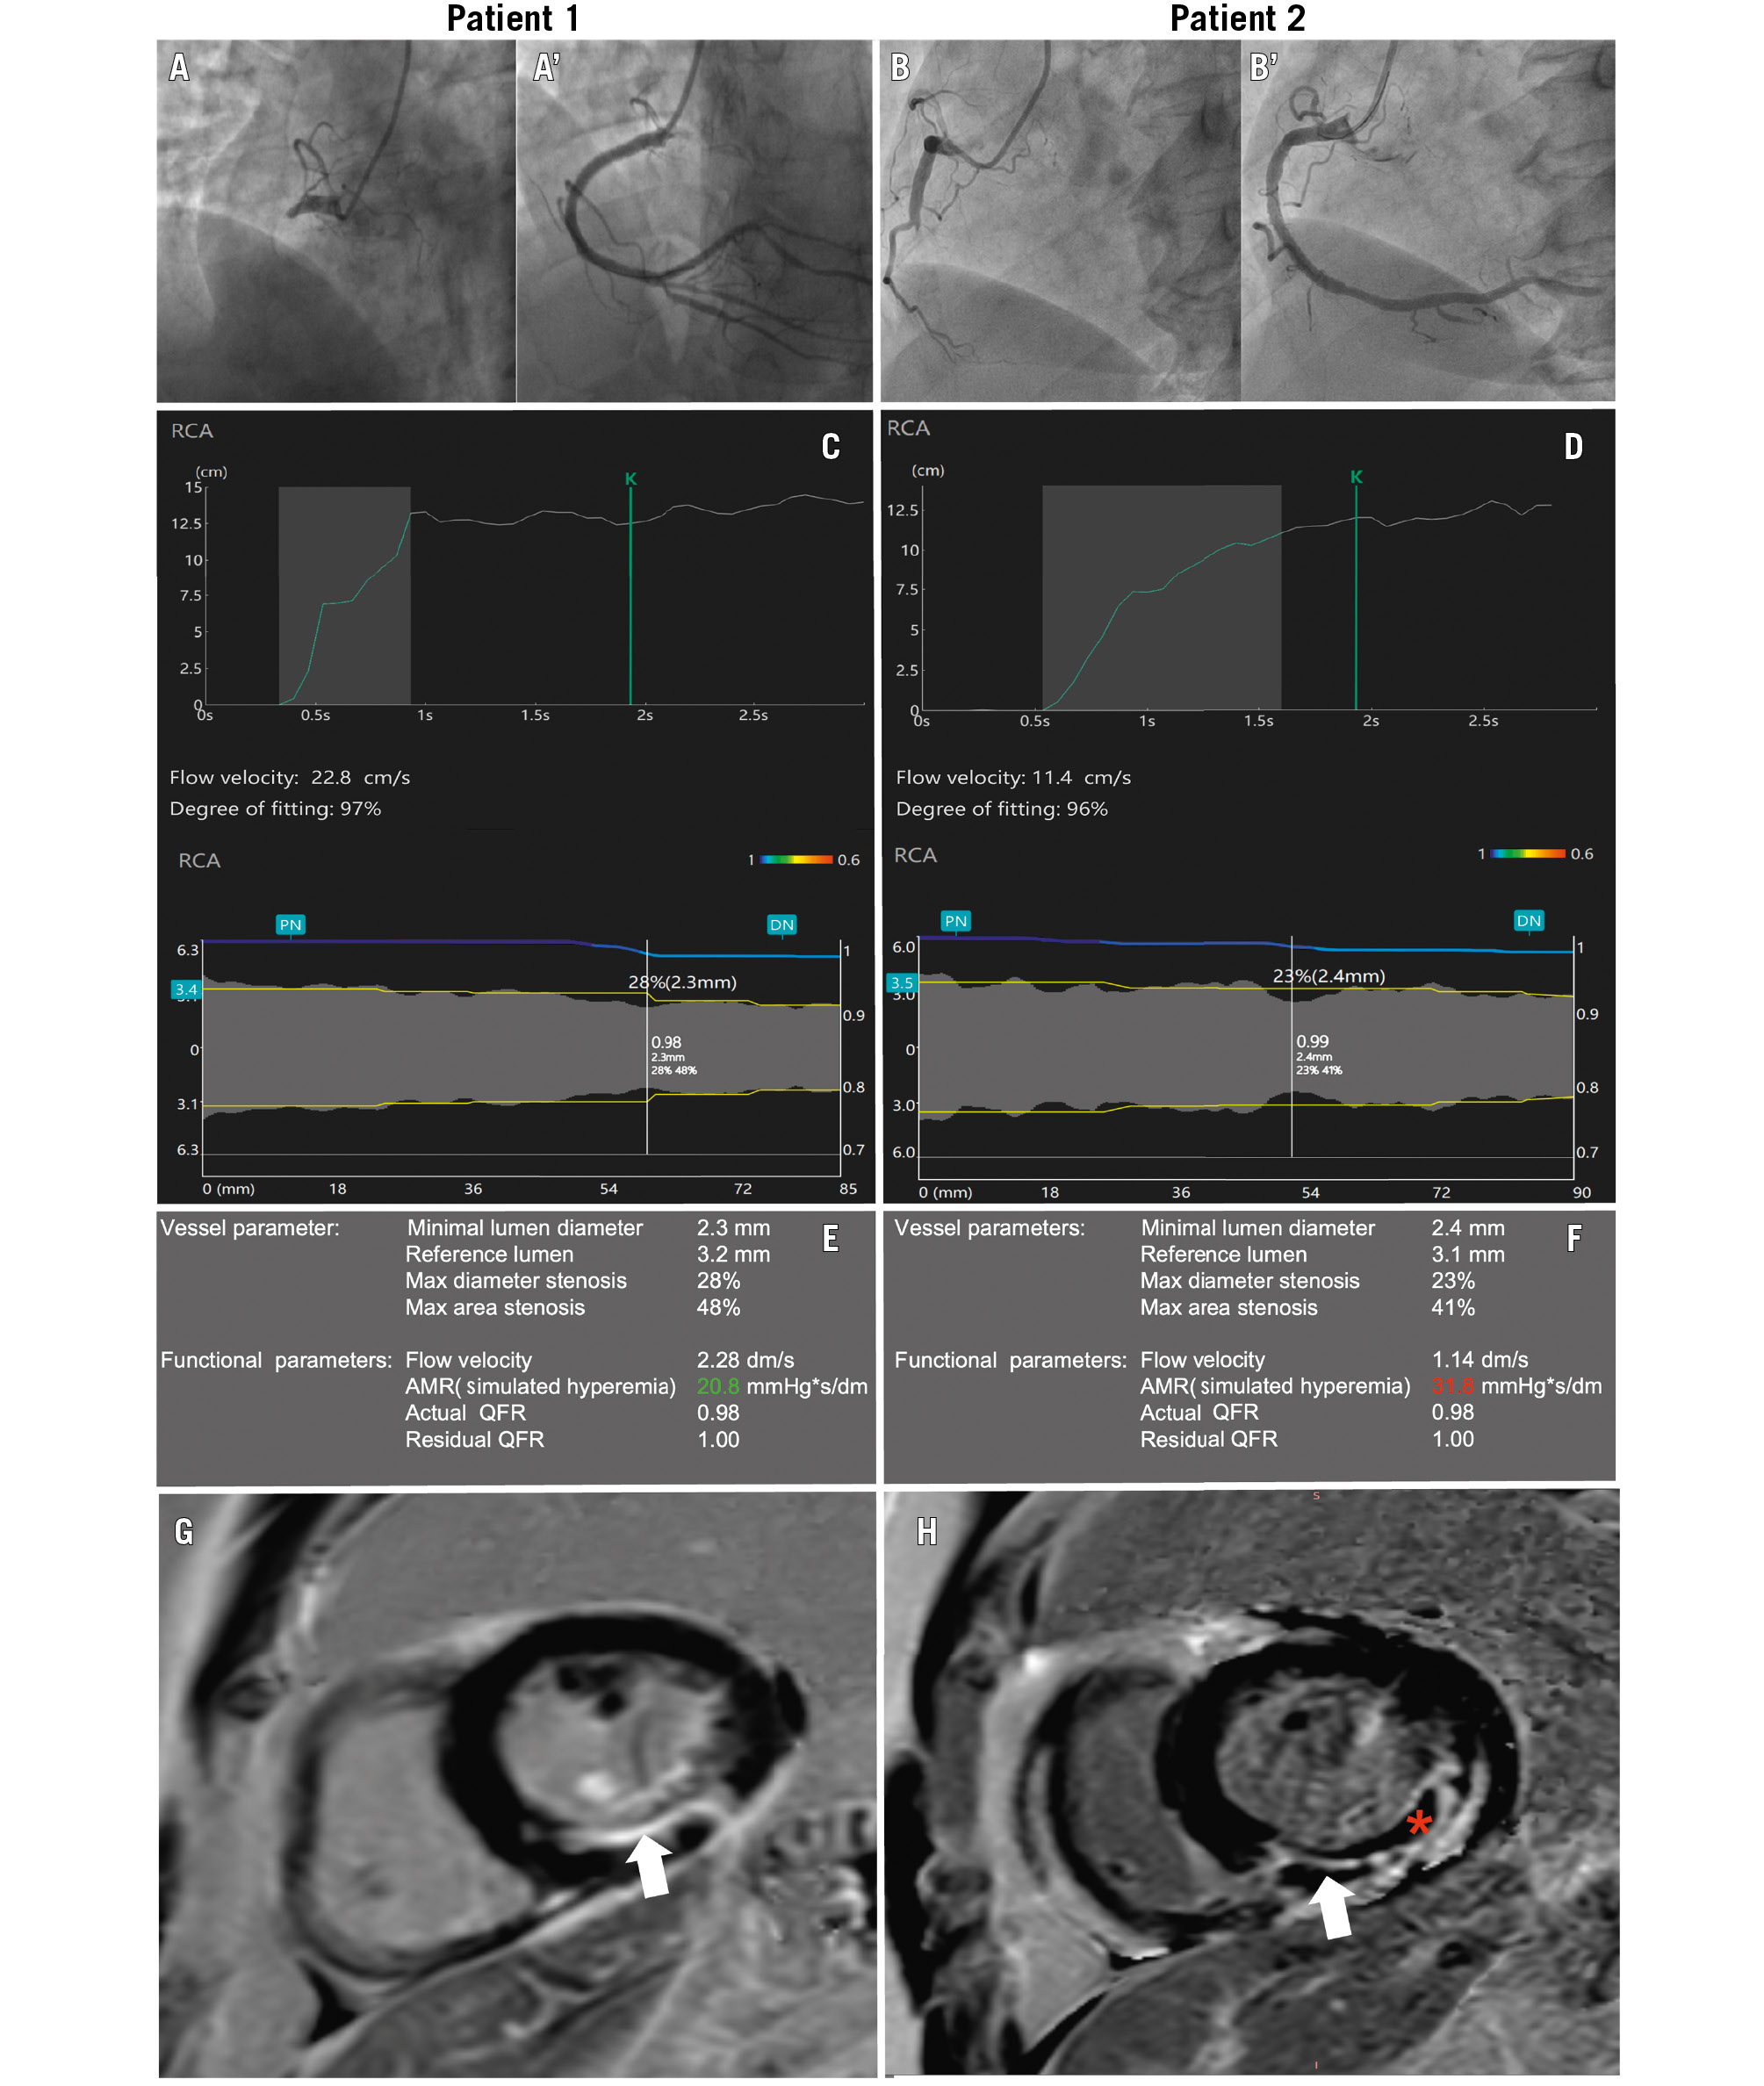
Figure 1. Measurement of AMR and CMR images. A, B) Pre- and (A', B') post-PPCI angiographic images of two patients with right coronary artery occlusions. C, D) Automated calculation process of flow velocity and vessel diameter. E, F) μQFR and AMR results of the culprit vessels in Patient 1 and Patient 2, respectively. G, H) MVO as identified on CMR using LGE imaging. MVO is defined as a hypointense core (red asterisk) within a region of hyperintense LGE (white arrow), manually delineated on short-axis PSIR slices, obtained 10 minutes after contrast agent injection. G) Patient without MVO. H) Patient with MVO. AMR: angiographic microcirculatory resistance; CMR: cardiac magnetic resonance; LGE: late gadolinium enhancement; MVO: microvascular obstruction; PSIR: phase-sensitive inversion recovery sequence; QFR: quantitative flow ratio; RCA: right coronary artery; μQFR: Murray law-based quantitative flow ratio

Formule_1.
Statistical analysis
Continuous variables with a normal distribution are presented as mean±standard deviation (SD). Differences between the two groups were compared using t-tests. Variables without a normal distribution are presented as medians with interquartile ranges (IQR), and group differences were analysed using the Mann-Whitney U test. Receiver operating characteristic (ROC) curves were used to analyse the relationship between AMR and CMD in the derivation cohort and to determine the optimal cutoff value. The cutoff value was calculated using the Youden index. In the derivation cohort, AMR was confirmed as a significant factor in the occurrence of CMD using binary logistic regression, and the variables included in the binary logistic regression were those with a p<0.05 in the univariable analysis. Endpoint event rates during follow-up were compared using log-rank tests. Associations between different variables and clinical events were determined using univariable Cox regression analysis. Significant variables (p<0.05) were included in multivariable Cox regression models to analyse the risk factors influencing prognosis. Intra- and interobserver agreements were assessed using Bland-Altman and kappa analyses. Further, intraobserver variability was analysed by two reviewers who independently assessed the images and were blinded to each other’s findings. In contrast, interobserver variability was assessed by the same reviewer by analysing the same image at an interval of at least 3 months. In the validation cohort, AMR was stratified into quartiles due to its non-normal distribution. Univariable analysis was performed to assess the differences in various factors across the quartiles. Factors with a p-value<0.05 in the univariable analysis were included in a multivariable ordinal logistic regression model to explore factors influencing increased AMR. All statistical analyses were performed using R software, version 4.3.2 (R Foundation for Statistical Computing) and SPSS software, version 25.0 (IBM). A p-value<0.05 was considered statistically significant for all analyses.
Results
Derivation cohort
Baseline characteristics
Patients were excluded from the derivation cohort based on the following criteria: poor AMR image quality (n=8), post-PPCI QFR ≤0.80 (n=11), reperfusion time >12 h (n=4), and CMR >14 days after PPCI (n=37) (Figure 2). Ultimately, data from 435 patients (median age 60 [IQR 54, 65] years, 89.20% male) were analysed. The median time to CMR was 5 (IQR 3, 6) days after PPCI. Among them, 293 and 142 patients were included in the CMD and non-CMD groups. Compared to the non-CMD group, the CMD group exhibited worse Killip classification and lower left ventricular ejection fraction (Table 1).
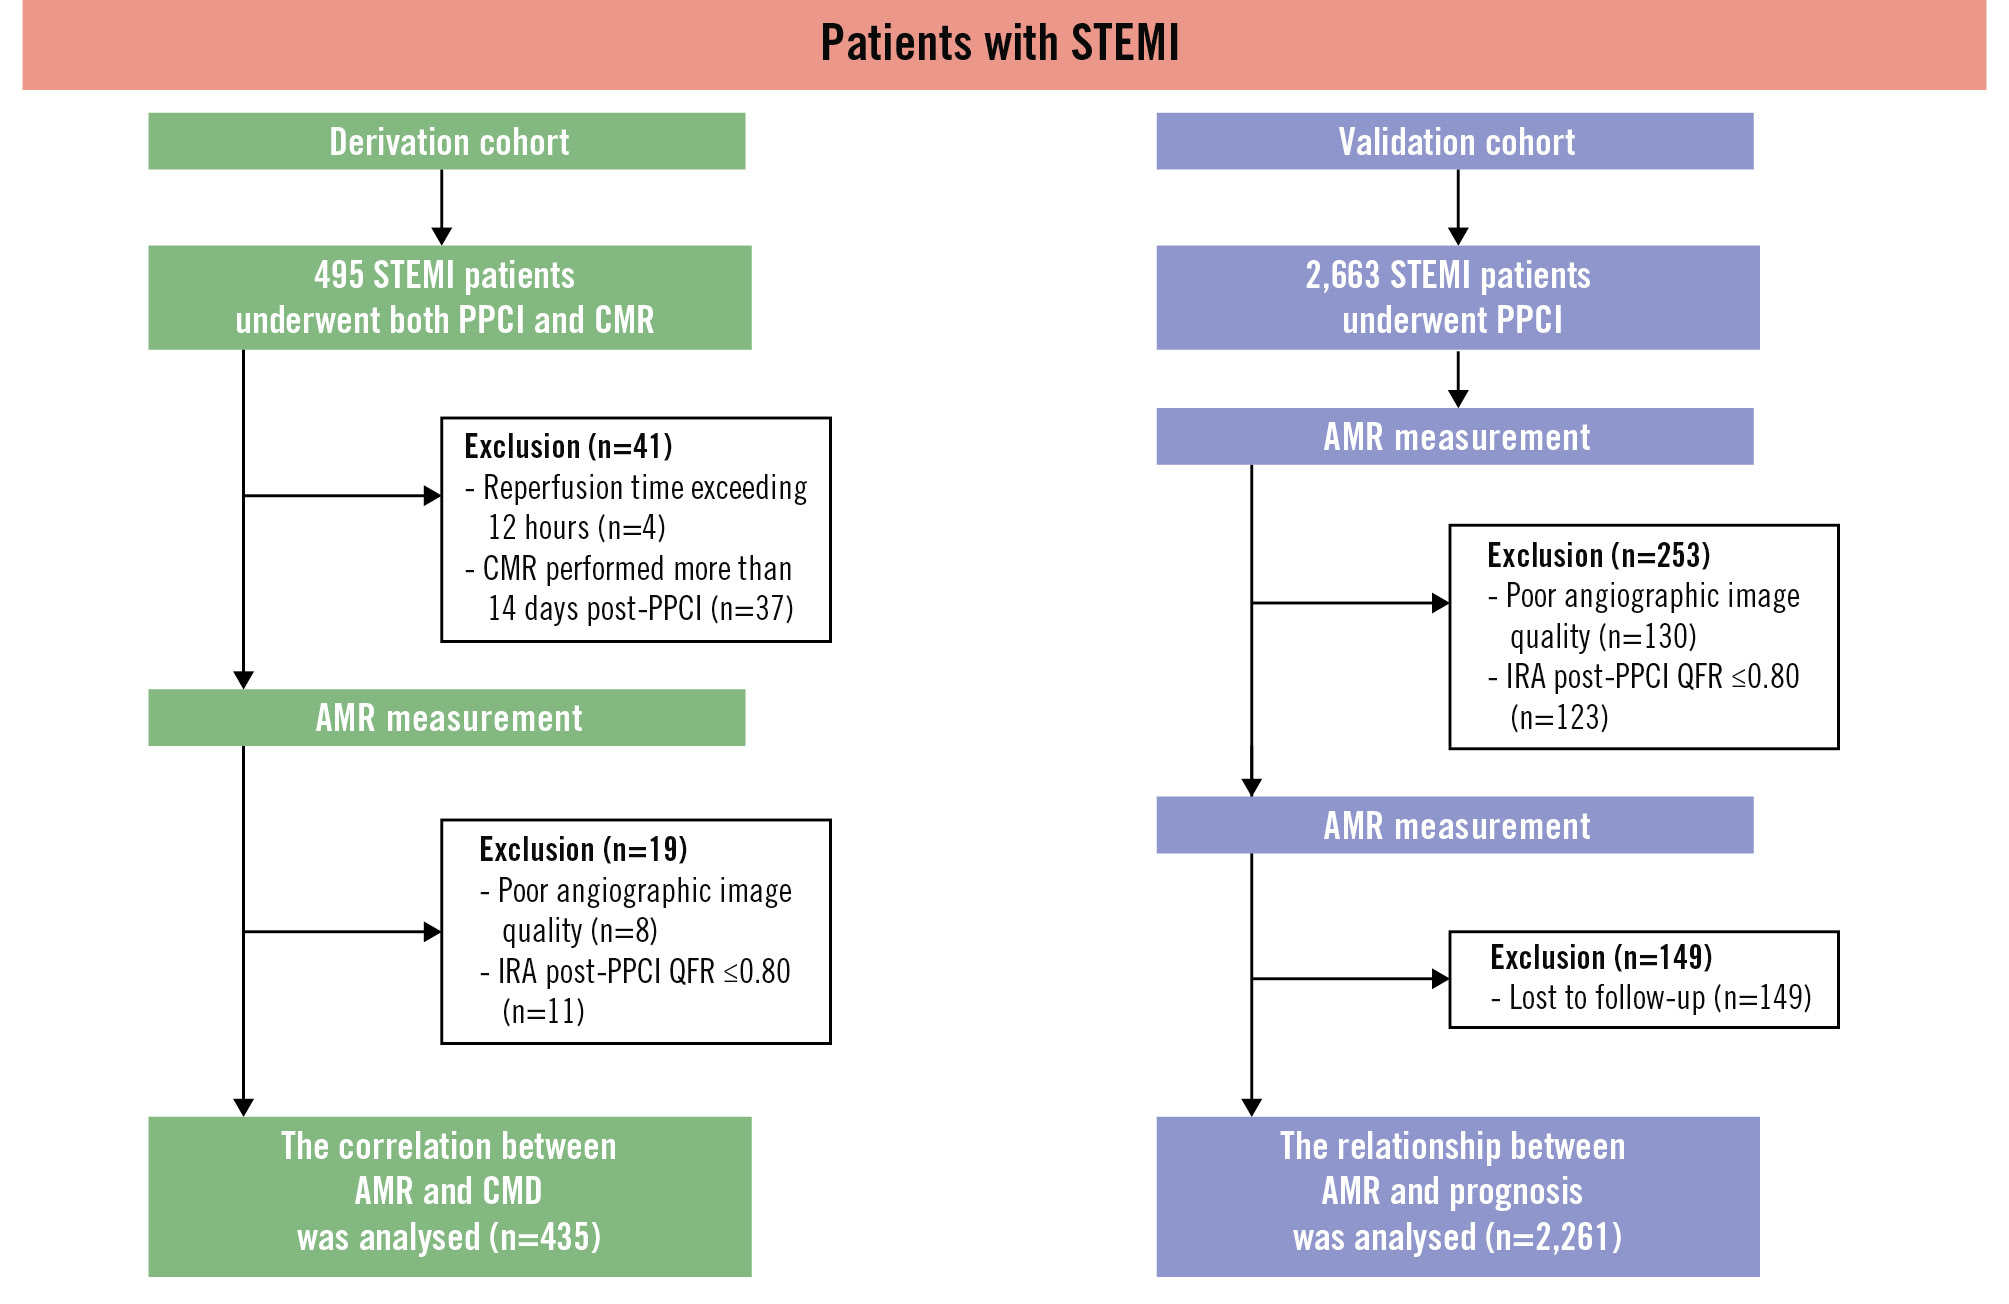
Figure 2. Study flowchart. The study comprised a derivation cohort and a validation cohort. The derivation cohort was used to determine the optimal cutoff value of AMR for diagnosing CMD. This value was then validated in the validation cohort. AMR: angiographic microcirculatory resistance; CMD: coronary microvascular dysfunction; CMR: cardiac magnetic resonance; IRA: infarct-related artery; PPCI: primary percutaneous coronary intervention; QFR: quantitative flow ratio; STEMI: ST-segment elevation myocardial infarction
Table 1. Baseline characteristics of the derivation cohort.
| Total (n=435) | No CMD (n=142) | CMD (n=293) | p-value | |
|---|---|---|---|---|
| Age, years | 60.00 [54.00, 65.00] | 61.00 [56.00, 66.00] | 59.00 [54.00, 65.00] | 0.046 |
| Male | 388 (89.20) | 122 (85.92) | 266 (90.78) | 0.125 |
| BMI, kg/m² | 24.58 [22.86, 26.45] | 25.02 [23.23, 26.57] | 24.51 [22.72, 26.30] | 0.245 |
| HR, bpm | 76.00 [67.00, 87.00] | 73.50 [65.00, 82.00] | 78.00 [67.00, 88.00] | 0.022 |
| SBP, mmHg | 134.62 (20.75) | 134.86 (20.91) | 134.50 (20.71) | 0.867 |
| DBP, mmHg | 80.00 [72.00, 93.00] | 79.00 [73.00, 88.00] | 83.00 [72.00, 94.00] | 0.036 |
| Hypertension | 220 (50.57) | 64 (45.07) | 156 (53.24) | 0.110 |
| Diabetes mellitus | 130 (29.89) | 40 (28.17) | 90 (30.72) | 0.586 |
| Smoking | 291 (66.90) | 89 (62.68) | 202 (68.94) | 0.193 |
| Hyperlipidaemia | 202 (46.44) | 57 (40.14) | 145 (49.49) | 0.067 |
| CKD | 10 (2.30) | 3 (2.11) | 7 (2.39) | 0.999 |
| LVEF, % | 53.03 [46.22, 61.23] | 59.05 [51.66, 64.79] | 50.84 [43.12, 58.04] | <0.001 |
| STB time, hours | 4.60 [3.40, 6.25] | 4.78 [3.40, 6.81] | 4.58 [3.37, 6.00] | 0.479 |
| Culprit vessel | 0.181 | |||
| LAD | 276 (63.45) | 94 (66.20) | 182 (62.12) | |
| LCx | 33 (7.59) | 6 (4.22) | 27 (9.21) | |
| RCA | 126 (28.96) | 42 (29.58) | 84 (28.67) | |
| Killip heart function classification | <0.001 | |||
| I | 324 (74.48) | 122 (85.92) | 202 (68.94) | |
| II-IV | 111 (25.52) | 18 (14.08) | 70 (31.06) | |
| Number of stents | 0.303 | |||
| 0 | 15 (3.45) | 6 (4.23) | 9 (3.07) | |
| 1 | 322 (74.02) | 103 (72.54) | 219 (74.74) | |
| 2 | 92 (21.15) | 29 (20.42) | 63 (21.50) | |
| 3 | 6 (1.38) | 4 (2.82) | 2 (0.68) | |
| Occlusion position | 0.831 | |||
| Proximal | 224 (51.49) | 76 (53.52) | 148 (50.51) | |
| Middle | 199 (45.75) | 62 (43.66) | 137 (46.76) | |
| Distal | 12 (2.76) | 4 (2.82) | 8 (2.73) | |
| Multivessel disease | 242 (55.63) | 81 (57.04) | 161 (54.95) | 0.680 |
| TIMI flow pre-PCI | 0.367 | |||
| 0 | 286 (65.75) | 86 (60.56) | 200 (68.26) | |
| 1 | 44 (10.11) | 18 (12.68) | 26 (8.87) | |
| 2 | 34 (7.82) | 11 (7.75) | 23 (7.85) | |
| 3 | 71 (16.32) | 27 (19.01) | 44 (15.02) | |
| High thrombus burden | 309 (71.03) | 97 (68.31) | 212 (72.35) | 0.383 |
| Thrombus aspiration | 102 (23.45) | 26 (18.31) | 76 (25.94) | 0.078 |
| AMR, mmHg*s/dm | 26.70 [23.20, 31.10] | 24.15 [20.60, 27.73] | 27.80 [24.40, 32.75] | <0.001 |
| μQFR | 0.96 [0.93, 0.98] | 0.95 [0.92, 0.97] | 0.96 [0.93, 0.98] | 0.075 |
| Blood flow velocity, dm/s | 1.46 [1.14, 1.78] | 1.67 [1.38, 2.08] | 1.30 [1.04, 1.70] | <0.001 |
| Values are n (%) or mean [interquartile range]. AMR: angiographic microcirculatory resistance; BMI: body mass index; CKD: chronic kidney disease; CMD: coronary microvascular dysfunction; DBP: diastolic blood pressure; HR: heart rate; LAD: left anterior descending artery; LCx: left circumflex artery; LVEF: left ventricular ejection fraction; RCA: right coronary artery; SBP: systolic blood pressure; STB: symptom-to-balloon; TIMI: Thrombolysis in Myocardial Infarction; μQFR: Murray law-based quantitative flow ratio | ||||
Relationship between AMR and CMD
Among all patients in the derivation cohort, the median AMR was 26.70 (IQR 23.20, 31.05) mmHg*s/dm. The AMR value was significantly higher in the CMD group compared to the non-CMD group (27.80 [IQR 24.40, 32.70] vs 24.15 [IQR 20.60, 27.63] mmHg*s/dm; p<0.001). The ROC curve analysis revealed that an AMR >26.6 mmHg*s/dm was the optimal cutoff for diagnosing CMD (area under the curve=0.721, sensitivity 61.09%, specificity 70.42%) (Supplementary Figure 1). Multivariable logistic regression analysis demonstrated that an AMR >26.6 mmHg*s/dm was an independent risk factor for post-STEMI CMD after adjusting for confounding factors (Supplementary Table 1).
Validation cohort
Baseline characteristics
The validation cohort included 2,663 patients from 4 centres. Among them, 130 patients had angiographic images that could not be analysed for AMR, 123 had a post-PPCI QFR of ≤0.80, and 149 were lost to follow-up. Ultimately, 2,261 patients were included in the analysis (median age 62 [IQR 52, 69] years, 74.7% male) with a median follow-up time of 44 months (Table 2, Figure 2).
Table 2. Baseline characteristics of the validation cohort.
| Total (n=2,261) | AMR ≤26.6 mmHg*s/dm | AMR >26.6 mmHg*s/dm | p-value | |
|---|---|---|---|---|
| Age, years | 62.00 [52.00, 69.00] | 61.00 [51.00, 69.00] | 63.00 [54.00, 70.00] | <0.001 |
| Male | 1,689 (74.70) | 765 (76.88) | 924 (72.99) | 0.034 |
| BMI, kg/m² | 25.52 [23.63, 27.65] | 25.65 [23.66, 27.76] | 25.46 [23.60, 27.57] | 0.256 |
| HR, bpm | 76.00 [66.00, 88.00] | 77.00 [67.00, 88.00] | 76.00 [65.00, 88.00] | 0.467 |
| SBP, mmHg | 126.00 [110.00, 143.00] | 128.00 [112.00, 144.00] | 124.50 [110.00, 141.00] | 0.001 |
| DBP, mmHg | 78.00 [68.00, 90.00] | 79.00 [70.00, 91.00] | 77.00 [67.00, 89.00] | 0.002 |
| Hypertension | 1,132 (50.07) | 415 (41.71) | 717 (56.64) | <0.001 |
| Diabetes mellitus | 590 (26.09) | 266 (26.73) | 324 (25.59) | 0.540 |
| Smoking | 1,122 (49.62) | 514 (51.66) | 608 (48.03) | 0.086 |
| CKD | 65 (2.87) | 28 (2.81) | 37 (2.92) | 0.878 |
| MI history | 50 (2.21) | 24 (2.41) | 26 (2.05) | 0.666 |
| STB time, hours | 5.00 [3.00, 7.00] | 4.60 [2.92, 6.00] | 5.00 [3.00, 8.00] | <0.001 |
| Killip heart function classification | 0.004 | |||
| I | 1,344 (59.44) | 625 (62.81) | 719 (56.79) | |
| II-IV | 917 (40.56) | 370 (37.19) | 547 (43.21) | |
| Culprit vessel | 0.123 | |||
| LAD | 1,112 (49.18) | 487 (48.94) | 625 (49.37) | |
| LCx | 268 (11.85) | 104 (10.45) | 164 (12.95) | |
| RCA | 881 (38.97) | 404 (40.60) | 477 (37.68) | |
| Number of stents | 0.846 | |||
| 0 | 185 (8.18) | 86 (8.64) | 99 (7.82) | |
| 1 | 1,776 (78.55) | 782 (78.59) | 994 (78.52) | |
| 2 | 283 (12.52) | 120 (12.06) | 163 (12.88) | |
| 3 | 17 (0.75) | 7 (0.70) | 10 (0.79) | |
| Occlusion position | 0.244 | |||
| Proximal | 1,096 (48.47) | 464 (46.63) | 632 (49.92) | |
| Middle | 853 (37.73) | 384 (38.59) | 469 (37.05) | |
| Distal | 312 (13.80) | 147 (14.77) | 165 (13.03) | |
| Multivessel disease | 506 (22.38) | 237 (23.82) | 269 (21.25) | 0.160 |
| TIMI flow pre-PPCI | <0.001 | |||
| 0 | 1,506 (66.61) | 657 (66.03) | 849 (67.06) | |
| 1 | 112 (4.95) | 37 (3.72) | 75 (5.92) | |
| 2 | 203 (8.98) | 63 (6.33) | 140 (11.06) | |
| 3 | 440 (19.46) | 238 (23.92) | 202 (15.96) | |
| High thrombus burden | 1,759 (77.80) | 687 (69.05) | 1,072 (84.68) | <0.001 |
| Thrombus aspiration | 325 (14.40) | 174 (17.49) | 151 (11.93) | <0.001 |
| AMR, mmHg*s/dm | 27.80 [23.00, 33.40] | 22.50 [19.90, 24.40] | 32.70 [29.50, 37.38] | <0.001 |
| μQFR | 0.96 [0.92, 0.98] | 0.93 [0.88, 0.96] | 0.97 [0.94, 0.98] | <0.001 |
| Blood flow velocity, dm/s | 1.34 [1.00, 1.79] | 1.84 [1.61, 2.15] | 1.05 [0.82, 1.25] | <0.001 |
| Medication use | ||||
| GPIIb/IIIa inhibitor | 1,787 (79.04) | 786 (78.99) | 1,001 (79.07) | 0.966 |
| Statin | 2,229 (98.58) | 980 (98.49) | 1,249 (98.66) | 0.742 |
| Aspirin | 2,250 (99.51) | 995 (100.00) | 1,255 (99.13) | 0.003 |
| Ticagrelor | 2,143 (94.78) | 963 (96.78) | 1,180 (93.21) | <0.001 |
| Clopidogrel | 118 (5.22) | 32 (3.22) | 86 (6.79) | <0.001 |
| ACEi/ARB/ARNI | 2,200 (97.30) | 971 (97.59) | 1,229 (97.08) | 0.457 |
| ß-blocker | 2,220 (98.19) | 976 (98.09) | 1,244 (98.26) | 0.761 |
| Values are n (%) or mean [interquartile range]. ACEi: angiotensin-converting enzyme inhibitor; AMR: angiographic microcirculatory resistance; ARB: angiotensin II receptor blockers; ARNI: angiotensin receptor-neprilysin inhibitors; BMI: body mass index; CKD: chronic kidney disease; DBP: diastolic blood pressure; GP: glycoprotein; HR: heart rate; LAD: left anterior descending artery; LCx: left circumflex artery; PPCI: primary percutaneous coronary intervention; RCA: right coronary artery; SBP: systolic blood pressure; STB: symptom-to-balloon; TIMI: Thrombolysis in Myocardial Infarction; μQFR: Murray law-based quantitative flow ratio | ||||
Validation analyses
The CMD group had a significantly higher cumulative incidence of MACE compared to the non-CMD group (30.9% vs 21.5%, adjusted hazard ratio [HR] 1.47, 95% confidence interval [CI]: 1.20-1.80; p<0.001) (Table 3, Supplementary Table 2, Figure 3). In addition, the cumulative incidences of cardiac death (6.9% vs 4.1%, adjusted HR 2.31, 95% CI: 1.42-3.77; p<0.001), hospitalisation for heart failure (19.6% vs 10.5%, adjusted HR 1.68, 95% CI: 1.28-2.20; p<0.001), and all-cause death (9.3% vs 5.8%, adjusted HR 1.82, 95% CI: 1.18-2.80; p=0.007) were higher in patients with an AMR >26.6 mmHg*s/dm than in those with an AMR ≤26.6 mmHg*s/dm. The cumulative incidences of repeat MI and TLR did not differ significantly between the groups (Table 3, Supplementary Table 3, Figure 3). When AMR was used as a continuous variable, MACE incidence increased with AMR (per 10 mmHg*s/dm increase of AMR, adjusted HR 1.30, 95% CI: 1.17-1.46; p<0.001) (Supplementary Figure 2). The results of the subgroup analyses are similar to the full set of analyses, and the specific results are presented in Supplementary Figure 3.
Table 3. Cox regression analysis of clinical events in the validation cohort.
| Univariable | Multivariable | |||
|---|---|---|---|---|
| HR (95% CI) | p-value | HR (95% CI) | p-value | |
| MACE | 1.66 (1.37-2.02) | <0.001 | 1.47 (1.20-1.80) | <0.001 |
| Cardiac death | 2.63 (1.63-4.24) | <0.001 | 2.31 (1.42-3.77) | <0.001 |
| Hospitalisation for heart failure | 1.97 (1.51-2.57) | <0.001 | 1.68 (1.28-2.20) | <0.001 |
| Target lesion revascularisation | 1.07 (0.73-1.57) | 0.739 | 0.89 (0.59-1.32) | 0.553 |
| Repeat myocardial infarction | 1.15 (0.75-1.76) | 0.514 | 0.98 (0.62-1.55) | 0.926 |
| All-cause death | 2.10 (1.39-3.17) | <0.001 | 1.82 (1.18-2.80) | 0.007 |
| CI: confidence interval; HR: hazard ratio; MACE: major adverse cardiovascular events | ||||
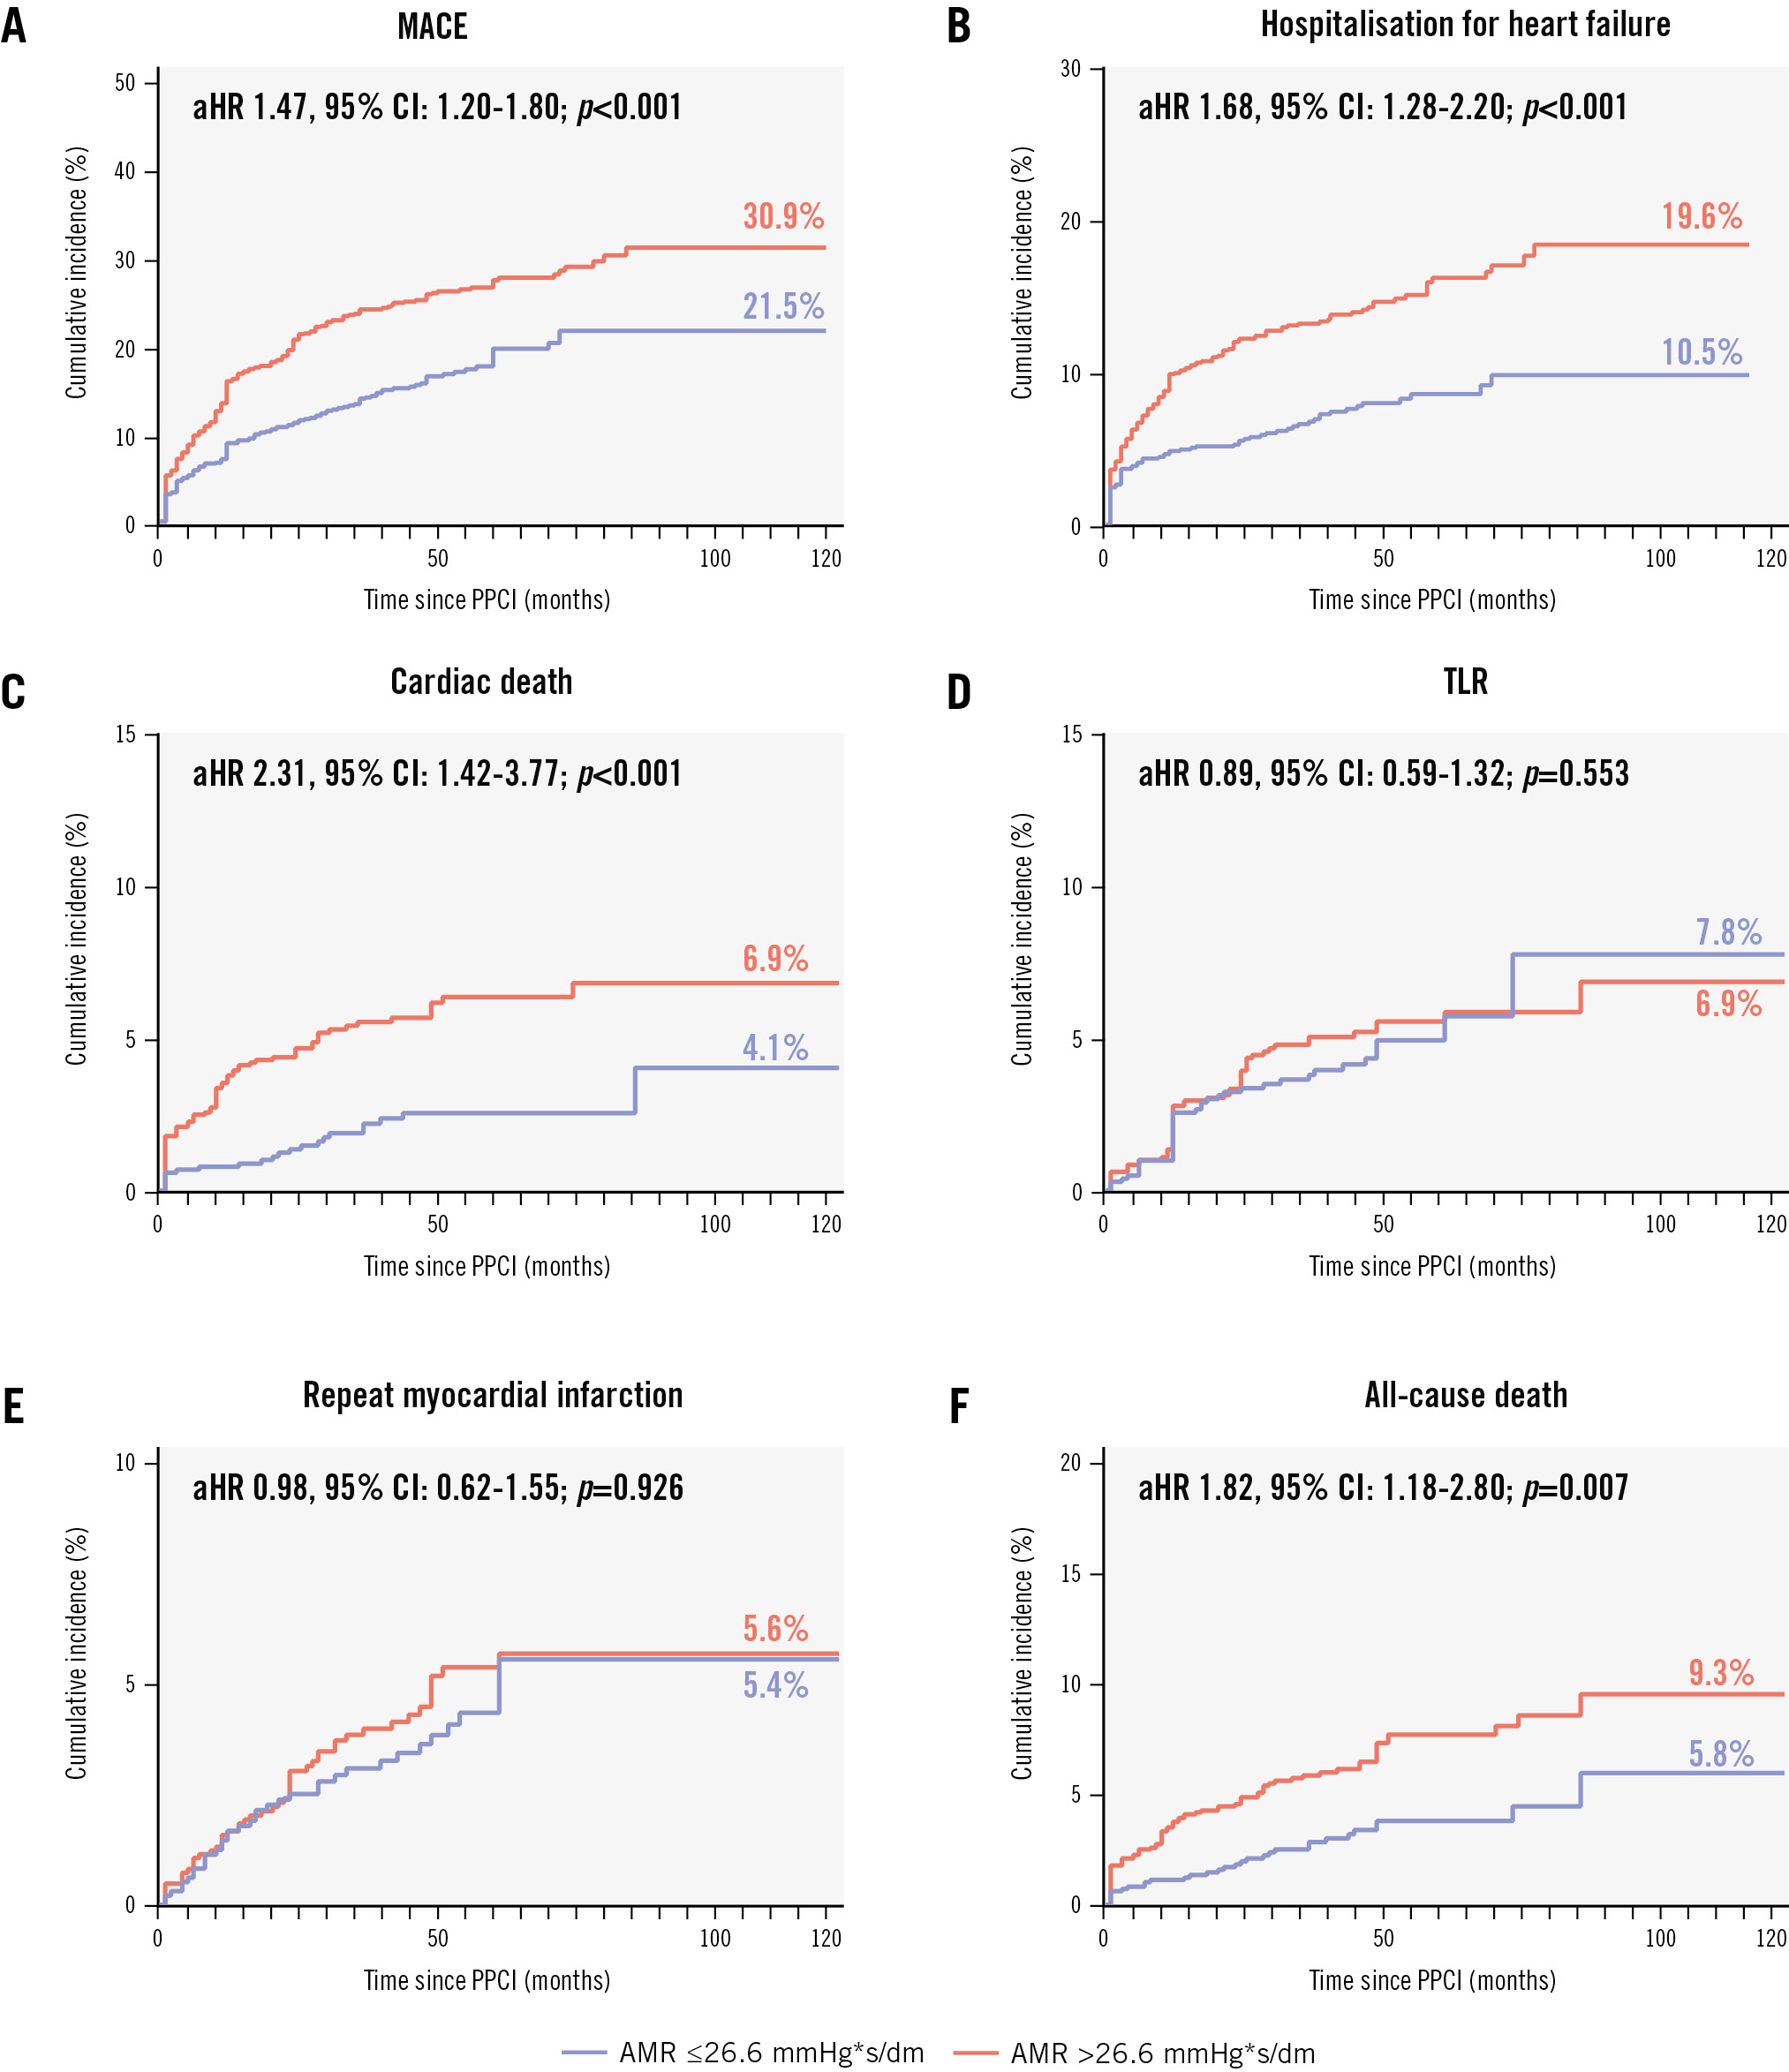
Figure 3. Kaplan-Meier survival curves for the endpoint events. A) MACE; (B) hospitalisation for heart failure; (C) cardiac death; (D) TLR; (E) repeat myocardial infarction; (F) all-cause death. aHR: adjusted hazard ratio; AMR: angiographic microcirculatory resistance; CI: confidence interval; MACE: major adverse cardiovascular events; PPCI: primary percutaneous coronary intervention; TLR: target lesion revascularisation
Reproducibility analyses
We assessed the reproducibility of the AMR measurements in a random sample of 100 patients. The results of the Bland-Altman analyses revealed good consistency of intra- and interobserver AMR measurements (bias: –0.104; p=0.142, and bias: –0.032; p=0.784, respectively). Kappa analysis also showed good intra- and interobserver consistency (k=0.914 and k=0.958, respectively; p<0.001 for both).
Additional analyses
To explore the factors contributing to elevated AMR, and considering its non-normal distribution, AMR was categorised into quartiles (Supplementary Table 4). Multivariable logistic regression (Supplementary Table 5) revealed several factors significantly associated with increased AMR. Age (odds ratio [OR] 1.01, 95% CI: 1.00-1.02; p=0.013) and prolonged ischaemia time (OR 1.05, 95% CI: 1.02-1.07; p<0.001) were associated with increased AMR, as were hypertension (OR 2.62, 95% CI: 2.14-3.21; p<0.001) and high thrombus burden (OR 2.19, 95% CI: 1.82-2.65; p<0.001). Pre-PPCI TIMI flow grades <3 were strongly associated with higher AMR: TIMI 0 (OR 1.52, 95% CI: 1.25-1.84; p<0.001), TIMI 1 (OR 2.21, 95% CI: 1.51-3.23; p<0.001), and TIMI 2 (OR 2.04, 95% CI: 1.51-2.76; p<0.001). Thrombus aspiration (OR 0.70, 95% CI: 0.56-0.87; p=0.001), higher systolic blood pressure (SBP; OR 0.99, 95% CI: 0.98-0.99; p<0.001) and ticagrelor use (OR 0.58, 95% CI: 0.40-0.85; p=0.006) were associated with lower AMR.
Discussion
This study investigated the predictive value of AMR as a novel non-invasive microcirculatory resistance measurement tool for assessing CMD and long-term prognosis in patients with STEMI treated with PPCI. Our findings were as follows: (1) AMR >26.6 mmHg*s/dm was identified as the optimal cutoff value for diagnosing CMD in patients with STEMI treated with PPCI. 2) The incidence of MACE was significantly higher among patients with STEMI and an AMR >26.6 mmHg*s/dm compared to those with an AMR ≤26.6 mmHg*s/dm after PPCI. 3) AMR demonstrated good reproducibility and served as a convenient intraoperative diagnostic tool for CMD. 4) Age, prolonged ischaemia time, hypertension, and lower pre-PPCI TIMI flow grades were independently associated with elevated AMR, while thrombus aspiration, higher SBP, and ticagrelor use correlated with lower AMR.
Although PPCI successfully restores the epicardial blood flow in patients with STEMI, myocardial perfusion at the microcirculatory level is crucial. During CMD, microvascular spasm, oedema, blockage, or endothelial cell death in the myocardium leads to inadequate restoration of blood supply1. This can result in increased infarct size, decreased cardiac function, and increased rates of adverse events16. Therefore, it is crucial to identify CMD during PPCI and perform appropriate, timely interventions to improve a patient’s prognosis.
Traditional angiographic methods such as TIMI flow, corrected TIMI frame count, and myocardial blush grade are subjective, have relatively poor repeatability, and are inappropriate for directly assessing microvascular dysfunction11718. Although non-invasive examinations such as CMR and positron emission tomography-computed tomography can accurately detect microvascular dysfunction, their application in catheterisation laboratories is impractical due to time, cost, and spatial limitations1920. The IMR is more accurate, repeatable, and provides real-time results. An elevated IMR after PPCI in patients with STEMI affects prognosis345. Although using the IMR as a risk assessment tool for patients after STEMI appears beneficial, the need for intraoperative equipment changes and vasodilators increases the risk of prolonging the operating duration, hypotension, and arrhythmia21. Furthermore, the IMR can only be measured intraoperatively and cannot be repeated postoperatively. These limitations hinder widespread application of the IMR.
Previous studies explored alternative pressure wire-free tools derived from angiography to assess microcirculatory resistance as a replacement for the IMR. These methods calculate QFR based on angiography and estimate microcirculatory resistance using blood flow velocity and aortic pressure. While they avoid the need for dedicated wires for IMR measurement and intraoperative detection, at least two angiographic views (>25°) per vessel should be acquired, resulting in increased contrast agent usage and procedural complexity6789. These methods also assume that the reference lumen of the coronary artery narrows linearly from the proximal to the distal end, which can lead to inaccurate QFR results in vessels with multiple branches and miscalculated microcirculatory resistance11. These limitations restrict the widespread adoption of these techniques. In contrast, the AMR applied herein uses a μQFR calculation based on Murray’s law and only requires a single view22. The maximum hyperaemic flow velocity was then algorithmically determined at rest15. These features eliminate the need for vasodilators, leading to faster (<1 min/vessel) and more accurate measurement, and the learning curve is short. The consistency between AMR and the IMR has been demonstrated11.
In the derivation cohort, a cutoff value of >26.6 mmHg*s/dm was found to be the most appropriate for predicting CMD, which was subsequently validated in the validation cohort. Notably, spline-based Cox regression analysis determined that an optimal AMR threshold of >27.6 mmHg*s/dm was the most appropriate for predicting MACE (Supplementary Figure 2), closely aligning with the derivation cohort findings. In the present study, the cutoff value for AMR was lower than that employed in previous studies using the IMR as an indicator. Most of these studies used a cutoff value of 4022324. Given the good agreement between AMR and the IMR, the lower values were not due to inaccuracies in assessing microcirculatory resistance using AMR11. Meanwhile, our study demonstrated a significant increase in the incidence of MACE in patients in the derivation cohort with an AMR >26.6 mmHg*s/dm, which is numerically similar to the results of a recently published study in a smaller sample of patients. In that study, AMR was associated with prognosis in patients with STEMI using a cutoff of 25 mmHg*s/dm25. A lower threshold value helps reduce the likelihood of missing a diagnosis of CMD after PPCI and allows for early intervention during the procedure.
In the additional analysis, we explored the factors associated with elevated AMR in the validation cohort. These factors are generally consistent with previous studies. Advanced age is a known risk factor for coronary microvascular dysfunction24. In this study, we identified hypertension as a risk factor for elevated AMR. However, higher SBP during PPCI was associated with lower AMR values. These findings are not contradictory. Extensive research has shown that hypertension contributes to endothelial injury26, which in turn increases microcirculatory resistance and raises AMR. However, in STEMI patients, maintaining higher blood pressure is a critical strategy to sustain myocardial perfusion. Adequate myocardial perfusion helps mitigate microvascular damage, reduce microcirculatory resistance, and consequently lower AMR. Previous studies have also confirmed that higher SBP levels at admission in STEMI patients are associated with a better prognosis2728. Patients with low pre-PPCI TIMI flow grades and prolonged symptom-to-balloon times experience longer periods of myocardial ischaemia or hypoperfusion, leading to more severe injury and necrosis of endothelial and smooth muscle cells in the infarcted area, thereby exacerbating microvascular dysfunction29. Patients with high thrombus burden are more likely to experience distal embolisation during PPCI30. Thrombus aspiration, although not routinely recommended by current guidelines, can effectively reduce AMR by preventing distal embolism in patients with a high thrombus load31. Regarding perioperative antiplatelet therapy, both ticagrelor and clopidogrel are adenosine diphosphate (ADP) inhibitors; however, ticagrelor was associated with lower AMR. This may be due to ticagrelor’s ability to more rapidly inhibit platelet aggregation, increase plasma adenosine concentration to enhance coronary blood flow, and inhibit ADP-induced vascular smooth muscle contraction, thereby reducing vascular spasm32.
Diabetes, a traditional risk factor33, was not found to be associated with increased AMR or CMD detected by CMR in the derivation cohort. Possible reasons for this include the following: (1) the relationship between CMD and diabetes is complex. Diabetes predisposes patients to CMD during STEMI, but CMD is also influenced by various factors such as age, blood pressure, thrombus burden, ischaemic duration, and procedural interventions, making diabetes not the sole determinant. 2) Cardiovascular damage in diabetes is multifaceted. In addition to its detrimental effects on microvascular function, diabetes also promotes the narrowing of epicardial vessels and the instability of plaques34. 3) Due to the retrospective nature of the study, accurate data on patients’ blood glucose levels and use of antidiabetic medications prior to STEMI admission were difficult to obtain.
Limitations
The study had the following limitations. First, this was a retrospective study subject to recall bias and lacking a standardised PPCI protocol, particularly in the pharmacological or mechanical management of slow flow/no-reflow phenomena, which may have introduced operator-dependent confounding. A prospective, multicentre, randomised controlled trial with standardised PPCI protocols and AMR-guided interventions is required to further validate the findings of this study. Second, although AMR requires only one projection view, accurate AMR cannot be obtained in approximately 5% of patients due to excessive vessel tortuosity or poor angiographic quality. Third, while CMR remains the most accurate non-invasive method for detecting structural microvascular injury such as MVO and IMH after STEMI, they do not directly measure dynamic microvascular function. Future studies should compare AMR with a functional index, such as myocardial flow reserve assessed by positron emission tomography. Fourth, we excluded patients with a μQFR ≤0.80 after PPCI, and these patients require further investigation.
Conclusions
In conclusion, AMR can be utilised to predict the occurrence of CMD in STEMI patients undergoing PPCI. Furthermore, an increased incidence of MACE has been observed in patients with an AMR >26.6 mmHg*s/dm. This convenient CMD assessment tool has the potential to assist in risk stratification and provide therapeutic guidance, thereby improving the prognosis of STEMI patients.
Impact on daily practice
The EARLY-MYO-AMR study demonstrated that angiographic microcirculatory resistance (AMR) is a reliable, convenient tool for assessing coronary microvascular dysfunction in ST-segment elevation myocardial infarction (STEMI) patients after primary percutaneous coronary intervention (PPCI). An AMR threshold of
>26.6 mmHg*s/dm was associated with a higher incidence of major adverse cardiovascular events, primarily driven by cardiac death and hospitalisation for heart failure. These findings suggest that AMR could serve as an alternative tool to the index of microcirculatory resistance for risk stratification in STEMI patients post-PPCI. Incorporating AMR assessment into routine PPCI clinical practice may help identify high-risk patients early and facilitate targeted interventions to improve long-term outcomes.
Acknowledgements
We would like to thank Editage for English language editing.
Funding
This work was supported by the National Key Research and Development Program of China (2022YFC3602400, 2022YFC3602404); the National Natural Science Foundation of China (82270474, 82470344); the Shanghai Shen Kang Hospital Development Centre (SHDC12022102, SHDC2023CRD026); and the Investigator-initiated Trial Program of Shanghai Pudong New Area Health Commission (the Cohort Study Program; 2025-PWDL-07). The funding source did not influence any part of the submitted work, including the study design, collection, analysis, and interpretation of data, the writing of the article, and the decision to submit for publication.
Conflict of interest statement
The authors have no conflicts of interest to declare.
Supplementary data
To read the full content of this article, please download the PDF.